 RSS Feed
 by Calculated Risk on 1/17/2022 10:01:00 AM
Monday, January 17, 2022
Housing Inventory January 17th Update: Inventory Down 2.9% Week-over-week; New Record Low
Tracking existing home inventory is very important in 2022.
Inventory usually declines sharply over the holidays and into January, and this is a new record low for this series.
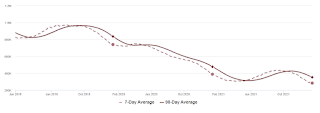
This inventory graph is courtesy of Altos Research.
As of January 14th, inventory was at 284 thousand (7-day average), compared to 389 thousand for the same week a year ago. That is a decline of 28.6%. Inventory was down 2.9% from the previous week.
A week ago, inventory was at 292 thousand, and was down 26.0% YoY.
Compared to the same week in 2019, inventory is down 61.6% from 740 thousand.
Last year, seasonally, inventory bottomed in April 2021 - very late - usually inventory bottoms in January or February. The key will be to watch if inventory bottoms in January or February this year.
Inventory peaked last year in early September, when inventory was at 437 thousand, so inventory is currently off about 35.1% from the peak for 2021.
Mike Simonsen discusses this data regularly on Youtube.
Six High Frequency Indicators for the Economy
by Calculated Risk on 1/17/2022 08:42:00 AM
These indicators are mostly for travel and entertainment. It is interesting to watch these sectors recover as the pandemic subsides.
Note: Gasoline consumption returned to pre-pandemic levels.
The TSA is providing daily travel numbers.
This data is as of January 16th.
 Click on graph for larger image.
This data shows the 7-day average of daily total traveler throughput from the TSA for 2019 (Light Blue), 2020 (Black), 2021 (Blue) and 2021 (Red).
The dashed line is the percent of 2019 for the seven-day average.
The 7-day average is down 23.9% from the same day in 2019 (76.1% of 2019). (Dashed line)
Air travel had been off about 20% relative to 2019 for most of the second half of 2021 (with some ups and downs) - but picked up over the Thanksgiving and Christmas holidays (solid leisure travel) - and has declined in early 2022 (weak business travel).
The second graph shows the 7-day average of the year-over-year change in diners as tabulated by OpenTable for the US and several selected cities.
IMPORTANT: OpenTable notes: "we’ve updated the data including downloadable dataset from January 1, 2021, onward to compare seated diners from 2021 to 2019, as opposed to year over year." Thanks!
 Thanks to OpenTable for providing this restaurant data:
This data is updated through January 15, 2022.
This data is "a sample of restaurants on the OpenTable network across all channels: online reservations, phone reservations, and walk-ins. For year-over-year comparisons by day, we compare to the same day of the week from the same week in the previous year."
Dining was mostly moving sideways, but there has been some decline recently, probably due to the winter wave of COVID. The 7-day average for the US is down 27% compared to 2019.
Thanks to OpenTable for providing this restaurant data:This data is updated through January 15, 2022.
This data is "a sample of restaurants on the OpenTable network across all channels: online reservations, phone reservations, and walk-ins. For year-over-year comparisons by day, we compare to the same day of the week from the same week in the previous year."
Dining was mostly moving sideways, but there has been some decline recently, probably due to the winter wave of COVID. The 7-day average for the US is down 27% compared to 2019.
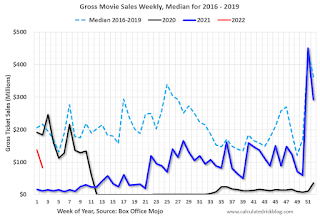 This data shows domestic box office for each week and the median for the years 2016 through 2019 (dashed light blue).
 Black is 2020, Blue is 2021 and Red is 2022.
The data is from BoxOfficeMojo through January 13th.
Note that the data is usually noisy week-to-week and depends on when blockbusters are released.
Movie ticket sales were at $83 million last week, down about 62% from the median for the week.
Note that the data is usually noisy week-to-week and depends on when blockbusters are released.
Movie ticket sales were at $83 million last week, down about 62% from the median for the week.
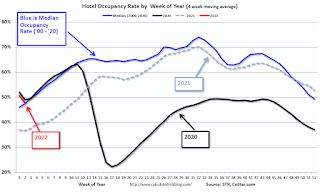 This graph shows the seasonal pattern for the hotel occupancy rate using the four-week average.
 The red line is for 2022, black is 2020, blue is the median, and dashed light blue is for 2021.
This data is through January 8th. The occupancy rate was down 14.9% compared to the same week in 2019.
lthough down compared to 2019, the 4-week average of the occupancy rate is close to the median rate for the previous 20 years (Blue).
Notes: Y-axis doesn't start at zero to better show the seasonal change.
Notes: Y-axis doesn't start at zero to better show the seasonal change.
The 4-week average of the occupancy rate will increase seasonally over the next few months. The key question is: How much business travel will return?
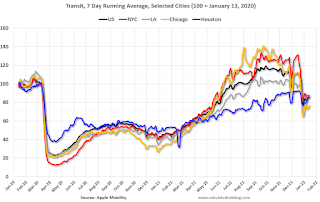
This graph is from Apple mobility. From Apple: "This data is generated by counting the number of requests made to Apple Maps for directions in select countries/regions, sub-regions, and cities." This is just a general guide - people that regularly commute probably don't ask for directions.
 This data is through January 13th
 for the United States and several selected cities.
The graph is the running 7-day average to remove the impact of weekends.
IMPORTANT: All data is relative to January 13, 2020. This data is NOT Seasonally Adjusted. People walk and drive more when the weather is nice, so I'm just using the transit data.
According to the Apple data directions requests, public transit in the 7-day average for the US is at 86% of the January 2020 level.
Here is some interesting data on New York subway usage (HT BR).
 This graph is from Todd W Schneider.
 This graph shows how much MTA traffic has recovered in each borough (Graph starts at first week in January 2020 and 100 = 2019 average).
Manhattan is at about 29% of normal (impacted by holidays too).
This data is through Friday,January 14th.
He notes: "Data updates weekly from the MTA’s public turnstile data, usually on Saturday mornings".
Sunday, January 16, 2022
Used Vehicle Wholesale Prices
by Calculated Risk on 1/16/2022 10:56:00 AM
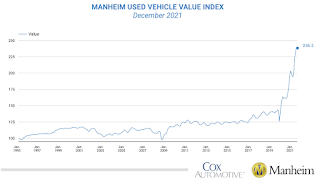
Since the pandemic has disrupted new car production and sales, used car prices have increased sharply. This has pushed up inflation ("Used Cars" were up 51% annualized in December).
Here is some data on used vehicle wholesale prices. From Manheim Consulting: Wholesale Prices Increased at Slowing Pace on Seasonally Adjusted Basis in December
Wholesale used vehicle prices (on a mix-, mileage-, and seasonally adjusted basis) increased 1.6% month-over-month in December. This brought the Manheim Used Vehicle Value Index to 236.2, a 46.6% increase from a year ago. The non-adjusted price change in December was a decline of 1.1% compared to November, leaving the unadjusted average price up 43.4% year-over-year.
...
According to Cox Automotive estimates, total used vehicle sales were down 4% year-over-year in December. We estimate the December used SAAR to be 39.1 million, down from 40.6 million last December and flat compared to November’s revised 39.1 million SAAR. The December used retail SAAR estimate is 20.4 million, down from 21.6 million last year and flat month-over-month.
 Click on graph for larger image.
This index from Manheim Consulting is based on all completed sales transactions at Manheim’s U.S. auctions.
According to the BLS, "Used cars and trucks in U.S. city average, all urban consumers, seasonally adjusted" is up 55% since the low in June 2020.
The Manheim index suggests this might slow.
Saturday, January 15, 2022
Real Estate Newsletter Articles this Week
by Calculated Risk on 1/15/2022 02:11:00 PM
At the Calculated Risk Real Estate Newsletter this week:
• Lawler: More on Investor Purchases of Single-Family Homes Single-Family Rental Trade Association Butchers Analysis of Investor Home Purchase Reports
• 2nd Look at Local Housing Markets in December Adding Jacksonville, New Hampshire, North Texas, Portland, and Northwest (Seattle)
• Homebuilder Comments in December: “Still a ton of demand for new homes" “Costs are through the roof!”
• Mortgage Rates: Moving on Up Refinance Activity Will Slow Sharply
• 3rd Look at Local Housing Markets in December Adding Albuquerque, Colorado, Houston, Memphis, Nashville, Sacramento, Santa Clara and South Carolina
This is usually published several times a week, and provides more in-depth analysis of the housing market.
The blog will continue as always!
You can subscribe at https://calculatedrisk.substack.com/ Most content is available for free, but please subscribe!.
You can subscribe at https://calculatedrisk.substack.com/ Most content is available for free, but please subscribe!.
Schedule for Week of January 16, 2022
by Calculated Risk on 1/15/2022 08:11:00 AM
The key reports this week are December housing starts and existing home sales.
For manufacturing, the January NY and Philly Fed manufacturing surveys will be released.
All US markets will be closed in observance of Martin Luther King Jr. Day
8:30 AM: The New York Fed Empire State manufacturing survey for January. The consensus is for a reading of 26.0, down from 31.9.
10:00 AM: The January NAHB homebuilder survey. The consensus is for a reading of 84, unchanged from 84 in December. Any number above 50 indicates that more builders view sales conditions as good than poor.
7:00 AM ET: The Mortgage Bankers Association (MBA) will release the results for the mortgage purchase applications index.
 8:30 AM: Housing Starts for December.
 This graph shows single and multi-family housing starts since 1968.
The consensus is for 1.655 million SAAR, down from 1.679 million SAAR.
During the day: The AIA's Architecture Billings Index for December (a leading indicator for commercial real estate).
8:30 AM: The initial weekly unemployment claims report will be released. The consensus is for 230 thousand initial claims.
8:30 AM: the Philly Fed manufacturing survey for January. The consensus is for a reading of 23.0, up from 15.4.
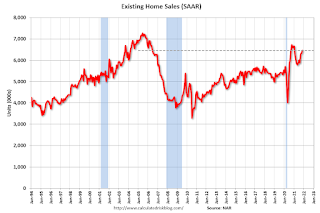 10:00 AM: Existing Home Sales for December from the National Association of Realtors (NAR). The consensus is for 6.45 million SAAR, down from 6.46 million.
The graph shows existing home sales from 1994 through the report last month.
No major economic releases are scheduled.
Friday, January 14, 2022
COVID January 14, 2022: Record Cases and Hospitalizations
by Calculated Risk on 1/14/2022 08:18:00 PM
Next update on COVID will be Tuesday (focus on hospitalizations and deaths):
| COVID Metrics | ||||
|---|---|---|---|---|
| Now | Week Ago | Goal | ||
| Percent fully Vaccinated | 62.9% | --- | ≥70.0%1 | |
| Fully Vaccinated (millions) | 208.8 | --- | ≥2321 | |
| New Cases per Day3🚩 | 794,587 | 616,246 | ≤5,0002 | |
| Hospitalized3🚩 | 131,332 | 100,684 | ≤3,0002 | |
| Deaths per Day3🚩 | 1,730 | 1,367 | ≤502 | |
| 1 Minimum to achieve "herd immunity" (estimated between 70% and 85%). 2my goals to stop daily posts, 37-day average for Cases, Currently Hospitalized, and Deaths 🚩 Increasing 7-day average week-over-week for Cases, Hospitalized, and Deaths ✅ Goal met. | ||||
 Click on graph for larger image.
This graph shows the daily (columns) and 7-day average (line) of positive tests reported.
The 7-day average for new cases and hospitalizations are at record levels.
Fortunately, deaths are still only half the previous 7-day average record of 3,421 per day in January 2021.
Q4 GDP Forecasts: Around 6%
by Calculated Risk on 1/14/2022 12:59:00 PM
From BofA:
Our 4Q GDP tracking estimate remains at 5.5% qoq saar. [January 14 estimate]From Goldman Sachs:
emphasis added
We lowered our Q4 GDP tracking estimate by ½pp to +6½% (qoq ar), to reflect the downside surprises this morning on both industrial production and retail sales. [January 14 estimate]And from the Altanta Fed: GDPNow
The GDPNow model estimate for real GDP growth (seasonally adjusted annual rate) in the fourth quarter of 2021 is 5.0 percent on January 14, down from 6.8 percent on January 10. [January 14 estimate]
Industrial Production Decreased 0.1 Percent in December
by Calculated Risk on 1/14/2022 09:20:00 AM
From the Fed: Industrial Production and Capacity Utilization
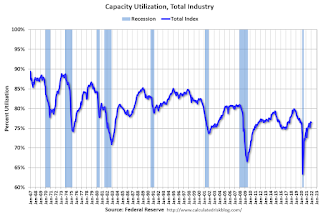
Industrial production declined 0.1 percent in December. Losses of 0.3 percent for manufacturing and 1.5 percent for utilities were mostly offset by a gain of 2.0 percent for mining. For the fourth quarter as a whole, total industrial production rose at an annual rate of 4.0 percent. At 101.9 percent of its 2017 average, total industrial production in December was 3.7 percent higher than it was at the end of 2020 and 0.6 percent above its pre-pandemic (February 2020) reading. Capacity utilization for the industrial sector edged down 0.1 percentage point in December to 76.5 percent, a rate that is 3.1 percentage points below its long-run (1972–2020) average.
emphasis added
 Click on graph for larger image.
This graph shows Capacity Utilization. This series is up from the record low set in April 2020, and above the level in February 2020 (pre-pandemic).
Capacity utilization at 76.5% is 3.1% below the average from 1972 to 2020. This was well below consensus expectations.
Note: y-axis doesn't start at zero to better show the change.
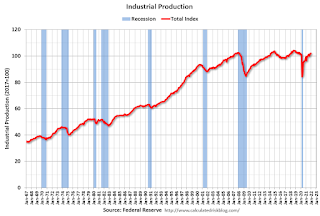 The second graph shows industrial production since 1967.
Industrial production decreased in December to 101.9. This is above the February 2020 level.
The change in industrial production was below consensus expectations.
Retail Sales Decreased 1.9% in December
by Calculated Risk on 1/14/2022 08:38:00 AM
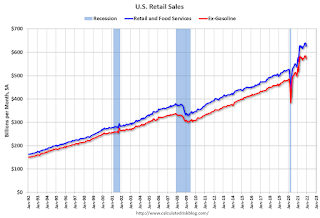
On a monthly basis, retail sales were decreased 1.9% from November to December (seasonally adjusted), but sales were up 16.9 percent from December 2020.
From the Census Bureau report:
Advance estimates of U.S. retail and food services sales for December 2021, adjusted for seasonal variation and holiday and trading-day differences, but not for price changes, were $626.8 billion, a decrease of 1.9 percent from the previous month, but 16.9 percent above December 2020.
emphasis added
 Click on graph for larger image.
This graph shows retail sales since 1992. This is monthly retail sales and food service, seasonally adjusted (total and ex-gasoline).
Retail sales ex-gasoline were down 2.0% in December.
The second graph shows the year-over-year change in retail sales and food service (ex-gasoline) since 1993.
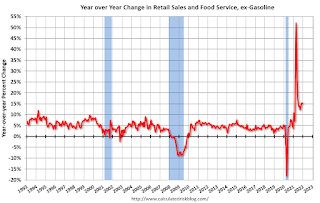 Retail and Food service sales, ex-gasoline, increased by 15.2% on a YoY basis.
Sales in December were well below expectations, and sales in October and November were revised down, combined.
Thursday, January 13, 2022
Friday: Retail Sales, Industrial Production
by Calculated Risk on 1/13/2022 08:16:00 PM
Friday:
• At 8:30 AM ET, Retail sales for December is scheduled to be released. The consensus is for a 0.1% decrease in retail sales.
• At 9:15 AM, The Fed will release Industrial Production and Capacity Utilization for December. The consensus is for a 0.3% increase in Industrial Production, and for Capacity Utilization to increase to 77.0%.
• At 10:00 AM, University of Michigan's Consumer sentiment index (Preliminary for January).
And on COVID (focus on hospitalizations and deaths):
| COVID Metrics | ||||
|---|---|---|---|---|
| Now | Week Ago | Goal | ||
| Percent fully Vaccinated | 62.7% | --- | ≥70.0%1 | |
| Fully Vaccinated (millions) | 208.2 | --- | ≥2321 | |
| New Cases per Day3🚩 | 782,765 | 587,722 | ≤5,0002 | |
| Hospitalized3🚩 | 128,222 | 95,853 | ≤3,0002 | |
| Deaths per Day3🚩 | 1,729 | 1,263 | ≤502 | |
| 1 Minimum to achieve "herd immunity" (estimated between 70% and 85%). 2my goals to stop daily posts, 37-day average for Cases, Currently Hospitalized, and Deaths 🚩 Increasing 7-day average week-over-week for Cases, Hospitalized, and Deaths ✅ Goal met. | ||||
 Click on graph for larger image.
This graph shows the daily (columns) and 7-day average (line) of positive tests reported.
The 7-day average for new cases and hospitalizations are at record levels.
Fortunately, deaths are still only half the previous 7-day average record of 3,421 per day in January 2021.


