 RSS Feed
 by Calculated Risk on 1/21/2022 10:16:00 AM
Friday, January 21, 2022
Q4 GDP Forecasts: 5% to 6%
The advance estimate of Q4 GDP will be released on Thursday, January 27th. The consensus estimate is for 6.0% real GDP growth (seasonally adjusted annual rate).
From BofA:
We expect the advance estimate of 4Q GDP to show a pickup in growth to 5.0% qoq saar. [January 21 estimate]From Goldman Sachs:
emphasis added
We left our Q4 GDP tracking estimate unchanged at +6.5% (qoq ar). [January 20 estimate]And from the Altanta Fed: GDPNow
The GDPNow model estimate for real GDP growth (seasonally adjusted annual rate) in the fourth quarter of 2021 is 5.1 percent on January 19, up from 5.0 percent on January 14. [January 19 estimate]
Black Knight: National Mortgage Delinquency Rate Decreased in December; Foreclosures at Record Low
by Calculated Risk on 1/21/2022 08:29:00 AM
Note: At the beginning of the pandemic, the delinquency rate increased sharply (see table below). Loans in forbearance are counted as delinquent in this survey, but those loans are not reported as delinquent to the credit bureaus.
From Black Knight: Black Knight: 2021 Ends With Foreclosures at All-Time Low and Near Record-Low Delinquency Rate; Serious Delinquencies Still More than 2X Pre-Pandemic Levels
• At 3.38% entering January, the national delinquency rate sits just 0.1% above February 2020’s near record-low of 3.28%, just prior to the onset of the pandemicAccording to Black Knight's First Look report, the percent of loans delinquent decreased 5.9% in December compared to November and decreased 44% year-over-year.
• However, over half a million excess serious delinquencies remain – borrowers 90 or more days past due on their mortgages, including those in active forbearance – more than twice pre-pandemic levels
• Just 0.24% of loans are in active foreclosure in December – an all-time low – with the month’s 4,100 foreclosure starts some 90% below December 2019 levels
• While roughly twice as many foreclosure sales (completions) occurred in the month as compared to December 2020, there were only one-third as many as in pre-pandemic December 2019
• Given the volume of borrowers who’ve exited forbearance protections in recent months, the industry must keep a very close eye on foreclosure metrics moving forward in 2022
• Prepayment activity fell by more than 7% in December and is poised to fall even further as rising rates continue to erode refinance incentive
emphasis added
The percent of loans in the foreclosure process decreased 3.8% in December and were down 28% over the last year.
Black Knight reported the U.S. mortgage delinquency rate (loans 30 or more days past due, but not in foreclosure) was 3.38% in December, down from 3.59% in November.
The percent of loans in the foreclosure process decreased in December to 0.24%, from 0.25% in November.
The number of delinquent properties, but not in foreclosure, is down 1,452,000 properties year-over-year, and the number of properties in the foreclosure process is down 50,000 properties year-over-year.
| Black Knight: Percent Loans Delinquent and in Foreclosure Process | ||||
|---|---|---|---|---|
| Dec 2021 | Nov 2021 | Dec 2020 | Dec 2019 | |
| Delinquent | 3.38% | 3.59% | 6.08% | 3.40% |
| In Foreclosure | 0.24% | 0.25% | 0.33% | 0.46% |
| Number of properties: | ||||
| Number of properties that are delinquent, but not in foreclosure: | 1,799,000 | 1,906,000 | 3,251,000 | 1,803,000 |
| Number of properties in foreclosure pre-sale inventory: | 128,000 | 132,000 | 178,000 | 245,000 |
| Total Properties | 1,927,000 | 2,039,000 | 3,429,000 | 2,047,000 |
Thursday, January 20, 2022
COVID Update, January 20, 2022
by Calculated Risk on 1/20/2022 08:54:00 PM
| COVID Metrics | ||||
|---|---|---|---|---|
| Now | Week Ago | Goal | ||
| Percent fully Vaccinated | 63.2% | --- | ≥70.0%1 | |
| Fully Vaccinated (millions) | 209.8 | --- | ≥2321 | |
| New Cases per Day3 | 744,615 | 783,922 | ≤5,0002 | |
| Hospitalized3🚩 | 143,874 | 129,442 | ≤3,0002 | |
| Deaths per Day3 | 1,749 | 1,754 | ≤502 | |
| 1 Minimum to achieve "herd immunity" (estimated between 70% and 85%). 2my goals to stop daily posts, 37-day average for Cases, Currently Hospitalized, and Deaths 🚩 Increasing 7-day average week-over-week for Cases, Hospitalized, and Deaths ✅ Goal met. | ||||
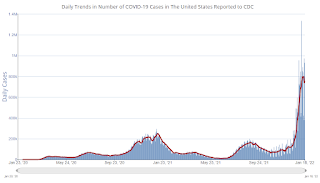
 Click on graph for larger image.
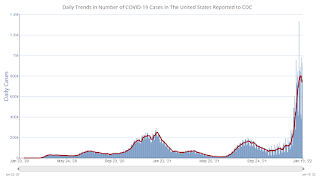
This graph shows the daily (columns) and 7-day average (line) of positive tests reported.
The 7-day average for new cases has declined slightly, but hospitalizations are at record levels.
Fortunately, deaths are still only half the previous 7-day average record of 3,421 per day in January 2021.
Second Home Market: South Lake Tahoe in December
by Calculated Risk on 1/20/2022 03:33:00 PM
With the pandemic, there was a surge in 2nd home buying. In response, Fannie made some lending changes, from Jann Swanson at MortgageNewsDaily: Fannie Warns Lenders on Investment Properties and 2nd Homes.
I'm looking at data for some second home markets - and I'm tracking those markets to see if there is an impact from the lending changes.
This graph is for South Lake Tahoe since 2004 through December 2021, and shows inventory (blue), and the year-over-year (YoY) change in the median price (12-month average).
Note: The median price is distorted by the mix, but this is the available data.

Following the housing bubble, prices declined for several years in South Lake Tahoe, with the median price falling about 50% from the bubble peak.
Currently inventory is still very low - above the record low set in March 2021, but down YoY - and prices are up sharply YoY.
This will be interesting to watch, but so far there isn't any evidence of a 2nd home slowdown in these numbers (The fires last year didn't seem to have impacted these numbers either).
More Analysis on December Existing Home Sales
by Calculated Risk on 1/20/2022 10:40:00 AM
Today, in the CalculatedRisk Real Estate Newsletter: Existing-Home Sales Decreased to 6.18 million in December
Excerpt:
This graph shows existing home sales by month for 2020 and 2021.There is much more in the post. You can subscribe at https://calculatedrisk.substack.com/ (Most content is available for free, so please subscribe).
This was the fifth consecutive month with sales down year-over-year. Sales will likely be down YoY in January 2022 too since were exceptionally strong last Winter.
...
[and on inventory] According to the NAR, inventory decreased to 0.92 million in December from 1.11 million in November. Inventory usually declines significantly in November and December as potential sellers remove their homes from the market for the holidays. Inventory is now at a record low.
NAR: Existing-Home Sales Decreased to 6.18 million in December
by Calculated Risk on 1/20/2022 10:18:00 AM
From the NAR: Annual Existing-Home Sales Hit Highest Mark Since 2006
Existing-home sales declined in December, snapping a streak of three straight months of gains, according to the National Association of Realtors®. Each of the four major U.S. regions witnessed sales fall in December from both a month-over-month and a year-over-year basis. Despite the drop, overall sales for 2021 increased 8.5%.
Total existing-home sales, completed transactions that include single-family homes, townhomes, condominiums and co-ops, dropped 4.6% from November to a seasonally adjusted annual rate of 6.18 million in December. From a year-over-year perspective, sales waned 7.1% (6.65 million in December 2020).
...
Total housing inventory at the end of December amounted to 910,000 units, down 18.0% from November and down 14.2% from one year ago (1.06 million). Unsold inventory sits at a 1.8-month supply at the present sales pace, down from 2.1 months in November and from 1.9 months in December 2020.
emphasis added
 Click on graph for larger image.
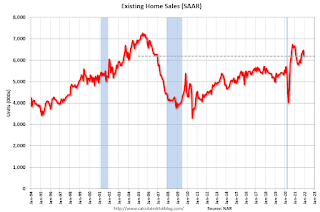
This graph shows existing home sales, on a Seasonally Adjusted Annual Rate (SAAR) basis since 1993.
Sales in December (6.18 million SAAR) were down 4.6% from last month and were 7.1% below the December 2020 sales rate.
The second graph shows nationwide inventory for existing homes.
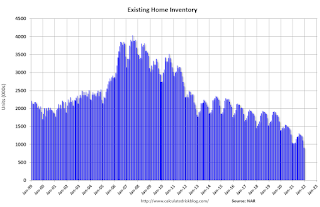 According to the NAR, inventory decreased to 0.91 million in December from 1.11 million in November.
Headline inventory is not seasonally adjusted, and inventory usually decreases to the seasonal lows in December and January, and peaks in mid-to-late summer.
The last graph shows the year-over-year (YoY) change in reported existing home inventory and months-of-supply. Since inventory is not seasonally adjusted, it really helps to look at the YoY change. Note: Months-of-supply is based on the seasonally adjusted sales and not seasonally adjusted inventory.
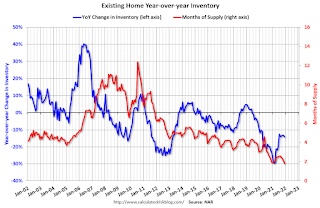 Inventory was down 14.2% year-over-year in December compared to December 2020.
Months of supply declined to 1.8 months in December from 2.1 months in November.
This was below the consensus forecast. I'll have more later.
The last graph shows the year-over-year (YoY) change in reported existing home inventory and months-of-supply. Since inventory is not seasonally adjusted, it really helps to look at the YoY change. Note: Months-of-supply is based on the seasonally adjusted sales and not seasonally adjusted inventory.
Inventory was down 14.2% year-over-year in December compared to December 2020. Months of supply declined to 1.8 months in December from 2.1 months in November.
This was below the consensus forecast. I'll have more later.
Weekly Initial Unemployment Claims Increase to 286,000
by Calculated Risk on 1/20/2022 08:34:00 AM
Note: This report is for the BLS January reference week.
The DOL reported:
In the week ending January 15, the advance figure for seasonally adjusted initial claims was 286,000, an increase of 55,000 from the previous week's revised level. The previous week's level was revised up by 1,000 from 230,000 to 231,000. The 4-week moving average was 231,000, an increase of 20,000 from the previous week's revised average. The previous week's average was revised up by 250 from 210,750 to 211,000.The following graph shows the 4-week moving average of weekly claims since 1971.
emphasis added
 Click on graph for larger image.
The dashed line on the graph is the current 4-week average. The four-week average of weekly unemployment claims increased to 231,000.
The previous week was revised up.
Weekly claims were well above the consensus forecast, likely due to the current COVID wave.
Wednesday, January 19, 2022
Thursday: Existing Home Sales, Unemployment Claims, Philly Fed Mfg
by Calculated Risk on 1/19/2022 07:10:00 PM
Thursday:
• At 8:30 AM ET, The initial weekly unemployment claims report will be released. The consensus is for 230 thousand initial claims.
• Also at 8:30 AM, the Philly Fed manufacturing survey for January. The consensus is for a reading of 23.0, up from 15.4.
• At 10:00 AM, Existing Home Sales for December from the National Association of Realtors (NAR). The consensus is for 6.45 million SAAR, down from 6.46 million. Housing economist Tom Lawler expects the NAR to report 6.33 million SAAR.
On COVID (focus on hospitalizations and deaths):
| COVID Metrics | ||||
|---|---|---|---|---|
| Now | Week Ago | Goal | ||
| Percent fully Vaccinated | 63.1% | --- | ≥70.0%1 | |
| Fully Vaccinated (millions) | 209.5 | --- | ≥2321 | |
| New Cases per Day3 | 755,095 | 763,722 | ≤5,0002 | |
| Hospitalized3🚩 | 142,595 | 125,106 | ≤3,0002 | |
| Deaths per Day3 | 1,669 | 1,687 | ≤502 | |
| 1 Minimum to achieve "herd immunity" (estimated between 70% and 85%). 2my goals to stop daily posts, 37-day average for Cases, Currently Hospitalized, and Deaths 🚩 Increasing 7-day average week-over-week for Cases, Hospitalized, and Deaths ✅ Goal met. | ||||
 Click on graph for larger image.
This graph shows the daily (columns) and 7-day average (line) of positive tests reported.
The 7-day average for new cases are just below record levels. Hospitalizations are at record levels.
Fortunately, deaths are still only half the previous 7-day average record of 3,421 per day in January 2021.
AIA: "Architecture firms end 2021 on a strong note" in December
by Calculated Risk on 1/19/2022 12:27:00 PM
Note: This index is a leading indicator primarily for new Commercial Real Estate (CRE) investment.
From the AIA: Architecture firms end 2021 on a strong note
As architecture firms ended 2021 on a high note with strong business conditions, staff recruitment is becoming a growing concern among firms.
December’s Architectural Billings Index (ABI) score of 52.0 was an increase from 51.0 in November (any score over 50 indicates billings growth). Despite a variety of concerns related to the omicron variant, labor shortages, and rising prices as well as limited availability of construction materials, firms continued to report a robust supply of work in the pipeline. Inquiries into new work and the value of new design contracts both remained strong, and backlogs, at an average of 6.5 months, remained near their highest levels since the AIA began tracking this metric in 2010.
“Since demand for design projects has been healthy over the last year, recruiting architectural staff to keep up with project workloads has been a growing concern for firms,” said AIA Chief Economist, Kermit Baker, Hon. AIA, PhD. “Architecture is one of the few industries where payrolls have already surpassed their pre-pandemic high, so meeting future staffing needs is a challenge that most firms will need to confront."
...
• Regional averages: South (56.4); Midwest (51.0); West (47.5); Northeast (45.3)
• Sector index breakdown: mixed practice (60.6); multi-family residential (49.2); commercial/industrial (49.2); institutional (47.6)
emphasis added
 Click on graph for larger image.
This graph shows the Architecture Billings Index since 1996. The index was at 52.0 in December, up from 51.0 in November. Anything above 50 indicates expansion in demand for architects' services.
Note: This includes commercial and industrial facilities like hotels and office buildings, multi-family residential, as well as schools, hospitals and other institutions.
This index was below 50 for eleven consecutive months but has been positive for the last eleven months.
The eleven months of decline represented a significant decrease in design services and suggested a decline in CRE investment through most of 2021 (This index usually leads CRE investment by 9 to 12 months), however this index suggests a pickup in CRE investment in 2022.
December Housing Starts: Most Housing Units Under Construction Since 1973
by Calculated Risk on 1/19/2022 10:42:00 AM
Today, in the CalculatedRisk Real Estate Newsletter: December Housing Starts: Most Housing Units Under Construction Since 1973
Excerpt:
The 1.595 million total starts in 2021 were up 15.6% from 1.380 million in 2020. Starts in 2021 were the most since 2006 when 1.801 million units were started.There is much more in the post. You can subscribe at https://calculatedrisk.substack.com/ (Most content is available for free, so please subscribe).
The fourth graph shows housing starts under construction, Seasonally Adjusted (SA).
Red is single family units. Currently there are 769 thousand single family units under construction (SA). This is the highest level since February 2007.
For single family, most of these homes are already sold (Census counts sales when contract is signed). The reason there are so many homes is probably due to construction delays. Since most of these are already sold, it is unlikely this is “overbuilding”, or that this will impact prices (although the buyers will be moving out of their current home or apartment once these homes are completed).
Blue is for 2+ units. Currently there are 750 thousand multi-family units under construction. This is the highest level since July 1974! For multi-family, construction delays are probably also a factor. The completion of these units should help with rent pressure.
Census will release data in March (part of February survey) on the length of time from start to completion, and that will probably show long delays in 2021. In 2020, it took an average of 6.8 months from start to completion for single family homes, and 15.4 months for buildings with 2 or more units.
Combined, there are 1.519 million units under construction. This is the most since November 1973.


