 RSS Feed
 by Calculated Risk on 1/26/2022 02:04:00 PM
Wednesday, January 26, 2022
FOMC Statement: End Asset Purchases in Early March, "Soon appropriate" to Raise Rates
Fed Chair Powell press conference video here starting at 2:30 PM ET.
FOMC Statement:
Indicators of economic activity and employment have continued to strengthen. The sectors most adversely affected by the pandemic have improved in recent months but are being affected by the recent sharp rise in COVID-19 cases. Job gains have been solid in recent months, and the unemployment rate has declined substantially. Supply and demand imbalances related to the pandemic and the reopening of the economy have continued to contribute to elevated levels of inflation. Overall financial conditions remain accommodative, in part reflecting policy measures to support the economy and the flow of credit to U.S. households and businesses.
The path of the economy continues to depend on the course of the virus. Progress on vaccinations and an easing of supply constraints are expected to support continued gains in economic activity and employment as well as a reduction in inflation. Risks to the economic outlook remain, including from new variants of the virus.
The Committee seeks to achieve maximum employment and inflation at the rate of 2 percent over the longer run. In support of these goals, the Committee decided to keep the target range for the federal funds rate at 0 to 1/4 percent. With inflation well above 2 percent and a strong labor market, the Committee expects it will soon be appropriate to raise the target range for the federal funds rate. The Committee decided to continue to reduce the monthly pace of its net asset purchases, bringing them to an end in early March. Beginning in February, the Committee will increase its holdings of Treasury securities by at least $20 billion per month and of agency mortgage‑backed securities by at least $10 billion per month. The Federal Reserve's ongoing purchases and holdings of securities will continue to foster smooth market functioning and accommodative financial conditions, thereby supporting the flow of credit to households and businesses.
In assessing the appropriate stance of monetary policy, the Committee will continue to monitor the implications of incoming information for the economic outlook. The Committee would be prepared to adjust the stance of monetary policy as appropriate if risks emerge that could impede the attainment of the Committee's goals. The Committee's assessments will take into account a wide range of information, including readings on public health, labor market conditions, inflation pressures and inflation expectations, and financial and international developments.
Voting for the monetary policy action were Jerome H. Powell, Chair; John C. Williams, Vice Chair; Michelle W. Bowman; Lael Brainard; James Bullard; Esther L. George; Patrick Harker; Loretta J. Mester; and Christopher J. Waller. Patrick Harker voted as an alternate member at this meeting.
emphasis added
December New Home Sales: Inventory of homes under construction highest since 2007
by Calculated Risk on 1/26/2022 10:47:00 AM
Today, in the Calculated Risk Real Estate Newsletter: December New Home Sales: Inventory of homes under construction highest since 2007
Brief excerpt:
The next graph shows new home sales for 2020 and 2021 by month (Seasonally Adjusted Annual Rate). Sales in 2021 (762 thousand) were 7.3% below sales in 2020 (822 thousand).You can subscribe at https://calculatedrisk.substack.com/.
The year-over-year comparisons were easy in the first half of 2021 - especially in March and April. However, sales will be down year-over-year again in January since the sales were delayed in 2020 - and sales in the winter were strong.
...
The next graph shows the months of supply by stage of construction. “Months of supply” is inventory at each stage, divided by the sales rate.
The inventory of completed homes for sale was at 39 thousand in December, up from the record low of 33 thousand in March, April, May and July 2021. That is about 0.6 months of completed supply (red line). This is about half the normal level.
The inventory of new homes under construction is at 3.9 months (blue line) - well above the normal level. This elevated level of homes under construction is due to supply chain constraints. And 101 thousand homes have not been started - about 1.5 months of supply (grey line) - almost double the normal level.
New Home Sales increase to 811,000 Annual Rate in December; Sales down 7.3% in 2021
by Calculated Risk on 1/26/2022 10:09:00 AM
The Census Bureau reports New Home Sales in December were at a seasonally adjusted annual rate (SAAR) of 744 thousand.
The previous three months were revised down, combined.
Sales of new single‐family houses in December 2021 were at a seasonally adjusted annual rate of 811,000, according to estimates released jointly today by the U.S. Census Bureau and the Department of Housing and Urban Development. This is 11.9 percent above the revised November rate of 725,000, but is 14.0 percent below the December 2020 estimate of 943,000.
An estimated 762,000 new homes were sold in 2021. This is 7.3 percent below the 2020 figure of 822,000.
emphasis added
 Click on graph for larger image.
The first graph shows New Home Sales vs. recessions since 1963. The dashed line is the current sales rate.
New home sales are now declining year-over-year since sales soared following the first few months of the pandemic.
The second graph shows New Home Months of Supply.
 The months of supply decreased in December to 6.0 months from 6.6 months in November.
 The all-time record high was 12.1 months of supply in January 2009. The all-time record low was 3.5 months, most recently in October 2020.
This is at the top of the normal range (about 4 to 6 months of supply is normal).
"The seasonally‐adjusted estimate of new houses for sale at the end of December was 403,000. This represents a supply of 6.0 months at the current sales rate."
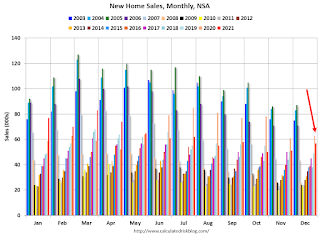 The last graph shows sales NSA (monthly sales, not seasonally adjusted annual rate).
In December 2021 (red column), 57 thousand new homes were sold (NSA). Last year, 61 thousand homes were sold in December.
The all-time high for December was 87 thousand in 2005, and the all-time low for December was 23 thousand in 2010.
This was above expectations of 760 thousand SAAR, however sales in the three previous months were revised down, combined. I'll have more later today.
MBA: Mortgage Applications Decrease in Latest Weekly Survey
by Calculated Risk on 1/26/2022 07:00:00 AM
From the MBA: Mortgage Applications Decrease in Latest MBA Weekly Survey
Mortgage applications decreased 7.1 percent from one week earlier, according to data from the Mortgage Bankers Association’s (MBA) Weekly Mortgage Applications Survey for the week ending January 21, 2022.
... The Refinance Index decreased 13 percent from the previous week and was 53 percent lower than the same week one year ago. The seasonally adjusted Purchase Index decreased 2 percent from one week earlier. The unadjusted Purchase Index increased 5 percent compared with the previous week and was 11 percent lower than the same week one year ago.
“All mortgage rates in MBA’s survey continued to climb, with the 30-year fixed rate rising for the fifth consecutive week to its highest level since March 2020. The 30-year fixed rate is now 77 basis points higher than it was a year ago,” said Joel Kan, MBA’s Associate Vice President of Economic and Industry Forecasting. “Unsurprisingly, borrower demand for refinances subsided, with applications falling for the fourth straight week. After almost two years of lower rates, there are not many borrowers left who have an incentive to refinance. Of those who are still in the market for a refinance, these higher rates are proving much less attractive to them.”
Added Kan, “The decline in purchase activity was led by a 5 percent drop in government applications, compared to a modest less than one percent decline in conventional applications. The relative weakness in government purchase activity continues to contribute to higher loan sizes. The average purchase loan size was $433,500, eclipsing the previous record of $418,500 set two weeks ago.”
...
The average contract interest rate for 30-year fixed-rate mortgages with conforming loan balances ($647,200 or less) increased to 3.72 percent from 3.64 percent, with points decreasing to 0.43 from 0.45 (including the origination fee) for 80 percent loan-to-value ratio (LTV) loans.
emphasis added
 Click on graph for larger image.
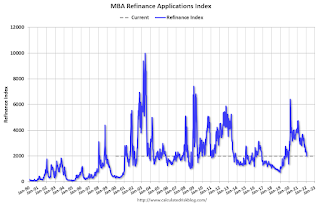
The first graph shows the refinance index since 1990.
With higher mortgage rates, the refinance index has declined sharply.
The second graph shows the MBA mortgage purchase index
 According to the MBA, purchase activity is down 11% year-over-year unadjusted.
Note: Red is a four-week average (blue is weekly).
Tuesday, January 25, 2022
Wednesday: New Home Sales, FOMC Statement
by Calculated Risk on 1/25/2022 08:59:00 PM
Wednesday:
• At 7:00 AM ET, The Mortgage Bankers Association (MBA) will release the results for the mortgage purchase applications index.
• At 10:00 AM, New Home Sales for December from the Census Bureau. The consensus is for 760 thousand SAAR, up from 744 thousand in November.
• At 2:00 PM, FOMC Meeting Statement. The FOMC is expected to announce the final asset purchases.
• At 2:30 PM, Fed Chair Jerome Powell holds a press briefing following the FOMC announcement.
On COVID (focus on hospitalizations and deaths):
| COVID Metrics | ||||
|---|---|---|---|---|
| Now | Week Ago | Goal | ||
| Percent fully Vaccinated | 63.5% | --- | ≥70.0%1 | |
| Fully Vaccinated (millions) | 210.7 | --- | ≥2321 | |
| New Cases per Day3 | 692,359 | 737,733 | ≤5,0002 | |
| Hospitalized3 | 142,814 | 143,339 | ≤3,0002 | |
| Deaths per Day3🚩 | 2,166 | 1,791 | ≤502 | |
| 1 Minimum to achieve "herd immunity" (estimated between 70% and 85%). 2my goals to stop daily posts, 37-day average for Cases, Currently Hospitalized, and Deaths 🚩 Increasing 7-day average week-over-week for Cases, Hospitalized, and Deaths ✅ Goal met. | ||||
 Click on graph for larger image.
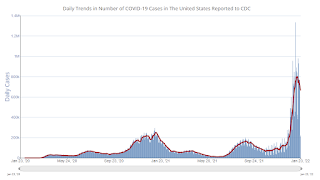
This graph shows the daily (columns) and 7-day average (line) of positive tests reported.
New cases are now declining.
Unfortunately, deaths are still rising - now averaging over 2 thousand deaths per day - but well below the previous 7-day average record of 3,421 in January 2021.
Freddie Mac: Mortgage Serious Delinquency Rate decreased in December
by Calculated Risk on 1/25/2022 05:03:00 PM
Freddie Mac reported that the Single-Family serious delinquency rate in December was 1.12%, down from 1.24% in November. Freddie's rate is down year-over-year from 2.64% in December 2020.
Freddie's serious delinquency rate peaked in February 2010 at 4.20% following the housing bubble and peaked at 3.17% in August 2020 during the pandemic.
These are mortgage loans that are "three monthly payments or more past due or in foreclosure".

Mortgages in forbearance are being counted as delinquent in this monthly report but are not reported to the credit bureaus.
This is very different from the increase in delinquencies following the housing bubble. Lending standards have been fairly solid over the last decade, and most of these homeowners have equity in their homes - and they will be able to restructure their loans once (if) they are employed.
Also - for multifamily - delinquencies were at 0.08%, down from the peak of 0.20% in April 2021.
January Vehicle Sales Forecast: Increase to 15.1 million SAAR
by Calculated Risk on 1/25/2022 11:55:00 AM
From WardsAuto: January U.S. Light-Vehicle Sales Tracking to 7-Month-High Annualized Rate (pay content)
Low inventories and supply issues continue to impact vehicle sales, but it appears the supply chain disruption bottom is in, and sales are starting to recover.
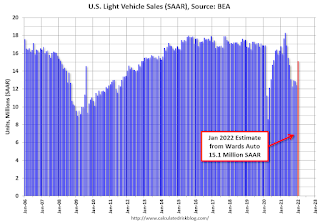
This graph shows actual sales from the BEA (Blue), and Wards forecast for January (Red).
The Wards forecast of 15.1 million SAAR, would be up about 21% from last month, and down 10% from a year ago (sales were solid in January 2021, as sales recovered from the depths of the pandemic, and weren't yet impacted by supply chain issues).
Comments on Case-Shiller and FHFA House Price Increases
by Calculated Risk on 1/25/2022 09:51:00 AM
Today, in the Calculated Risk Real Estate Newsletter: Case-Shiller National Index up 18.8% Year-over-year in November
Excerpt:
This graph below shows existing home months-of-supply (inverted, from the NAR) vs. the seasonally adjusted month-to-month price change in the Case-Shiller National Index (both since January 1999 through November 2021).
There is a clear relationship, and this is no surprise (but interesting to graph). If months-of-supply is high, prices decline. If months-of-supply is very low (like now), prices rise quickly.
In November, the months-of-supply was at 2.1 months, and the Case-Shiller National Index (SA) increased 1.14% month-over-month. The black arrow points to the November 2021 dot. In the December existing home sales report, the NAR reported months-of-supply decreased to a record low 1.8 months in December.
We are seeing the expected deceleration in house price growth, and this trend will probably continue for at least a few more months. My sense is the Case-Shiller National annual growth rate of 19.99% in August was probably the peak YoY growth rate, however, since the normal level of inventory is probably in the 4 to 6 months range - we’d have to see a significant increase in inventory to sharply slow price increases, and that is why I’m focused on inventory!emphasis added

There is much more in the article. You can subscribe at https://calculatedrisk.substack.com/
Case-Shiller: National House Price Index increased 18.8% year-over-year in November
by Calculated Risk on 1/25/2022 09:15:00 AM
S&P/Case-Shiller released the monthly Home Price Indices for November ("November" is a 3-month average of September, October and November prices).
This release includes prices for 20 individual cities, two composite indices (for 10 cities and 20 cities) and the monthly National index.
From S&P: S&P Corelogic Case-Shiller Index Reports 18.8% Annual Home Price Gain in November
The S&P CoreLogic Case-Shiller U.S. National Home Price NSA Index, covering all nine U.S. census divisions, reported an 18.8% annual gain in November, down from 19.0% in the previous month. The 10-City Composite annual increase came in at 16.8%, down from 17.2% in the previous month. The 20- City Composite posted an 18.3% year-over-year gain, down from 18.5% in the previous month.
Phoenix, Tampa, and Miami reported the highest year-over-year gains among the 20 cities in November. Phoenix led the way with a 32.2% year-over-year price increase, followed by Tampa with a 29.0% increase and Miami with a 26.6% increase. Eleven of the 20 cities reported higher price increases in the year ending November 2021 versus the year ending October 2021.
...
Before seasonal adjustment, the U.S. National Index posted a 0.9% month-over-month increase in November, while the 10-City and 20-City Composites posted increases of 0.9% and 1.0%, respectively.
After seasonal adjustment, the U.S. National Index posted a month-over-month increase of 1.1%, and the 10-City and 20-City Composites posted increases of 1.1% and 1.2%, respectively.
In November, 19 of the 20 cities reported increases before seasonal adjustments while all 20 cities reported increases after seasonal adjustments.
“For the past several months, home prices have been rising at a very high, but decelerating, rate. That trend continued in November 2021,” says Craig J. Lazzara, Managing Director at S&P DJI. “The National Composite Index rose 18.8% from year-ago levels, and the 10- and 20-City Composites gained 16.8% and 18.3%, respectively. In all three cases, November’s gains were less than October’s. Despite this deceleration, it’s important to remember that November’s 18.8% gain was the sixth-highest reading in the 34 years covered by our data (the top five were the months immediately preceding November).
emphasis added
 Click on graph for larger image.
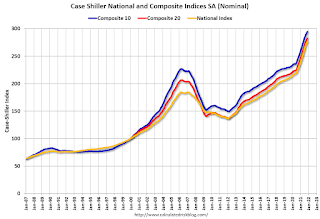
 The first graph shows the nominal seasonally adjusted Composite 10, Composite 20 and National indices (the Composite 20 was started in January 2000).
The Composite 10 index is up 1.1% in November (SA).
The Composite 20 index is up 1.2% (SA) in November.
The National index is 50% above the bubble peak (SA), and up 1.1% (SA) in November. The National index is up 102% from the post-bubble low set in February 2012 (SA).
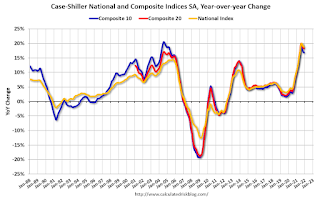 The second graph shows the year-over-year change in all three indices.
The Composite 10 SA is up 16.8% year-over-year. The Composite 20 SA is up 18.3% year-over-year.
The National index SA is up 18.8% year-over-year.
Price increases were close to expectations. I'll have more later.
Monday, January 24, 2022
Tuesday: Case-Shiller House Prices
by Calculated Risk on 1/24/2022 07:41:00 PM
Tuesday:
• At 9:00 AM ET, FHFA House Price Index for November. This was originally a GSE only repeat sales, however there is also an expanded index.
• Also, at 9:00 AM, S&P/Case-Shiller House Price Index for November. The consensus is for a 18.0% year-over-year increase in the Comp 20 index.
• At 10:00 AM, Richmond Fed Survey of Manufacturing Activity for January.
• Also, at 10:00 AM, State Employment and Unemployment (Monthly) for December 2021
On COVID (focus on hospitalizations and deaths):
| COVID Metrics | ||||
|---|---|---|---|---|
| Today | Week Ago | Goal | ||
| Percent fully Vaccinated | 63.4% | --- | ≥70.0%1 | |
| Fully Vaccinated (millions) | 210.5 | --- | ≥2321 | |
| New Cases per Day3 | 663,908 | 788,527 | ≤5,0002 | |
| Hospitalized3 | 136,135 | 141,565 | ≤3,0002 | |
| Deaths per Day3🚩 | 1,936 | 1,886 | ≤502 | |
| 1 Minimum to achieve "herd immunity" (estimated between 70% and 85%). 2my goals to stop daily posts, 37-day average for Cases, Currently Hospitalized, and Deaths 🚩 Increasing 7-day average week-over-week for Cases, Hospitalized, and Deaths ✅ Goal met. | ||||
 Click on graph for larger image.
This graph shows the daily (columns) and 7-day average (line) of positive tests reported.
New cases are now declining.
Unfortunately, deaths are still rising, but well below the previous 7-day average record of 3,421 in January 2021.


