 RSS Feed
 by Calculated Risk on 1/28/2022 09:01:00 PM
Friday, January 28, 2022
COVID Update: January 28, 2022: Falling Cases and Hospitalizations; 2,300 Deaths per Day
On COVID (focus on hospitalizations and deaths):
| COVID Metrics | ||||
|---|---|---|---|---|
| Now | Week Ago | Goal | ||
| Percent fully Vaccinated | 63.7% | --- | ≥70.0%1 | |
| Fully Vaccinated (millions) | 211.3 | --- | ≥2321 | |
| New Cases per Day3 | 577,748 | 726,986 | ≤5,0002 | |
| Hospitalized3 | 139,164 | 146,333 | ≤3,0002 | |
| Deaths per Day3🚩 | 2,300 | 1,910 | ≤502 | |
| 1 Minimum to achieve "herd immunity" (estimated between 70% and 85%). 2my goals to stop daily posts, 37-day average for Cases, Currently Hospitalized, and Deaths 🚩 Increasing 7-day average week-over-week for Cases, Hospitalized, and Deaths ✅ Goal met. | ||||
 Click on graph for larger image.
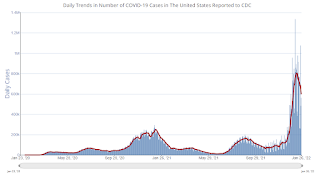
This graph shows the daily (columns) and 7-day average (line) of positive tests reported.
New cases and hospitalizations are now declining.
Unfortunately, deaths are still rising - now averaging over 2 thousand deaths per day - but below the previous 7-day average record of 3,421 in January 2021.
Hotels: Occupancy Rate Down 16% Compared to Same Week in 2019
by Calculated Risk on 1/28/2022 01:52:00 PM
U.S. hotel performance remained relatively flat from the previous week, according to STR‘s latest data through Jan. 22.The following graph shows the seasonal pattern for the hotel occupancy rate using the four-week average.
Jan. 16-22, 2022 (percentage change from comparable week in 2019*):
• Occupancy: 48.7% (-15.9%)
• Average daily rate (ADR): $122.17 (-1.4%)
• Revenue per available room (RevPAR): $59.52 (-17.1%)
*Due to the pandemic impact, STR is measuring recovery against comparable time periods from 2019.
emphasis added
 Click on graph for larger image.
The red line is for 2022, black is 2020, blue is the median, and dashed light blue is for 2021.
The 4-week average of the occupancy rate is below the median rate for the previous 20 years (Blue).
Note: Y-axis doesn't start at zero to better show the seasonal change.
The 4-week average of the occupancy rate will increase seasonally over the next few months.
NMHC: January Apartment Market Survey shows "Strong Demand, Record-High Occupancy, Double Digit Rent Growth"
by Calculated Risk on 1/28/2022 11:01:00 AM
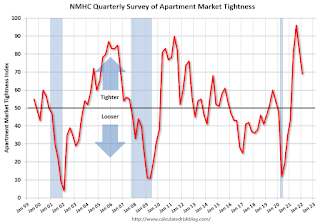
From the National Multifamily Housing Council (NMHC): January Apartment Market Conditions Show Improvement
Apartment market conditions generally improved according to the National Multifamily Housing Council’s Quarterly Survey of Apartment Market Conditions for January 2022. The Market Tightness (69), Sales Volume (59), and Equity Financing (67) indexes all came in above the breakeven level (50) for the fourth quarter in a row, though many respondents indicated conditions remained unchanged across the indexes. The Debt Financing (36) index indicated weaker conditions for the second consecutive quarter.
“We are continuing to witness strong demand for apartments across the entire U.S., but most notably in the Sun Belt, where most markets have seen double-digit rent growth that has more than made up for the pandemic slowdown,” noted NMHC’s Chief Economist, Mark Obrinsky. “And even as construction continues to rebound from the lows of 2020, absorptions have more than kept pace, such that apartment occupancy remains at record-highs.”
Click on graph for larger image.
This graph shows the quarterly Apartment Tightness Index. Any reading above 50 indicates tighter conditions from the previous quarter.
Even though the index declined in January, this indicates market conditions tightened further in January for the fourth consecutive quarter, after being especially weak during the early months of the pandemic.
LA Area Port Traffic: Disappointing Traffic in December
by Calculated Risk on 1/28/2022 10:16:00 AM
Notes: The expansion to the Panama Canal was completed in 2016 (As I noted a few years ago), and some of the traffic that used the ports of Los Angeles and Long Beach is probably going through the canal. This might be impacting TEUs on the West Coast.
Also, incoming port traffic is backed up significantly in the LA area with numerous ships at anchor waiting to unload.
Container traffic gives us an idea about the volume of goods being exported and imported - and usually some hints about the trade report since LA area ports handle about 40% of the nation's container port traffic.
The following graphs are for inbound and outbound traffic at the ports of Los Angeles and Long Beach in TEUs (TEUs: 20-foot equivalent units or 20-foot-long cargo container).
To remove the strong seasonal component for inbound traffic, the first graph shows the rolling 12-month average.
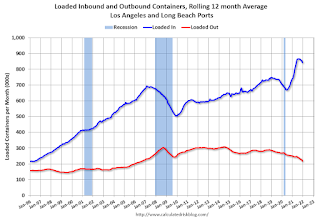
On a rolling 12-month basis, inbound traffic was down 1.2% in December compared to the rolling 12 months ending in November. Outbound traffic was down 2.5% compared to the rolling 12 months ending the previous month.
The 2nd graph is the monthly data (with a strong seasonal pattern for imports).

2021 started off incredibly strong for imports - and with the backlog of ships, traffic should remain strong. So, it is disappointing that traffic dipped in December compared to the previous months since there are quite a few ships still waiting to unload.
Imports were down 14% YoY in December, and exports were down 27% YoY.
Personal Income increased 0.3% in December; Spending decreased 0.6%
by Calculated Risk on 1/28/2022 08:37:00 AM
The BEA released the Personal Income and Outlays report for December:
Personal income increased $70.7 billion (0.3 percent) in December according to estimates released today by the Bureau of Economic Analysis. Disposable personal income (DPI) increased $39.9 billion (0.2 percent) and personal consumption expenditures (PCE) decreased $95.2 billion (0.6 percent).The December PCE price index increased 5.8 percent year-over-year and the PCE price index, excluding food and energy, increased 4.9 percent year-over-year.
Real DPI decreased 0.2 percent in December and Real PCE decreased 1.0 percent; goods decreased 3.1 percent and services increased 0.1 percent. The PCE price index increased 0.4 percent. Excluding food and energy, the PCE price index increased 0.5 percent
emphasis added
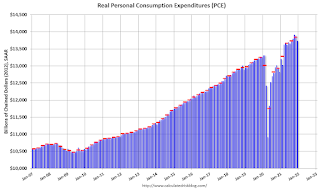
The following graph shows real Personal Consumption Expenditures (PCE) through December 2021 (2012 dollars). Note that the y-axis doesn't start at zero to better show the change.
 Click on graph for larger image.
The dashed red lines are the quarterly levels for real PCE.
Personal income was slightly below expectations, and the decrease in PCE was also slightly below expectations.
Thursday, January 27, 2022
Friday: Personal Income and Outlays
by Calculated Risk on 1/27/2022 08:25:00 PM
Friday:
• At 8:30 AM ET, Personal Income and Outlays for December. The consensus is for a 0.5% increase in personal income, and for a 0.5% decrease in personal spending. And for the Core PCE price index to increase 0.5%.
• At 10:00 AM, University of Michigan's Consumer sentiment index (Final for January). The consensus is for a reading of 68.6.
On COVID (focus on hospitalizations and deaths):
| COVID Metrics | ||||
|---|---|---|---|---|
| Now | Week Ago | Goal | ||
| Percent fully Vaccinated | 63.6% | --- | ≥70.0%1 | |
| Fully Vaccinated (millions) | 211.2 | --- | ≥2321 | |
| New Cases per Day3 | 596,859 | 744,805 | ≤5,0002 | |
| Hospitalized3 | 139,974 | 145,650 | ≤3,0002 | |
| Deaths per Day3🚩 | 2,288 | 1,829 | ≤502 | |
| 1 Minimum to achieve "herd immunity" (estimated between 70% and 85%). 2my goals to stop daily posts, 37-day average for Cases, Currently Hospitalized, and Deaths 🚩 Increasing 7-day average week-over-week for Cases, Hospitalized, and Deaths ✅ Goal met. | ||||
 Click on graph for larger image.
This graph shows the daily (columns) and 7-day average (line) of positive tests reported.
New cases and hospitalizations are now declining.
Unfortunately, deaths are still rising - now averaging over 2 thousand deaths per day - but below the previous 7-day average record of 3,421 in January 2021.
A Few Comments on Q4 GDP and Investment
by Calculated Risk on 1/27/2022 02:53:00 PM
Earlier from the BEA: Gross Domestic Product, Fourth Quarter and Year 2021 (Advance Estimate)
Real gross domestic product (GDP) increased at an annual rate of 6.9 percent in the fourth quarter of 2021, according to the "advance" estimate released by the Bureau of Economic Analysis. In the third quarter, real GDP increased 2.3 percent....On a Q4-over-Q4 basis, GDP was up 5.5%. An annual basis, GDP was up 5.7% in 2021 from 2020.
The increase in real GDP primarily reflected increases in private inventory investment, exports, personal consumption expenditures (PCE), and nonresidential fixed investment that were partly offset by decreases in both federal and state and local government spending. Imports, which are a subtraction in the calculation of GDP, increased.
emphasis added
The advance Q4 GDP report, at 6.9% annualized, was above expectations, primarily due to a strong increase in inventories.
Personal consumption expenditures (PCE) increased at a 3.3% annualized rate in Q4.
The graph below shows the contribution to GDP from residential investment, equipment and software, and nonresidential structures (3 quarter trailing average). This is important to follow because residential investment tends to lead the economy, equipment and software is generally coincident, and nonresidential structure investment trails the economy.
In the graph, red is residential, green is equipment and software, and blue is investment in non-residential structures. So, the usual pattern - both into and out of recessions is - red, green, blue.
Of course - with the sudden economic stop due to COVID-19 - the usual pattern didn't apply.
The dashed gray line is the contribution from the change in private inventories.
 Click on graph for larger image.
Residential investment (RI) decreased at a 0.8% annual rate in Q4. Equipment investment increased at a 0.8% annual rate, and investment in non-residential structures decreased at a 11.4% annual rate.
The contribution to Q4 GDP from investment in private inventories was 4.90 percentage points.
On a 3-quarter trailing average basis, RI (red) is down, equipment (green) is up, and nonresidential structures (blue) is still down.
On a 3-quarter trailing average basis, RI (red) is down, equipment (green) is up, and nonresidential structures (blue) is still down.
I'll post more on the components of non-residential investment once the supplemental data is released.
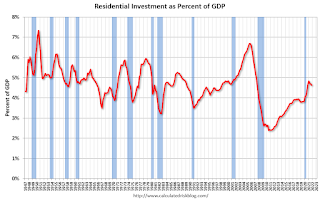 The second graph shows residential investment as a percent of GDP.
Residential Investment as a percent of GDP decreased in Q4.
I'll break down Residential Investment into components after the GDP details are released.
Note: Residential investment (RI) includes new single-family structures, multifamily structures, home improvement, broker's commissions, and a few minor categories.
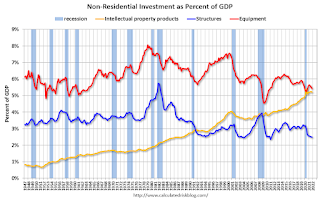 The third graph shows non-residential investment in
structures, equipment and "intellectual property products".
The third graph shows non-residential investment in
structures, equipment and "intellectual property products".
The second graph shows residential investment as a percent of GDP.Residential Investment as a percent of GDP decreased in Q4.
I'll break down Residential Investment into components after the GDP details are released.
Note: Residential investment (RI) includes new single-family structures, multifamily structures, home improvement, broker's commissions, and a few minor categories.
The third graph shows non-residential investment in
structures, equipment and "intellectual property products".
Investment in non-residential structures declined in Q4 as a percent GDP but might pick up in 2022.
Real House Prices, Price-to-Rent Ratio and Price-to-Median Income in November
by Calculated Risk on 1/27/2022 12:00:00 PM
Today, in the Calculated Risk Real Estate Newsletter: Real House Prices, Price-to-Rent Ratio and Price-to-Median Income in November
Excerpt:
I’ve put together my own affordability index - since 1976 - that is similar to the FirstAm approach (more of a house price index adjusted by mortgage rates and the median household income).
I used median income from the Census Bureau (estimated 2021), assumed a 15% down payment, and used a 2% estimate for property taxes, insurance and maintenance. This is probably low for high property tax states like New Jersey and Texas, and too high for lower property tax states. If we were including condos, we’d also include HOA fees too (this is excluded).
For house prices, I used the Case-Shiller National Index, Seasonally Adjusted (SA). Also, for the down payment - there wasn’t a significant difference between 15% and 20%. For mortgage rates, I used the Freddie Mac PMMS (30-year fixed rates).
So here is what the index looks like (lower is more affordable like the FirstAm index)
...
In general, this would suggest houses are somewhat affordable right now (due to low mortgage rates). But this says nothing about if “now is a good time to buy” (see the bottom of my post Housing: A Look at "Affordability" Indexes).
Also, in November, the average 30-year mortgage rates were around 3.071%, and currently mortgage rates are close to 3.74% - so we already know the “Affordability Price Index” will increase over the next couple of months (meaning houses are less affordable).
emphasis added

NAR: Pending Home Sales Decreased 3.8% in December
by Calculated Risk on 1/27/2022 10:03:00 AM
From the NAR: Pending Home Sales Slide 3.8% in December
Pending home sales fell in December, denoting two straight months of declines, according to the National Association of Realtors®. All four major U.S. regions posted both month-over-month and year-over-year drops in contract activity.This was well below expectations of a 0.3% increase for this index. Note: Contract signings usually lead sales by about 45 to 60 days, so this would usually be for closed sales in January and February.
The Pending Home Sales Index (PHSI), a forward-looking indicator of home sales based on contract signings, fell 3.8% to 117.7 in December. Year-over-year, transactions decreased 6.9%. An index of 100 is equal to the level of contract activity in 2001.
...
Month-over-month, the Northeast PHSI fell 1.2% to 98.2 in December, a 10.5% decline from a year ago. In the Midwest, the index dropped 3.7% to 112.8 last month, down 1.2% from December 2020.
Pending home sales transactions in the South slid 1.8% to an index of 145.2 in December, down 3.9% from December 2020. The index in the West decreased 10.0% in December to 95.0, down 16.2% from a year prior.
emphasis added
BEA: Real GDP increased at 6.9% Annualized Rate in Q4
by Calculated Risk on 1/27/2022 08:36:00 AM
From the BEA: Gross Domestic Product, Fourth Quarter and Year 2021 (Advance Estimate)
Real gross domestic product (GDP) increased at an annual rate of 6.9 percent in the fourth quarter of 2021, according to the "advance" estimate released by the Bureau of Economic Analysis. In the third quarter, real GDP increased 2.3 percent....The advance Q4 GDP report, with 6.9% annualized growth, was above expectations.
The increase in real GDP primarily reflected increases in private inventory investment, exports, personal consumption expenditures (PCE), and nonresidential fixed investment that were partly offset by decreases in both federal and state and local government spending. Imports, which are a subtraction in the calculation of GDP, increased.
emphasis added
I'll have more later ...


