 RSS Feed
 by Calculated Risk on 2/02/2022 10:14:00 AM
Wednesday, February 02, 2022
HVS: Q4 2021 Homeownership and Vacancy Rates
The Census Bureau released the Residential Vacancies and Homeownership report for Q4 2021.
The results of this survey were significantly distorted by the pandemic in 2020.
This report is frequently mentioned by analysts and the media to track household formation, the homeownership rate, and the homeowner and rental vacancy rates. However, there are serious questions about the accuracy of this survey.
This survey might show the trend, but I wouldn't rely on the absolute numbers. Analysts probably shouldn't use the HVS to estimate the excess vacant supply or household formation, or rely on the homeownership rate, except as a guide to the trend.
National vacancy rates in the fourth quarter 2021 were 5.6 percent for rental housing and 0.9 percent for homeowner housing. The rental vacancy rate was 0.9 percentage points lower than the rate in the fourth quarter 2020 (6.5 percent) and not statistically different from the rate in the third quarter 2021 (5.8 percent).
The homeowner vacancy rate of 0.9 percent was 0.1 percentage points lower than the rate in the fourth quarter 2020 (1.0 percent) and virtually the same as the rate in the third quarter 2021 (0.9 percent).
The homeownership rate of 65.5 percent was not statistically different from the rate in the fourth quarter 2020 (65.8 percent) and not statistically different from the rate in the third quarter 2021 (65.4 percent). "
emphasis added
 Click on graph for larger image.
The Red dots are the decennial Census homeownership rates for April 1st, 1990, 2000 and 2010. The Census Bureau will release data for 2020 soon.
The HVS homeownership rate increased to 65.5% in Q3, from 65.4% in Q3.
The results starting in Q2 2020 were distorted by the pandemic.
 The HVS homeowner vacancy was unchanged at 0.9% in Q4.
 Once again - this probably shows the general trend, but I wouldn't rely on the absolute numbers.
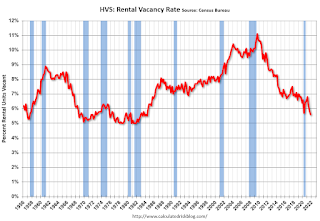 The rental vacancy rate decreased to 5.6% in Q4 from 5.8% in Q3. This fits with other data suggesting strong rental demand in Q4.
The quarterly HVS is the timeliest survey on households, but there are many questions about the accuracy of this survey.
ADP: Private Employment Decreased 301,000 in January
by Calculated Risk on 2/02/2022 08:19:00 AM
Private sector employment decreased by 301,000 jobs from December to January according to the January ADP® National Employment ReportTM. Broadly distributed to the public each month, free of charge, the ADP National Employment Report is produced by the ADP Research Institute® in collaboration with Moody’s Analytics. The report, which is derived from ADP’s actual data of those who are on a company’s payroll, measures the change in total nonfarm private employment each month on a seasonally-adjusted basisThis was well below the consensus forecast of 208,000 for this report.
“The labor market recovery took a step back at the start of 2022 due to the effect of the Omicron variant and its significant, though likely temporary, impact to job growth,” said Nela Richardson, chief economist, ADP. “The majority of industry sectors experienced job loss, marking the most recent decline since December 2020. Leisure and hospitality saw the largest setback after substantial gains in fourth quarter 2021, while small businesses were hit hardest by losses, erasing most of the job gains made in December 2021.”
emphasis added
The BLS report will be released Friday, and the consensus is for 155 thousand non-farm payroll jobs added in January. The ADP report has not been very useful in predicting the BLS report, but this suggests weakness in the January BLS report.
MBA: Mortgage Applications Increase in Latest Weekly Survey
by Calculated Risk on 2/02/2022 07:00:00 AM
From the MBA: Mortgage Applications Increase in Latest MBA Weekly Survey
Mortgage applications increased 12.0 percent from one week earlier, according to data from the Mortgage Bankers Association’s (MBA) Weekly Mortgage Applications Survey for the week ending January 28, 2022.
... The Refinance Index increased 18 percent from the previous week and was 50 percent lower than the same week one year ago. The seasonally adjusted Purchase Index increased 4 percent from one week earlier. The unadjusted Purchase Index increased 12 percent compared with the previous week and was 7 percent lower than the same week one year ago.
“Most mortgage rates in MBA’s survey continued to rise, with the 30-year fixed rate reaching its highest level since March 2020 at 3.78 percent. Despite the increase in rates, refinance applications were up 18 percent, driven mainly by a 22 percent jump in conventional applications. There has likely been some recent volatility in application counts due to holiday-impacted weeks, as well as from borrowers trying to secure a refinance before rates go even higher,” said Joel Kan, MBA’s Associate Vice President of Economic and Industry Forecasting. “Purchase applications also increased in the final full week of January but remained 7 percent lower than a year ago. The average purchase loan size hit a new survey high once again at $441,100. Stubbornly low inventory levels and swift home-price growth continue to push average loan sizes higher.”
...
The average contract interest rate for 30-year fixed-rate mortgages with conforming loan balances ($647,200 or less) increased to 3.78 percent from 3.72 percent, with points decreasing to 0.41 from 0.43 (including the origination fee) for 80 percent loan-to-value ratio (LTV) loans.
emphasis added
 Click on graph for larger image.
The first graph shows the refinance index since 1990.
With higher mortgage rates, the refinance index has declined sharply over the last several months.
The second graph shows the MBA mortgage purchase index
 According to the MBA, purchase activity is down 7% year-over-year unadjusted.
Note: Red is a four-week average (blue is weekly).
Tuesday, February 01, 2022
Wednesday: ADP Employment, Q4 Housing Vacancies and Homeownership
by Calculated Risk on 2/01/2022 08:47:00 PM
Wednesday:
• At 7:00 AM ET, The Mortgage Bankers Association (MBA) will release the results for the mortgage purchase applications index.
• At 8:15 AM, The ADP Employment Report for January. This report is for private payrolls only (no government). The consensus is for 208,000 payroll jobs added in January, down from 807,000 added in December.
• At 10:00 AM, the Q4 2021 Housing Vacancies and Homeownership from the Census Bureau.
On COVID (focus on hospitalizations and deaths):
| COVID Metrics | ||||
|---|---|---|---|---|
| Now | Week Ago | Goal | ||
| Percent fully Vaccinated | 63.8% | --- | ≥70.0%1 | |
| Fully Vaccinated (millions) | 212.0 | --- | ≥2321 | |
| New Cases per Day3 | 446,355 | 696,832 | ≤5,0002 | |
| Hospitalized3 | 129,637 | 144,898 | ≤3,0002 | |
| Deaths per Day3🚩 | 2,287 | 2,197 | ≤502 | |
| 1 Minimum to achieve "herd immunity" (estimated between 70% and 85%). 2my goals to stop daily posts, 37-day average for Cases, Currently Hospitalized, and Deaths 🚩 Increasing 7-day average week-over-week for Cases, Hospitalized, and Deaths ✅ Goal met. | ||||
 Click on graph for larger image.
This graph shows the daily (columns) and 7-day average (line) of positive tests reported.
New cases and hospitalizations are now declining.
Unfortunately, deaths are still rising, but well below the previous 7-day average record of 3,421 in January 2021.
January Vehicles Sales increased to 15.04 million SAAR
by Calculated Risk on 2/01/2022 05:52:00 PM
Wards Auto released their estimate of light vehicle sales for January. Wards Auto estimates sales of 15.04 million SAAR in January 2022 (Seasonally Adjusted Annual Rate), up 20.9% from the December sales rate, but down 10.4% from January 2021.
 Click on graph for larger image.
This graph shows light vehicle sales since 2006 from the BEA (blue) and Wards Auto's estimate for January (red).
The impact of COVID-19 was significant, and April 2020 was the worst month.
After April 2020, sales increased, and were close to sales in 2019 (the year before the pandemic).
However, sales decreased earlier this year due to supply issues. It appears the "supply chain bottom" was in September, and sales in January were well above the consensus forecast of 12.6 million SAAR.
Las Vegas Visitor Authority for December: Visitor Traffic Down 13.3% Compared to 2019
by Calculated Risk on 2/01/2022 04:05:00 PM
From the Las Vegas Visitor Authority: December 2021 Las Vegas Visitor Statistics
Las Vegas visitation saw positive gains through much of 2021, ending the year with 32.2M visitors, about three‐quarters of pre‐COVID volume but well ahead of the 19M visitors hosted in 2020.
Amidst the challenges of COVID, active and evolving safety and health protocols across the destination allowed Las Vegas conventions and meetings to continue in 2021 with an estimated attendance of 2.2 million for the year, roughly a third of pre‐COVID levels.
Overall hotel occupancy approached 67% for the year, dramatically ahead of 2020's 42.1% tally but below the 88.9% level of 2019. In part due to the challenged convention group segment, Midweek saw annual occupancy reach 60.5%, +23.1 pts vs. 2020 but ‐25.8 pts vs. 2019. Compared to midweek activity, weekends saw a stronger recovery, exceeding 87% in seven out of twelve months and ending the year at 81.3% (+28.5 pts vs. 2020 and ‐13.6 pts vs. 2019).
 Click on graph for larger image.
 This graph shows visitor traffic for 2019 (blue), 2020 (orange) and 2021 (red).
Visitor traffic was down 13.3% compared to the same month in 2019.
There was no convention traffic from March 2020 until June 2021 (In December, convention traffic was down 64% compared to 2019).
Rents Still Increasing Sharply Year-over-year
by Calculated Risk on 2/01/2022 01:10:00 PM
Today, in the Calculated Risk Real Estate Newsletter: Rents Still Increasing Sharply Year-over-year
A brief excerpt:
Here is a graph of the year-over-year (YoY) change for these measures since January 2015. All of these measures are through December 2021 (Apartment List through January 2022).There is much more in the article. You can subscribe at https://calculatedrisk.substack.com/
...
The Zillow measure is up 13.9% YoY in December, up from 13.2% YoY in November. And the ApartmentList measure is up 17.8% as of December, down slightly from 17.9% in November.
Clearly rents are still increasing, and we should expect this to continue to spill over into measures of inflation in 2022. The Owners’ Equivalent Rent (OER) was up 3.8% YoY in December, from 3.5% YoY in November - and will likely increase further in the coming months.
Construction Spending Increased 0.2% in December
by Calculated Risk on 2/01/2022 12:19:00 PM
From the Census Bureau reported that overall construction spending increased 0.2%:
Construction spending during December 2021 was estimated at a seasonally adjusted annual rate of $1,639.9 billion, 0.2 percent above the revised November estimate of $1,636.5 billion. The December figure is 9.0 percent above the December 2020 estimate of $1,504.2 billion.Private spending increased and public spending decreased:
The value of construction in 2021 was $1,589.0 billion, 8.2 percent above the $1,469.2 billion spent in 2020.
emphasis added
Spending on private construction was at a seasonally adjusted annual rate of $1,292.9 billion, 0.7 percent above the revised November estimate of $1,283.8 billion. ...
In December, the estimated seasonally adjusted annual rate of public construction spending was $347.0 billion, 1.6 percent below the revised November estimate of $352.7 billion.
 Click on graph for larger image.
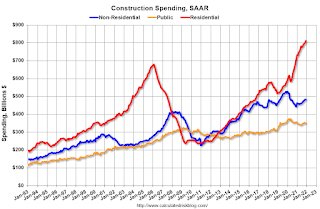
This graph shows private residential and nonresidential construction spending, and public spending, since 1993. Note: nominal dollars, not inflation adjusted.
Residential spending is 19% above the bubble peak (in nominal terms - not adjusted for inflation).
Non-residential spending is 16% above the bubble era peak in January 2008 (nominal dollars) but has been soft recently.
Public construction spending is 7% above the peak in March 2009.
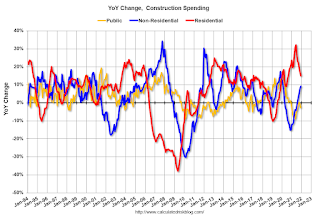 The second graph shows the year-over-year change in construction spending.
On a year-over-year basis, private residential construction spending is up 15.0%. Non-residential spending is up 9.1% year-over-year. Public spending is down 2.9% year-over-year.
Construction was considered an essential service during the early months of the pandemic in most areas and did not decline sharply like many other sectors. However, some sectors of non-residential have been under pressure. For example, lodging is down 23% YoY.
This was below consensus expectations of a 0.6% increase in spending; however, construction spending for the previous two months was revised up.
ISM® Manufacturing index Decreased to 57.6% in January
by Calculated Risk on 2/01/2022 10:09:00 AM
(Posted with permission). The ISM manufacturing index indicated expansion in December. The PMI® was at 57.3% in January, down from 58.8% in December. The employment index was at 54.5%, up from 53.9% last month, and the new orders index was at 57.9%, down from 61.0%.
From ISM: Manufacturing PMI® at 57.6% January 2022 Manufacturing ISM® Report On Business®
Economic activity in the manufacturing sector grew in January, with the overall economy achieving a 20th consecutive month of growth, say the nation's supply executives in the latest Manufacturing ISM® Report On Business®.This suggests manufacturing expanded at a slightly slower pace in January than in December.
The report was issued today by Timothy R. Fiore, CPSM, C.P.M., Chair of the Institute for Supply Management® (ISM®) Manufacturing Business Survey Committee:
“The January Manufacturing PMI® registered 57.6 percent, a decrease of 1.2 percentage points from the seasonally adjusted December reading of 58.8 percent. This figure indicates expansion in the overall economy for the 20th month in a row after a contraction in April and May 2020. The New Orders Index registered 57.9 percent, down 3.1 percentage points compared to the seasonally adjusted December reading of 61 percent. The Production Index registered 57.8 percent, a decrease of 1.6 percentage points compared to the seasonally adjusted December reading of 59.4 percent. The Prices Index registered 76.1 percent, up 7.9 percentage points compared to the December figure of 68.2 percent. The Backlog of Orders Index registered 56.4 percent, 6.4 percentage points lower than the December reading of 62.8 percent. The Employment Index registered 54.5 percent, 0.6 percentage point higher compared to the seasonally adjusted December reading of 53.9 percent. The Supplier Deliveries Index registered 64.6 percent, down 0.3 percentage point from the December figure of 64.9 percent. The Inventories Index registered 53.2 percent, 1.4 percentage points lower than the seasonally adjusted December reading of 54.6 percent. The New Export Orders Index registered 53.7 percent, up 0.1 percentage point compared to the December reading of 53.6 percent. The Imports Index registered 55.1 percent, a 1.3-percentage point increase from the December reading of 53.8 percent.”
emphasis added
BLS: Job Openings "little changed" at 10.9 million in December
by Calculated Risk on 2/01/2022 10:04:00 AM
From the BLS: Job Openings and Labor Turnover Summary
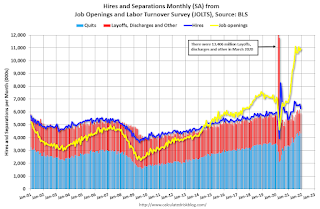
The number of job openings was little changed at 10.9 million on the last business day of December, the U.S. Bureau of Labor Statistics reported today. Hires and total separations decreased to 6.3 million and 5.9 million, respectively. Within separations, the quits rate was little changed at 2.9 percent. The layoffs and discharges rate was little changed at 0.8 percent, a series low.The following graph shows job openings (yellow line), hires (dark blue), Layoff, Discharges and other (red column), and Quits (light blue column) from the JOLTS.
emphasis added
This series started in December 2000.
Note: The difference between JOLTS hires and separations is similar to the CES (payroll survey) net jobs headline numbers. This report is for December, the employment report on Friday will be for January.
 Click on graph for larger image.
Note that hires (dark blue) and total separations (red and light blue columns stacked) are usually pretty close each month. This is a measure of labor market turnover. When the blue line is above the two stacked columns, the economy is adding net jobs - when it is below the columns, the economy is losing jobs.
The huge spike in layoffs and discharges in March 2020 are labeled, but off the chart to better show the usual data.
Jobs openings increased in December to 10.9 million from 10.8 million in November.
The number of job openings (yellow) were up 62% year-over-year.
Quits were up 27% year-over-year. These are voluntary separations. (See light blue columns at bottom of graph for trend for "quits").


