 RSS Feed
 by Calculated Risk on 2/04/2022 08:47:00 AM
Friday, February 04, 2022
January Employment Report: 467 thousand Jobs, 4.0% Unemployment Rate
From the BLS:
Total nonfarm payroll employment rose by 467,000 in January, and the unemployment rate was little changed at 4.0 percent, the U.S. Bureau of Labor Statistics reported today. Employment growth continued in leisure and hospitality, in professional and business services, in retail trade, and in transportation and warehousing.
emphasis added
 Click on graph for larger image.
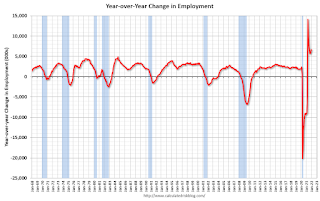
The first graph shows the year-over-year change in total non-farm employment since 1968.
In January, the year-over-year change was 6.61 million jobs. This was up significantly year-over-year.
Total payrolls increased by 467 thousand in January. Private payrolls increased by 444 thousand, and public payrolls increased 23 thousand.
Payrolls for November and December were revised up 709 thousand, combined.
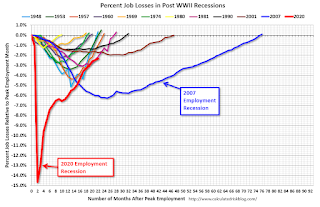
 The second graph shows the job losses from the start of the employment recession, in percentage terms.
The current employment recession was by far the worst recession since WWII in percentage terms. However, the current employment recession, 23 months after the onset, is now significantly better than the worst of the "Great Recession".
The third graph shows the employment population ratio and the participation rate.
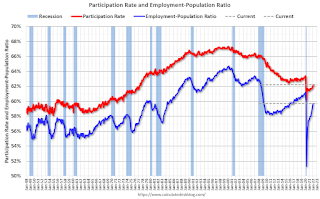 The Labor Force Participation Rate increased to 62.2% in January, from 61.9% in December. This is the percentage of the working age population in the labor force.
 The Employment-Population ratio increased to 59.7% from 59.5% (blue line).
I'll post the 25 to 54 age group employment-population ratio graph later.
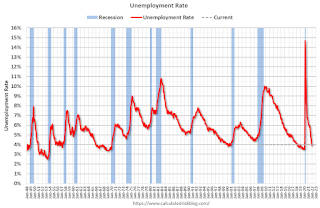 The fourth graph shows the unemployment rate.
 The unemployment rate increased in January to 4.0% from 3.9% in December.
This was well above consensus expectations; and November and December payrolls were revised up by 709,000 combined.
The total nonfarm employment level for March 2021 was revised upward by 374,000. On a not seasonally adjusted basis, total nonfarm employment for March 2021 was revised downward by 7,000, or less than -0.05 percent.
I'll have more later ...
Thursday, February 03, 2022
Friday: Employment Report
by Calculated Risk on 2/03/2022 10:37:00 PM
My January Employment Preview
Goldman January Payrolls Preview
Friday:
• At 8:30 AM ET, Employment Report for January. The consensus is for 155 thousand jobs added, and for the unemployment rate to be unchanged at 3.9%. There were 199 thousand jobs added in December, and the unemployment rate was at 3.9%.
On COVID (focus on hospitalizations and deaths):
| COVID Metrics | ||||
|---|---|---|---|---|
| Now | Week Ago | Goal | ||
| Percent fully Vaccinated | 63.9% | --- | ≥70.0%1 | |
| Fully Vaccinated (millions) | 212.1 | --- | ≥2321 | |
| New Cases per Day3 | 415,552 | 636,024 | ≤5,0002 | |
| Hospitalized3 | 124,134 | 142,482 | ≤3,0002 | |
| Deaths per Day3🚩 | 2,369 | 2,286 | ≤502 | |
| 1 Minimum to achieve "herd immunity" (estimated between 70% and 85%). 2my goals to stop daily posts, 37-day average for Cases, Currently Hospitalized, and Deaths 🚩 Increasing 7-day average week-over-week for Cases, Hospitalized, and Deaths ✅ Goal met. | ||||
 Click on graph for larger image.
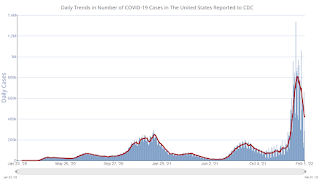
This graph shows the daily (columns) and 7-day average (line) of positive tests reported.
New cases and hospitalizations are now declining.
Unfortunately, deaths are still rising, but well below the previous 7-day average record of 3,421 in January 2021.
Goldman January Payrolls Preview
by Calculated Risk on 2/03/2022 03:57:00 PM
A few brief excerpts from a note by Goldman Sachs economist Spencer Hill:
We estimate nonfarm payrolls declined by 250k, 400k below consensus of +150k. Our forecast reflects a large and temporary drag from Omicron on the order of 500-1000k, as survey data indicate a surge in absenteeism during the month ... We estimate an unchanged unemployment rate of 3.9%—in line with consensus—reflecting likely declines in both household employment and labor force participation due to the virus wave.CR Note: The consensus is for 155 thousand jobs added, and for the unemployment rate to be unchanged at 3.9%.
emphasis added
Used Vehicle Wholesale Prices
by Calculated Risk on 2/03/2022 01:44:00 PM
Since the pandemic has disrupted new car production and sales, used car prices increased sharply. This pushed up inflation ("Used Cars" were up 51% annualized in December).
Here is some data on used vehicle wholesale prices. From Manheim Consulting today: Wholesale Prices Rise Further in First Half of January
Wholesale used vehicle prices (on a mix-, mileage-, and seasonally adjusted basis) increased 0.8% in the first 15 days of January compared to the month of December. This brought the Manheim Used Vehicle Value Index to 238.0, a 46.0% increase from January 2021. As was the case in each of the last three months, much of the reported increase was a result of the seasonal adjustment. The non-adjusted price was statistically unchanged from December.
Manheim Market Report (MMR) prices saw declines through the first two full weeks of January. The Three-Year-Old MMR Index, which represents the largest model year cohort at auction, experienced a 1.3% cumulative decline over the last two weeks.
emphasis added
 Click on graph for larger image.
This index from Manheim Consulting is based on all completed sales transactions at Manheim’s U.S. auctions.
According to the BLS, "Used cars and trucks in U.S. city average, all urban consumers, seasonally adjusted" is up 55% since the low in June 2020.
The Manheim index suggests used car prices are still increasing, but that these increases have slowed sharply.
January Employment Preview
by Calculated Risk on 2/03/2022 11:58:00 AM
On Friday at 8:30 AM ET, the BLS will release the employment report for January. The consensus is for 155 thousand jobs added, and for the unemployment rate to be unchanged at 3.9%.
 Click on graph for larger image.
• First, currently there are still about 3.6 million fewer jobs than in February 2020 (before the pandemic).
This graph shows the job losses from the start of the employment recession, in percentage terms.
The current employment recession was by far the worst recession since WWII in percentage terms. However, the current employment recession, 22 months after the onset, is now significantly better than the worst of the "Great Recession".
• ADP Report: The ADP employment report showed a loss of 301,000 private sector jobs, well below the consensus estimates of 208,000 jobs added. The ADP report hasn't been very useful in predicting the BLS report, but this suggests the BLS report could be below expectations.
• ISM Surveys: Note that the ISM services are diffusion indexes based on the number of firms hiring (not the number of hires). The ISM® manufacturing employment index increased in January to 54.5%, up from 53.9% last month. This would suggest 5,000 jobs added in manufacturing employment in January. ADP showed 21,000 manufacturing jobs lost.
The ISM® Services employment index decreased in January to 52.3%, down from 54.7% last month. This would suggest a 135 thousand increase in service employment in January. Combined, the ISM indexes suggest employment slightly below the consensus estimate.
• Unemployment Claims: The weekly claims report showed a sharp increase in the number of initial unemployment claims during the reference week (includes the 12th of the month) from 206,000 in December to 290,000 in January. This would usually suggest more layoffs in January than in December, although this might not be very useful right now. In general, weekly claims were below expectations in January.
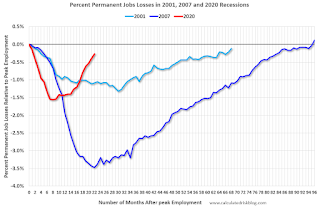 • Permanent Job Losers: Something to watch in the employment report will be "Permanent job losers". This graph shows permanent job losers as a percent of the pre-recession peak in employment through the November report.
This data is only available back to 1994, so there is only data for three recessions. In December, the number of permanent job losers decreased to 1.703 million from 1.905 million in November.
These jobs will likely be the hardest to recover, so it is a positive that the number of permanent job losers is declining fairly rapidly.
• Annual Benchmark Revision: The benchmark revision for 2021 will be released with the January employment report. The preliminary estimate was the revision will show 166,000 fewer jobs as of March 2021.
• COVID: As far as the pandemic, the number of daily cases during the reference week in January was a record 800,000, up sharply from around 120,000 in December. The current wave peaked during the January reference week, and probably had a significant impact on January hiring.
• COVID: As far as the pandemic, the number of daily cases during the reference week in January was a record 800,000, up sharply from around 120,000 in December. The current wave peaked during the January reference week, and probably had a significant impact on January hiring.
• Conclusion: There is significant pessimism concerning the January employment report due to the current COVID wave, and many analysts are expecting job losses in January. For example, from Merrill Lynch economists:
"We expect nonfarm payrolls contracted by 150k in Jan owing to the shock from the Omicron variant. The U-rate should hold at 3.9%"
Overall, the ADP report was very weak, and unemployment claims increased sharply during the reference week. My sense is the report will be below consensus expectations.
ISM® Services Index Decreased to 59.9% in January
by Calculated Risk on 2/03/2022 10:03:00 AM
(Posted with permission). The December ISM® Services index was at 59.9%, down from 62.3% last month. The employment index decreased to 52.3%, from 54.7%. Note: Above 50 indicates expansion, below 50 in contraction.
From the Institute for Supply Management: Services PMI® at 59.9% January 2022 Services ISM® Report On Business®
Economic activity in the services sector grew in January for the 20th month in a row — with the Services PMI® registering 59.9 percent — say the nation’s purchasing and supply executives in the latest Services ISM® Report On Business®.The employment index decreased to 52.3%, from 54.7% the previous month.
The report was issued today by Anthony Nieves, CPSM, C.P.M., A.P.P., CFPM, Chair of the Institute for Supply Management® (ISM®) Services Business Survey Committee: “In January, the Services PMI® registered 59.9 percent, 2.4 percentage points below December’s seasonally adjusted reading of 62.3 percent. The Business Activity Index registered 59.9 percent, a decrease of 8.4 percentage points compared to the seasonally adjusted reading of 68.3 percent in December, and the New Orders Index registered 61.7 percent, 0.4 percentage point lower than the seasonally adjusted reading of 62.1 percent reported in December.
emphasis added
Weekly Initial Unemployment Claims Decrease to 238,000
by Calculated Risk on 2/03/2022 08:34:00 AM
The DOL reported:
In the week ending January 29, the advance figure for seasonally adjusted initial claims was 238,000, a decrease of 23,000 from the previous week's revised level. The previous week's level was revised up by 1,000 from 260,000 to 261,000. The 4-week moving average was 255,000, an increase of 7,750 from the previous week's revised average. The previous week's average was revised up by 250 from 247,000 to 247,250.The following graph shows the 4-week moving average of weekly claims since 1971.
emphasis added
 Click on graph for larger image.
The dashed line on the graph is the current 4-week average. The four-week average of weekly unemployment claims increased to 255,000.
The previous week was revised up.
Weekly claims were close to the consensus forecast and increased recently likely due to the current COVID wave.
Wednesday, February 02, 2022
Thursday: Unemployment Claims, ISM Services
by Calculated Risk on 2/02/2022 08:50:00 PM
Thursday:
• At 8:30 AM ET, the initial weekly unemployment claims report will be released. The consensus is for a decrease to 250 thousand from 260 thousand last week.
• At 10:00 AM, the ISM Services Index for January.
On COVID (focus on hospitalizations and deaths):
| COVID Metrics | ||||
|---|---|---|---|---|
| Now | Week Ago | Goal | ||
| Percent fully Vaccinated | 63.8% | --- | ≥70.0%1 | |
| Fully Vaccinated (millions) | 212.0 | --- | ≥2321 | |
| New Cases per Day3 | 415,552 | 636,024 | ≤5,0002 | |
| Hospitalized3 | 127,329 | 143,924 | ≤3,0002 | |
| Deaths per Day3🚩 | 2,369 | 2,286 | ≤502 | |
| 1 Minimum to achieve "herd immunity" (estimated between 70% and 85%). 2my goals to stop daily posts, 37-day average for Cases, Currently Hospitalized, and Deaths 🚩 Increasing 7-day average week-over-week for Cases, Hospitalized, and Deaths ✅ Goal met. | ||||
Click on graph for larger image.This graph shows the daily (columns) and 7-day average (line) of positive tests reported.
New cases and hospitalizations are now declining.
Unfortunately, deaths are still rising, but well below the previous 7-day average record of 3,421 in January 2021.
Mike Simonsen of Altos Research and I Discuss Housing
by Calculated Risk on 2/02/2022 04:00:00 PM
Mike Simonsen of Altos Research and I discussed housing on “Top of the Mind”.
Here is webpage: Looking for Risks in the Future of the Real Estate Market
We discussed:
• Bill McBride shares why he started the Calculated Risk blog
• How Bill predicted the 2005 housing bubble
• What risks does Bill foresee in the future real estate market?
• Why are there fewer houses for sale, and is it a problem?
• Millennial home-buying trends
• Bill’s predictions for the second half of 2022
• Real estate trends outside of the US
• Why sellers should wait for multiple offers instead of taking the first one
• What’s the next big shift in the real estate market?
• How the remote working trend is impacting the real estate market
Update: Framing Lumber Prices Up More Than Double from Two Years Ago
by Calculated Risk on 2/02/2022 01:54:00 PM
Here is another monthly update on framing lumber prices.
This graph shows CME random length framing futures through February 2nd.
Lumber was at $979 per 1000 board feet this morning.
This is down from a peak of $1,733, but from $887 a year ago - and up more than double from $426 two years ago.
 Click on graph for larger image in graph gallery.
A combination of strong demand and various supply constraints have pushed up the price of lumber.
Click on graph for larger image in graph gallery.Lumber price are up 10% year-over-year and up 130% from two years ago.
There is somewhat of a seasonal demand for lumber, and lumber prices usually peak in April or May (although it is possible lumber prices peaked early this year).
A combination of strong demand and various supply constraints have pushed up the price of lumber.


