 RSS Feed
 by Calculated Risk on 2/07/2022 08:40:00 AM
Monday, February 07, 2022
Six High Frequency Indicators for the Economy
These indicators are mostly for travel and entertainment. It is interesting to watch these sectors recover as the pandemic subsides.
There has been a clear negative impact from the omicron variant of COVID that might be starting to ease.
Note: Gasoline consumption returned to pre-pandemic levels.
----- Airlines: Transportation Security Administration -----
The TSA is providing daily travel numbers.
This data is as of February 6th.
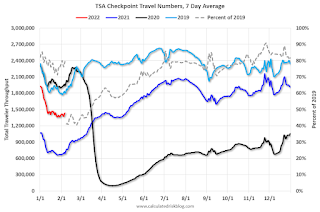 Click on graph for larger image.
This data shows the 7-day average of daily total traveler throughput from the TSA for 2019 (Light Blue), 2020 (Black), 2021 (Blue) and 2021 (Red).
The dashed line is the percent of 2019 for the seven-day average.
The 7-day average is down 20.6% from the same day in 2019 (79.4% of 2019). (Dashed line)
----- Restaurants: OpenTable -----
The second graph shows the 7-day average of the year-over-year change in diners as tabulated by OpenTable for the US and several selected cities.
----- Movie Tickets: Box Office Mojo -----
 This data shows domestic box office for each week and the median for the years 2016 through 2019 (dashed light blue).
----- Hotel Occupancy: STR -----
 This graph shows the seasonal pattern for the hotel occupancy rate using the four-week average.
The red line is for 2022, black is 2020, blue is the median, and dashed light blue is for 2021.
This data is through January 29th. The occupancy rate was down 12.2% compared to the same week in 2019.
----- Transit: Apple Mobility -----
This graph is from Apple mobility. From Apple: "This data is generated by counting the number of requests made to Apple Maps for directions in select countries/regions, sub-regions, and cities." This is just a general guide - people that regularly commute probably don't ask for directions.
 This data is through February 4th
----- New York City Subway Usage -----
Here is some interesting data on New York subway usage (HT BR).
 This graph is from Todd W Schneider.
This data is through Friday, February 4th.
He notes: "Data updates weekly from the MTA’s public turnstile data, usually on Saturday mornings".
Note: Gasoline consumption returned to pre-pandemic levels.
The TSA is providing daily travel numbers.
This data is as of February 6th.
Click on graph for larger image.This data shows the 7-day average of daily total traveler throughput from the TSA for 2019 (Light Blue), 2020 (Black), 2021 (Blue) and 2021 (Red).
The dashed line is the percent of 2019 for the seven-day average.
The 7-day average is down 20.6% from the same day in 2019 (79.4% of 2019). (Dashed line)
Air travel had been off about 20% relative to 2019 for most of the second half of 2021 (with some ups and downs) - but picked up over the Thanksgiving and Christmas holidays (solid leisure travel) - and has declined in early 2022 (omicron / weak business travel).
The second graph shows the 7-day average of the year-over-year change in diners as tabulated by OpenTable for the US and several selected cities.
IMPORTANT: OpenTable notes: "we’ve updated the data including downloadable dataset from January 1, 2021, onward to compare seated diners from 2021 to 2019, as opposed to year over year." Thanks!
 Thanks to OpenTable for providing this restaurant data:
This data is updated through February 5, 2022.
This data is "a sample of restaurants on the OpenTable network across all channels: online reservations, phone reservations, and walk-ins. For year-over-year comparisons by day, we compare to the same day of the week from the same week in the previous year."
Dining was mostly moving sideways but declined during the winter wave of COVID and is now increasing. The 7-day average for the US is down 14% compared to 2019.
Thanks to OpenTable for providing this restaurant data:This data is updated through February 5, 2022.
This data is "a sample of restaurants on the OpenTable network across all channels: online reservations, phone reservations, and walk-ins. For year-over-year comparisons by day, we compare to the same day of the week from the same week in the previous year."
Dining was mostly moving sideways but declined during the winter wave of COVID and is now increasing. The 7-day average for the US is down 14% compared to 2019.
This data shows domestic box office for each week and the median for the years 2016 through 2019 (dashed light blue). Black is 2020, Blue is 2021 and Red is 2022.
The data is from BoxOfficeMojo through February 3rd.
Note that the data is usually noisy week-to-week and depends on when blockbusters are released.
Movie ticket sales were at $46 million last week, down about 73% from the median for the week.
Note that the data is usually noisy week-to-week and depends on when blockbusters are released.
Movie ticket sales were at $46 million last week, down about 73% from the median for the week.
This graph shows the seasonal pattern for the hotel occupancy rate using the four-week average. The red line is for 2022, black is 2020, blue is the median, and dashed light blue is for 2021.
This data is through January 29th. The occupancy rate was down 12.2% compared to the same week in 2019.
The 4-week average of the occupancy rate is below the median rate for the previous 20 years (Blue).
Notes: Y-axis doesn't start at zero to better show the seasonal change.
Notes: Y-axis doesn't start at zero to better show the seasonal change.
The 4-week average of the occupancy rate will increase seasonally over the next few months. The key question is: How much business travel will return?
This graph is from Apple mobility. From Apple: "This data is generated by counting the number of requests made to Apple Maps for directions in select countries/regions, sub-regions, and cities." This is just a general guide - people that regularly commute probably don't ask for directions.
This data is through February 4th for the United States and several selected cities.
The graph is the running 7-day average to remove the impact of weekends.
IMPORTANT: All data is relative to January 13, 2020. This data is NOT Seasonally Adjusted. People walk and drive more when the weather is nice, so I'm just using the transit data.
According to the Apple data directions requests, public transit in the 7-day average for the US is at 99% of the January 2020 level.
Here is some interesting data on New York subway usage (HT BR).
This graph is from Todd W Schneider. This graph shows how much MTA traffic has recovered in each borough (Graph starts at first week in January 2020 and 100 = 2019 average).
Manhattan is at about 31% of normal.
This data is through Friday, February 4th.
He notes: "Data updates weekly from the MTA’s public turnstile data, usually on Saturday mornings".
Sunday, February 06, 2022
Sunday Night Futures
by Calculated Risk on 2/06/2022 06:14:00 PM
Weekend:
• Schedule for Week of February 6, 2022
Monday:
• No major economic releases scheduled.
From CNBC: Pre-Market Data and Bloomberg futures S&P 500 and DOW futures are mostly unchanged (fair value).
Oil prices were up over the last week with WTI futures at $92.31 per barrel and Brent at $93.27 per barrel. A year ago, WTI was at $58, and Brent was at $60 - so WTI oil prices are up about 60% year-over-year.
Here is a graph from Gasbuddy.com for nationwide gasoline prices. Nationally prices are at $3.44 per gallon. A year ago prices were at $2.45 per gallon, so gasoline prices are up $0.99 per gallon year-over-year.
Trends in Educational Attainment in the U.S. Labor Force
by Calculated Risk on 2/06/2022 12:17:00 PM
The first graph shows the unemployment rate by four levels of education (all groups are 25 years and older) through March 2021. Note: This is an update to a post from a few years ago.
Unfortunately, this data only goes back to 1992 and includes only three recessions (the stock / tech bust in 2001, and the housing bust/financial crisis, and the 2020 pandemic). Clearly education matters with regards to the unemployment rate, with the lowest rate for college graduates at 2.3% in January, and highest for those without a high school degree at 6.3% in January.
All four groups were generally trending down prior to the pandemic. And all are nearly back to pre-pandemic levels now.

Note: This says nothing about the quality of jobs - as an example, a college graduate working at minimum wage would be considered "employed".
This brings up an interesting question: What is the composition of the labor force by educational attainment, and how has that been changing over time?
Here is some data on the U.S. labor force by educational attainment since 1992.
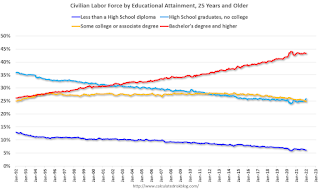
This is the only category trending up. "Some college" has been steady (and trending down lately), and both "high school" and "less than high school" have been trending down.
Based on current trends, probably half the labor force will have at least a bachelor's degree by the end of this decade (2020s).
Some thoughts: Since workers with bachelor's degrees typically have a lower unemployment rate, rising educational attainment is probably a factor in pushing down the overall unemployment rate over time.
Also, I'd guess more education would mean less labor turnover, and that education is a factor in lower weekly claims (prior to the pandemic).
A more educated labor force is a positive for the future.
Saturday, February 05, 2022
Real Estate Newsletter Articles this Week
by Calculated Risk on 2/05/2022 02:11:00 PM
At the Calculated Risk Real Estate Newsletter this week:
• "Mortgage Rates Leap Toward 4.0%, Highest Since October 2019"
• Mike Simonsen of Altos Research and I Discuss Housing
• Rents Still Increasing Sharply Year-over-year NMHC: "Apartment occupancy remains at record-highs"
• Median vs Repeat Sales Index House Prices
This is usually published several times a week, and provides more in-depth analysis of the housing market.
The blog will continue as always!
You can subscribe at https://calculatedrisk.substack.com/ Most content is available for free, but please subscribe!.
You can subscribe at https://calculatedrisk.substack.com/ Most content is available for free, but please subscribe!.
Schedule for Week of February 6, 2022
by Calculated Risk on 2/05/2022 08:11:00 AM
The key reports this week are January CPI and the December trade deficit.
No major economic releases scheduled.
6:00 AM ET: NFIB Small Business Optimism Index for January.
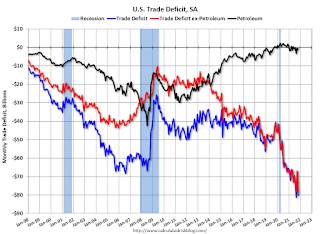 8:30 AM: Trade Balance report for December from the Census Bureau.
 This graph shows the U.S. trade deficit, with and without petroleum, through the most recent report. The blue line is the total deficit, and the black line is the petroleum deficit, and the red line is the trade deficit ex-petroleum products.
The consensus is the trade deficit to be $83.0 billion. The U.S. trade deficit was at $80.2 billion in November.
11:00 AM: NY Fed: Q4 Quarterly Report on Household Debt and Credit
7:00 AM ET: The Mortgage Bankers Association (MBA) will release the results for the mortgage purchase applications index.
8:30 AM: The initial weekly unemployment claims report will be released. The consensus is for a decrease to 235 thousand from 238 thousand last week.
8:30 AM: The Consumer Price Index for January from the BLS. The consensus is for 0.5% increase in CPI, and a 0.5% increase in core CPI.
10:00 AM: University of Michigan's Consumer sentiment index (Preliminary for February). The consensus is for a reading of 67.0.
Friday, February 04, 2022
COVID Update: February 4, 2022: Falling Cases and Hospitalizations; 2,400 Deaths per Day
by Calculated Risk on 2/04/2022 10:00:00 PM
On COVID (focus on hospitalizations and deaths):
| COVID Metrics | ||||
|---|---|---|---|---|
| Now | Week Ago | Goal | ||
| Percent fully Vaccinated | 64.0% | --- | ≥70.0%1 | |
| Fully Vaccinated (millions) | 212.3 | --- | ≥2321 | |
| New Cases per Day3 | 343,563 | 577,975 | ≤5,0002 | |
| Hospitalized3 | 120,724 | 140,770 | ≤3,0002 | |
| Deaths per Day3🚩 | 2,371 | 2,353 | ≤502 | |
| 1 Minimum to achieve "herd immunity" (estimated between 70% and 85%). 2my goals to stop daily posts, 37-day average for Cases, Currently Hospitalized, and Deaths 🚩 Increasing 7-day average week-over-week for Cases, Hospitalized, and Deaths ✅ Goal met. | ||||
 Click on graph for larger image.
This graph shows the daily (columns) and 7-day average (line) of positive tests reported.
New cases and hospitalizations are now declining.
Unfortunately, deaths are still rising, but will likely start declining soon (following cases and hospitalizations).
"Mortgage Rates Leap Toward 4.0%, Highest Since October 2019"
by Calculated Risk on 2/04/2022 04:17:00 PM
Today, in the Calculated Risk Real Estate Newsletter: "Mortgage Rates Leap Toward 4.0%, Highest Since October 2019"
A brief excerpt:
With the strong employment report for January, interest rates have increased.There is much more in the article. You can subscribe at https://calculatedrisk.substack.com/
Mortgage News Daily reports that the most prevalent 30-year fixed rate is now at 3.85% for top tier scenarios. Matthew Graham at Mortgage News Daily wrote today: Mortgage Rates Leap Toward 4.0%, Highest Since October 2019If we disregard the once-in-a-lifetime volatility seen in March 2020 (and we absolutely should), today's mortgage rates are now in line with the highs seen in October 2019. The average lender is now quoting conventional 30yr fixed rates in the 3.75-3.875% neighborhood. That's a full eighth of a point higher than yesterday, and more than a full percentage point higher than the lowest rates in August 2021. Many less than perfect loan scenarios will see rates over 4%.With the ten-year yield at 1.93%, and based on an historical relationship, 30-year rates should currently be around 3.8%. So, mortgage rates are as expected based on the ten-year yield.
The graph shows the relationship between the monthly 10-year Treasury Yield and 30-year mortgage rates from the Freddie Mac survey.
AAR: January Rail Carloads and Intermodal Down Year-over-year
by Calculated Risk on 2/04/2022 02:46:00 PM
From the Association of American Railroads (AAR) Rail Time Indicators. Graphs and excerpts reprinted with permission.
U.S. railroads originated 902,265 total carloads in January 2022, down 3.0% (27,861 carloads) from January 2021. It’s the fewest carloads for the first four weeks of a year since sometime before 1988, when our data begin. ...
U.S. intermodal volume was 1.00 million units in January 2022, down 14.6% from last year, but January 2021 was the second best month ever for intermodal.
emphasis added
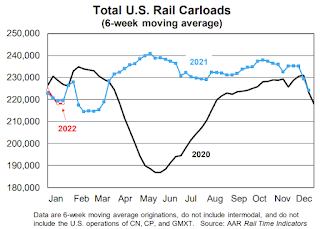 Click on graph for larger image.
This graph from the Rail Time Indicators report shows the six-week average of U.S. Carloads in 2019, 2020 and 2021:
U.S. railroads originated 902,265 total carloads in January 2022, down 3.0% (27,861 carloads) from January 2021 and the fewest for the first four weeks of a year since sometime before 1988, when our data begin. ... Carloads excluding coal fell 6.0% in January 2022 from last year, their biggest year-over-year decline since February 2021 and, before that, August 2020.
 The second graph shows the six-week average (not monthly) of U.S. intermodal in 2019, 2020 and 2021: (using intermodal or shipping containers):
U.S. intermodal originations totaled 1.00 million units in January 2022, down 14.6% (171,796 units) from January 2021. As with some carload commodities, the comparisons for intermodal were tough: January 2021 was the second highest volume month ever for U.S. intermodal, fractionally behind April 2021. January 2022 was the fifth best January ever for intermodal.
Hotels: Occupancy Rate Down 12% Compared to Same Week in 2019
by Calculated Risk on 2/04/2022 01:07:00 PM
From CoStar: STR: US Hotels Improve Performance From Prior Week
U.S. hotel performance increased slightly from the previous week and showed improved comparisons against 2019, according to STR‘s latest data through Jan. 29.The following graph shows the seasonal pattern for the hotel occupancy rate using the four-week average.
Jan. 23-29, 2022 (percentage change from comparable week in 2019*):
• Occupancy: 49.7% (-12.2%)
• Average daily rate (ADR): $122.40 (-1.9%)
• Revenue per available room (RevPAR): $60.82 (-13.9%)
*Due to the pandemic impact, STR is measuring recovery against comparable time periods from 2019.
emphasis added
Click on graph for larger image.The red line is for 2022, black is 2020, blue is the median, and dashed light blue is for 2021.
The 4-week average of the occupancy rate is below the median rate for the previous 20 years (Blue).
Note: Y-axis doesn't start at zero to better show the seasonal change.
The 4-week average of the occupancy rate will increase seasonally over the next few months.
Comments on January Employment Report
by Calculated Risk on 2/04/2022 09:32:00 AM
This was a strong report, and the revisions show job growth was stronger - and steadier - over the last year than originally reported.
The headline jobs number in the January employment report was well above expectations, and employment for the previous two months was revised up by 709,000. The participation rate and the employment-population ratio both increased, however the unemployment rate increased to 4.0%.
Leisure and hospitality gained 151 thousand jobs in January. In March and April of 2020, leisure and hospitality lost 8.20 million jobs, and are now down 1.75 million jobs since February 2020. So, leisure and hospitality has now added back about 79% all of the jobs lost in March and April 2020.
Construction employment decreased 5 thousand and is now 101 thousand below the pre-pandemic level.
Manufacturing added 13 thousand jobs and is still 226 thousand below the pre-pandemic level.
Earlier: January Employment Report: 467 thousand Jobs, 4.0% Unemployment Rate
In January, the year-over-year employment change was 6.61 million jobs.
Permanent Job Losers
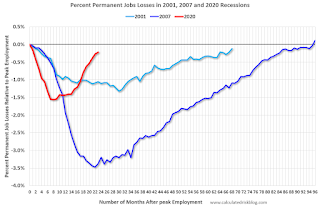 Click on graph for larger image.
This graph shows permanent job losers as a percent of the pre-recession peak in employment through the report today. (ht Joe Weisenthal at Bloomberg).
In January, the year-over-year employment change was 6.61 million jobs.
Permanent Job Losers
Click on graph for larger image.This graph shows permanent job losers as a percent of the pre-recession peak in employment through the report today. (ht Joe Weisenthal at Bloomberg).
This data is only available back to 1994, so there is only data for three recessions.
In January, the number of permanent job losers decreased to 1.630 million from 1.703 million in November.
In January, the number of permanent job losers decreased to 1.630 million from 1.703 million in November.
These jobs will likely be the hardest to recover, so it is a positive that the number of permanent job losers is declining fairly rapidly.
Prime (25 to 54 Years Old) Participation
 Since the overall participation rate has declined due to cyclical (recession) and demographic (aging population, younger people staying in school) reasons, here is the employment-population ratio for the key working age group: 25 to 54 years old.
The prime working age will be key as the economy recovers.
The 25 to 54 participation rate increased in January to 82.0% from 81.9% in December, and the 25 to 54 employment population ratio increased to 79.1% from 79.0% the previous month.
Both are still below the pre-pandemic levels and indicate that some prime workers have still not returned to the labor force.
Part Time for Economic Reasons
 From the BLS report:
These workers are included in the alternate measure of labor underutilization (U-6) that decreased to 7.1% from 7.3% in the previous month. This is down from the record high in April 22.9% for this measure since 1994. This measure was at 7.0% in February 2020 (pre-pandemic).
Unemployed over 26 Weeks
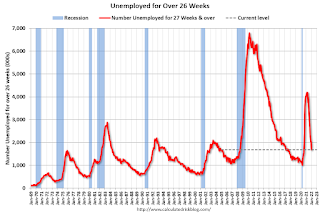 This graph shows the number of workers unemployed for 27 weeks or more.
According to the BLS, there are 1.691 million workers who have been unemployed for more than 26 weeks and still want a job, down from 2.008 million the previous month.
This does not include all the people that left the labor force.
Summary:
The headline monthly jobs number was well above expectations; and the previous two months were revised up by 709,000 combined. With the revisions - including the benchmark revision - job growth was stronger and steadier over the last year than originally reported.
Part Time for Economic Reasons
From the BLS report:"The number of persons employed part time for economic reasons, at 3.7 million, continued to trend down over the month. The over-the-year decline of 2.2 million brings this measure to 673,000 below its February 2020 level. These individuals, who would have preferred full-time employment, were working part time because their hours had been reduced or they were unable to find full-time jobs."The number of persons working part time for economic reasons decreased in January to 3.717 million from 3.929 million in December. This is lower than pre-recession levels.
These workers are included in the alternate measure of labor underutilization (U-6) that decreased to 7.1% from 7.3% in the previous month. This is down from the record high in April 22.9% for this measure since 1994. This measure was at 7.0% in February 2020 (pre-pandemic).
Unemployed over 26 Weeks
This graph shows the number of workers unemployed for 27 weeks or more. According to the BLS, there are 1.691 million workers who have been unemployed for more than 26 weeks and still want a job, down from 2.008 million the previous month.
This does not include all the people that left the labor force.
Summary:
The headline monthly jobs number was well above expectations; and the previous two months were revised up by 709,000 combined. With the revisions - including the benchmark revision - job growth was stronger and steadier over the last year than originally reported.
The headline unemployment rate increased to 4.0% as the participation rate increased. The household survey indicated a large gain in employment of 1.01 million.
The prime age participation rate and employment-population ratio, are still below pre-pandemic levels, indicating some prime workers are still out of the labor force. And there are still 2.9 million fewer jobs than prior to the recession.
Overall, this was a very strong report - and surprising given the surge in COVID cases in January.


