by Calculated Risk on 2/08/2022 08:38:00 AM
Tuesday, February 08, 2022
Trade Deficit Increased to $80.7 Billion in December
From the Department of Commerce reported:
The U.S. Census Bureau and the U.S. Bureau of Economic Analysis announced today that the goods and services deficit was $80.7 billion in December, up $1.4 billion from $79.3 billion in November, revised.
December exports were $228.1 billion, $3.4 billion more than November exports. December imports were $308.9 billion, $4.8 billion more than November imports
emphasis added
 Click on graph for larger image.
Both exports and imports increased in December.
Exports are up 20% compared to December 2020; imports are up 20% compared to December 2020.
Both imports and exports decreased sharply due to COVID-19, and have now bounced back (imports more than exports),
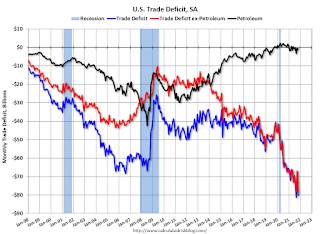
The second graph shows the U.S. trade deficit, with and without petroleum.
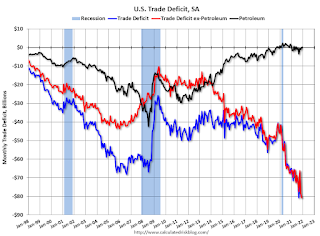 The blue line is the total deficit, and the black line is the petroleum deficit, and the red line is the trade deficit ex-petroleum products.
Note that net, imports and exports of petroleum products are close to zero.
The trade deficit with China increased to $36.1 billion in December, from $27.3 billion in December 2020.
Monday, February 07, 2022
Tuesday: Trade Deficit, NY Fed Household Debt and Credit
by Calculated Risk on 2/07/2022 07:55:00 PM
From Matthew Graham at Mortgage News Daily: MBS Live Recap: Uneventfully Holding Near Long-Term Rate Highs
Heading into the new week, European bonds remain under pressure and US bonds weren't eager to lead the charge back down to lower yield levels. Bonds improved somewhat in the afternoon, but Treasuries were unchanged at the close. [30 year fixed 3.87%]Tuesday:
emphasis added
• At 6:00 AM ET, NFIB Small Business Optimism Index for January.
• At 8:30 AM, Trade Balance report for December from the Census Bureau. The consensus is the trade deficit to be $83.0 billion. The U.S. trade deficit was at $80.2 billion in November.
• At 11:00 AM, NY Fed: Q4 Quarterly Report on Household Debt and Credit
On COVID (focus on hospitalizations and deaths):
| COVID Metrics | ||||
|---|---|---|---|---|
| Now | Week Ago | Goal | ||
| Percent fully Vaccinated | 64.1% | --- | ≥70.0%1 | |
| Fully Vaccinated (millions) | 212.9 | --- | ≥2321 | |
| New Cases per Day3 | 291,471 | 501,301 | ≤5,0002 | |
| Hospitalized3 | 104,902 | 133,784 | ≤3,0002 | |
| Deaths per Day3 | 2,294 | 2,340 | ≤502 | |
| 1 Minimum to achieve "herd immunity" (estimated between 70% and 85%). 2my goals to stop daily posts, 37-day average for Cases, Currently Hospitalized, and Deaths 🚩 Increasing 7-day average week-over-week for Cases, Hospitalized, and Deaths ✅ Goal met. | ||||
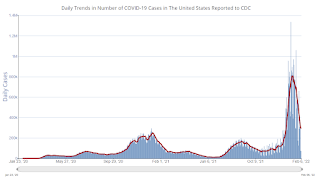 Click on graph for larger image.
This graph shows the daily (columns) and 7-day average (line) of positive tests reported.
U.S. Courts: Bankruptcy Filings Decline 24 Percent in 2021
by Calculated Risk on 2/07/2022 02:41:00 PM
From the U.S. Courts: Bankruptcy Filings Drop 24 Percent
Bankruptcy filings fell again for the 12-month period ending Dec. 31, 2021. A steady decline in filings has continued since the COVID-19 pandemic began.
Annual bankruptcy filings in calendar year 2021 totaled 413,616, compared with 544,463 cases in 2020, according to statistics released by the Administrative Office of the U.S. Courts. That is a decrease of 24.0 percent.
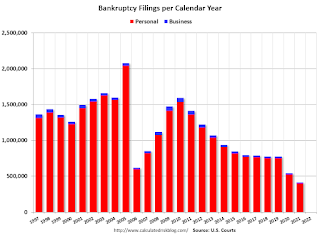 Click on graph for larger image.
This graph shows the business and non-business bankruptcy filings by calendar year since 1997.
The sharp decline in 2006 was due to the so-called "Bankruptcy Abuse Prevention and Consumer Protection Act of 2005". (a good example of Orwellian named legislation since this was more a "Lender Protection Act").
Black Knight Mortgage Monitor for December: "Worst affordability levels since 2008"
by Calculated Risk on 2/07/2022 10:18:00 AM
Today, in the Calculated Risk Real Estate Newsletter: Black Knight Mortgage Monitor for December: "Worst affordability levels since 2008"
A brief excerpt:
And on the payment to income ratio:There is much more in the article. You can subscribe at https://calculatedrisk.substack.com/
• It now takes 25.8% of the median household income to purchase the average home with 20% down and a 30-year mortgage, up from the 22.4% required at the end of Q3 2021
• Interest rate jumps in recent weeks have pushed us rapidly above the long-term, pre-Great Recession average payment-to-income ratio of 25%, resulting in the worst affordability levels since 2008
• While a 20.5% ratio has been the tipping point between market acceleration and deceleration over the past decade, severe inventory shortfalls are keeping home prices running hotter than they might otherwise
Housing Inventory February 7th Update: Inventory Down 5.9% Week-over-week; New Record Low
by Calculated Risk on 2/07/2022 09:43:00 AM
Tracking existing home inventory is very important in 2022.
Inventory usually declines in the winter, and this is a new record low for this series.

This inventory graph is courtesy of Altos Research.
Six High Frequency Indicators for the Economy
by Calculated Risk on 2/07/2022 08:40:00 AM
These indicators are mostly for travel and entertainment. It is interesting to watch these sectors recover as the pandemic subsides.
Note: Gasoline consumption returned to pre-pandemic levels.
The TSA is providing daily travel numbers.
This data is as of February 6th.
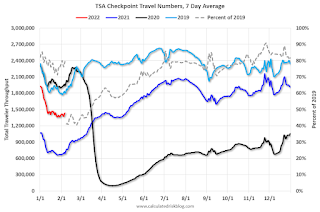 Click on graph for larger image.
This data shows the 7-day average of daily total traveler throughput from the TSA for 2019 (Light Blue), 2020 (Black), 2021 (Blue) and 2021 (Red).
The dashed line is the percent of 2019 for the seven-day average.
The 7-day average is down 20.6% from the same day in 2019 (79.4% of 2019). (Dashed line)
The second graph shows the 7-day average of the year-over-year change in diners as tabulated by OpenTable for the US and several selected cities.
 Thanks to OpenTable for providing this restaurant data:
This data is updated through February 5, 2022.
This data is "a sample of restaurants on the OpenTable network across all channels: online reservations, phone reservations, and walk-ins. For year-over-year comparisons by day, we compare to the same day of the week from the same week in the previous year."
Dining was mostly moving sideways but declined during the winter wave of COVID and is now increasing. The 7-day average for the US is down 14% compared to 2019.
 This data shows domestic box office for each week and the median for the years 2016 through 2019 (dashed light blue).
 Note that the data is usually noisy week-to-week and depends on when blockbusters are released.
Movie ticket sales were at $46 million last week, down about 73% from the median for the week.
 This graph shows the seasonal pattern for the hotel occupancy rate using the four-week average.
 The red line is for 2022, black is 2020, blue is the median, and dashed light blue is for 2021.
This data is through January 29th. The occupancy rate was down 12.2% compared to the same week in 2019.
Notes: Y-axis doesn't start at zero to better show the seasonal change.
This graph is from Apple mobility. From Apple: "This data is generated by counting the number of requests made to Apple Maps for directions in select countries/regions, sub-regions, and cities." This is just a general guide - people that regularly commute probably don't ask for directions.
 This data is through February 4th
 The graph is the running 7-day average to remove the impact of weekends.
IMPORTANT: All data is relative to January 13, 2020. This data is NOT Seasonally Adjusted. People walk and drive more when the weather is nice, so I'm just using the transit data.
According to the Apple data directions requests, public transit in the 7-day average for the US is at 99% of the January 2020 level.
Here is some interesting data on New York subway usage (HT BR).
 This graph is from Todd W Schneider.
 This data is through Friday, February 4th.
He notes: "Data updates weekly from the MTA’s public turnstile data, usually on Saturday mornings".
Sunday, February 06, 2022
Sunday Night Futures
by Calculated Risk on 2/06/2022 06:14:00 PM
Weekend:
• Schedule for Week of February 6, 2022
Monday:
• No major economic releases scheduled.
From CNBC: Pre-Market Data and Bloomberg futures S&P 500 and DOW futures are mostly unchanged (fair value).
Oil prices were up over the last week with WTI futures at $92.31 per barrel and Brent at $93.27 per barrel. A year ago, WTI was at $58, and Brent was at $60 - so WTI oil prices are up about 60% year-over-year.
Here is a graph from Gasbuddy.com for nationwide gasoline prices. Nationally prices are at $3.44 per gallon. A year ago prices were at $2.45 per gallon, so gasoline prices are up $0.99 per gallon year-over-year.
Trends in Educational Attainment in the U.S. Labor Force
by Calculated Risk on 2/06/2022 12:17:00 PM
The first graph shows the unemployment rate by four levels of education (all groups are 25 years and older) through March 2021. Note: This is an update to a post from a few years ago.
Unfortunately, this data only goes back to 1992 and includes only three recessions (the stock / tech bust in 2001, and the housing bust/financial crisis, and the 2020 pandemic). Clearly education matters with regards to the unemployment rate, with the lowest rate for college graduates at 2.3% in January, and highest for those without a high school degree at 6.3% in January.
All four groups were generally trending down prior to the pandemic. And all are nearly back to pre-pandemic levels now.

Note: This says nothing about the quality of jobs - as an example, a college graduate working at minimum wage would be considered "employed".
This brings up an interesting question: What is the composition of the labor force by educational attainment, and how has that been changing over time?
Here is some data on the U.S. labor force by educational attainment since 1992.
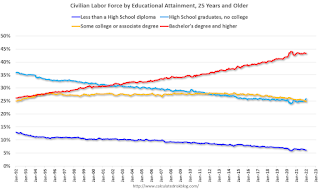
This is the only category trending up. "Some college" has been steady (and trending down lately), and both "high school" and "less than high school" have been trending down.
Based on current trends, probably half the labor force will have at least a bachelor's degree by the end of this decade (2020s).
Some thoughts: Since workers with bachelor's degrees typically have a lower unemployment rate, rising educational attainment is probably a factor in pushing down the overall unemployment rate over time.
Also, I'd guess more education would mean less labor turnover, and that education is a factor in lower weekly claims (prior to the pandemic).
A more educated labor force is a positive for the future.
Saturday, February 05, 2022
Real Estate Newsletter Articles this Week
by Calculated Risk on 2/05/2022 02:11:00 PM
At the Calculated Risk Real Estate Newsletter this week:
• "Mortgage Rates Leap Toward 4.0%, Highest Since October 2019"
• Mike Simonsen of Altos Research and I Discuss Housing
• Rents Still Increasing Sharply Year-over-year NMHC: "Apartment occupancy remains at record-highs"
• Median vs Repeat Sales Index House Prices
This is usually published several times a week, and provides more in-depth analysis of the housing market.
You can subscribe at https://calculatedrisk.substack.com/ Most content is available for free, but please subscribe!.
Schedule for Week of February 6, 2022
by Calculated Risk on 2/05/2022 08:11:00 AM
The key reports this week are January CPI and the December trade deficit.
No major economic releases scheduled.
6:00 AM ET: NFIB Small Business Optimism Index for January.
 8:30 AM: Trade Balance report for December from the Census Bureau.
 This graph shows the U.S. trade deficit, with and without petroleum, through the most recent report. The blue line is the total deficit, and the black line is the petroleum deficit, and the red line is the trade deficit ex-petroleum products.
The consensus is the trade deficit to be $83.0 billion. The U.S. trade deficit was at $80.2 billion in November.
11:00 AM: NY Fed: Q4 Quarterly Report on Household Debt and Credit
7:00 AM ET: The Mortgage Bankers Association (MBA) will release the results for the mortgage purchase applications index.
8:30 AM: The initial weekly unemployment claims report will be released. The consensus is for a decrease to 235 thousand from 238 thousand last week.
8:30 AM: The Consumer Price Index for January from the BLS. The consensus is for 0.5% increase in CPI, and a 0.5% increase in core CPI.
10:00 AM: University of Michigan's Consumer sentiment index (Preliminary for February). The consensus is for a reading of 67.0.


