 RSS Feed
 by Calculated Risk on 2/09/2022 07:00:00 AM
Wednesday, February 09, 2022
MBA: Mortgage Applications Decrease in Latest Weekly Survey
From the MBA: Mortgage Applications Decrease in Latest MBA Weekly Survey
Mortgage applications decreased 8.1 percent from one week earlier, according to data from the Mortgage Bankers Association’s (MBA) Weekly Mortgage Applications Survey for the week ending February 4, 2022.
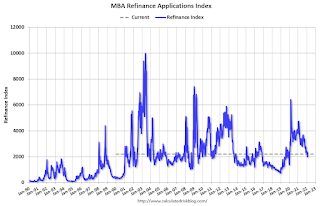
... The Refinance Index decreased 7 percent from the previous week and was 52 percent lower than the same week one year ago. The seasonally adjusted Purchase Index decreased 10 percent from one week earlier. The unadjusted Purchase Index decreased 3 percent compared with the previous week and was 12 percent lower than the same week one year ago.
“Mortgage rates continued to edge higher last week, with the 30-year fixed rate climbing to 3.83 percent. Mortgage rates followed the U.S. 10-year yield and other sovereign bonds as the Federal Reserve and other key global central banks responded to growing inflationary pressures and signaled that they will start to remove accommodative policies. With rates 87 basis points higher than the same week a year ago, refinance applications continued to decrease,” said Joel Kan, MBA’s Associate Vice President of Economic and Industry Forecasting. “Purchase activity slowed after the previous week's gain. Both conventional and FHA purchase applications saw proportional declines, resulting in purchase activity overall dropping 10 percent. The average loan size again hit another record high at $446,000. Activity continues to be dominated by larger loan balances, as inventory remains tight for entry-level buyers.”
...
The average contract interest rate for 30-year fixed-rate mortgages with conforming loan balances ($647,200 or less) increased to 3.83 percent from 3.78 percent, with points decreasing to 0.40 from 0.41 (including the origination fee) for 80 percent loan-to-value ratio (LTV) loans.
emphasis added
 Click on graph for larger image.
The first graph shows the refinance index since 1990.
With higher mortgage rates, the refinance index has declined sharply over the last several months.
The second graph shows the MBA mortgage purchase index
 According to the MBA, purchase activity is down 12% year-over-year unadjusted.
Note: Red is a four-week average (blue is weekly).
Tuesday, February 08, 2022
COVID February 8, 2022: New Cases and Hospitalizations Declining
by Calculated Risk on 2/08/2022 09:08:00 PM
On COVID (focus on hospitalizations and deaths):
| COVID Metrics | ||||
|---|---|---|---|---|
| Now | Week Ago | Goal | ||
| Percent fully Vaccinated | 64.2% | --- | ≥70.0%1 | |
| Fully Vaccinated (millions) | 213.1 | --- | ≥2321 | |
| New Cases per Day3 | 247,319 | 444,473 | ≤5,0002 | |
| Hospitalized3 | 105,449 | 131,099 | ≤3,0002 | |
| Deaths per Day3🚩 | 2,404 | 2,334 | ≤502 | |
| 1 Minimum to achieve "herd immunity" (estimated between 70% and 85%). 2my goals to stop daily posts, 37-day average for Cases, Currently Hospitalized, and Deaths 🚩 Increasing 7-day average week-over-week for Cases, Hospitalized, and Deaths ✅ Goal met. | ||||
 Click on graph for larger image.
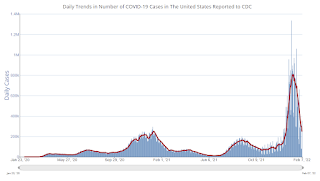
This graph shows the daily (columns) and 7-day average (line) of positive tests reported.
New cases and hospitalizations are now declining.
Leading Index for Commercial Real Estate "Falls in January"
by Calculated Risk on 2/08/2022 04:00:00 PM
From Dodge Data Analytics: Dodge Momentum Index Falls in January
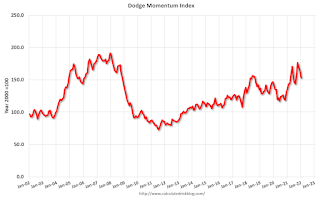
The Dodge Momentum Index declined 7% in January to a four-month low of 152.9 (2000=100), from the revised December reading of 163.7. The Momentum Index, issued by Dodge Construction Network, is a monthly measure of the initial report for nonresidential building projects in planning, which have been shown to lead construction spending for nonresidential buildings by a full year. In January, commercial planning fell 9%, and institutional planning slipped 1%.
The Dodge Momentum Index had a stellar 2021, rising 23% from 2020 and reaching levels not seen in nearly 14 years. The recent string of declines, however, may be blamed on rising costs, logistical problems and shortages of skilled labor. Still, even as it has decreased, the dollar value of projects in planning remains exceptionally strong, especially for education, warehouse and healthcare projects.
emphasis added
 Click on graph for larger image.
This graph shows the Dodge Momentum Index since 2002. The index was at 152.9 in January, down from 163.7 in December.
According to Dodge, this index leads "construction spending for nonresidential buildings by a full year". This index suggested a decline in Commercial Real Estate construction through most of 2021, but a solid pickup in 2022.
1st Look at Local Housing Markets in January
by Calculated Risk on 2/08/2022 12:26:00 PM
Today, in the Calculated Risk Real Estate Newsletter: 1st Look at Local Housing Markets in January
A brief excerpt:
From the Northwest MLS: Northwest MLS brokers see signs of busy spring market despite slow JanuaryThere is much more in the article. You can subscribe at https://calculatedrisk.substack.com/"When there's uncertainty, the default position for most sellers is to stay put, do nothing, and hunker down," suggested Mike Larson, managing broker at Compass Tacoma. He said many things are contributing to sellers' reluctance to put their homes on the market, "most notably, COVID, inflation, the economy, the holidays, and finding a replacement property. Security and certainty are more important than cashing in on record amounts of equity."And a table of January sales. Sales were down 11.2% YoY, Not Seasonally Adjusted (NSA).

NY Fed Q4 Report: Total Household Debt Increases to $15.6 trillion
by Calculated Risk on 2/08/2022 11:13:00 AM
From the NY Fed: Robust Mortgage and Auto Loan Originations Help Drive Total Household Debt to $15.58 Trillion in Q4 2021
The Federal Reserve Bank of New York's Center for Microeconomic Data today issued its Quarterly Report on Household Debt and Credit. The Report shows that total household debt increased by $333 billion (2.2%) to $15.58 trillion in the fourth quarter of 2021. The total debt balance reflects an increase of $1 trillion during 2021 and is $1.4 trillion higher than at the end of 2019. In nominal terms, the 2021 total increase in overall debt is the largest seen since 2007. The Report is based on data from the New York Fed's nationally representative Consumer Credit Panel.
Mortgage balances rose by $258 billion in the fourth quarter of 2021 and stood at $10.93 trillion at the end of December. Credit card balances increased by $52 billion, representing the largest quarterly increase observed in the 22-year history of the data. However, credit card balances remain $71 billion lower than at the end of 2019. Auto loan balances increased by $15 billion, consistent with the previous two quarters. Student loan balances contracted by $8 billion, remaining roughly flat in nominal terms at the end of 2021 after almost two decades of steady increases. In total, non-housing balances grew by $74 billion.
emphasis added
 Click on graph for larger image.
Here are three graphs from the report:
The first graph shows aggregate consumer debt increased in Q4. Household debt previously peaked in 2008 and bottomed in Q3 2013. Unlike following the great recession, there wasn't a huge decline in debt during the pandemic.
From the NY Fed:
Aggregate household debt balances increased by $333 billion in the fourth quarter of 2021, a 2.2% rise from 2021Q3, and the largest increase since 2007 in both percentage and nominal terms. Balances now stand at $15.58 trillion, reflecting an increase of $1 trillion during 2021, and stand $1.4 trillion higher than at the end of 2019.
 The second graph shows the percent of debt in delinquency.
The overall delinquency rate was unchange in Q4. From the NY Fed:
Aggregate delinquency rates were flat in the fourth quarter of 2021 but remain very low, after declining sharply through the beginning of the pandemic. The fourth quarter saw a continued decline in late delinquency offset by a small increase in the share of earlier delinquency. The low delinquency rates have reflected forbearances (provided by both the CARES Act and voluntarily offered by lenders), which protect borrowers’ credit records from the reporting of skipped or deferred payments but are now winding down. As of late December, 2.7% of outstanding debt was in some stage of delinquency, a 2.0 percentage point decrease from the fourth quarter of 2019, just before the COVID-19 pandemic hit the United States. Of the $424 billion of debt that is delinquent, $298 billion is seriously delinquent (at least 90 days late or “severely derogatory”, which includes some debts that have been removed from lenders’ books but upon which they continue to attempt collection).
 The third graph shows Mortgage Originations by Credit Score.
From the NY Fed:
The credit scores of newly originated mortgages had increased in the early part of the pandemic, but have declined in recent quarters, yet remain very high and reflect a continuing high quality of newly opened mortgages as well as a higher share of refinances. The median credit score on newly originated auto loans was roughly flat. ... In all, 2021 saw historically high volumes of new extensions of installment credit for both mortgages and auto loans. Mortgage originations, measured as appearances of new mortgage balances on consumer credit reports and which include refinances, were at $1 trillion in 2021Q4. In annual terms, mortgage origination volumes were at a historic high in 2021, with over $4.5 trillion in mortgages originated.There is much more in the report.
Trade Deficit Increased to $80.7 Billion in December
by Calculated Risk on 2/08/2022 08:38:00 AM
From the Department of Commerce reported:
The U.S. Census Bureau and the U.S. Bureau of Economic Analysis announced today that the goods and services deficit was $80.7 billion in December, up $1.4 billion from $79.3 billion in November, revised.
December exports were $228.1 billion, $3.4 billion more than November exports. December imports were $308.9 billion, $4.8 billion more than November imports
emphasis added
 Click on graph for larger image.
Both exports and imports increased in December.
Exports are up 20% compared to December 2020; imports are up 20% compared to December 2020.
Both imports and exports decreased sharply due to COVID-19, and have now bounced back (imports more than exports),
The second graph shows the U.S. trade deficit, with and without petroleum.
 The blue line is the total deficit, and the black line is the petroleum deficit, and the red line is the trade deficit ex-petroleum products.
Note that net, imports and exports of petroleum products are close to zero.
The trade deficit with China increased to $36.1 billion in December, from $27.3 billion in December 2020.
Monday, February 07, 2022
Tuesday: Trade Deficit, NY Fed Household Debt and Credit
by Calculated Risk on 2/07/2022 07:55:00 PM
From Matthew Graham at Mortgage News Daily: MBS Live Recap: Uneventfully Holding Near Long-Term Rate Highs
Heading into the new week, European bonds remain under pressure and US bonds weren't eager to lead the charge back down to lower yield levels. Bonds improved somewhat in the afternoon, but Treasuries were unchanged at the close. [30 year fixed 3.87%]Tuesday:
emphasis added
• At 6:00 AM ET, NFIB Small Business Optimism Index for January.
• At 8:30 AM, Trade Balance report for December from the Census Bureau. The consensus is the trade deficit to be $83.0 billion. The U.S. trade deficit was at $80.2 billion in November.
• At 11:00 AM, NY Fed: Q4 Quarterly Report on Household Debt and Credit
On COVID (focus on hospitalizations and deaths):
| COVID Metrics | ||||
|---|---|---|---|---|
| Now | Week Ago | Goal | ||
| Percent fully Vaccinated | 64.1% | --- | ≥70.0%1 | |
| Fully Vaccinated (millions) | 212.9 | --- | ≥2321 | |
| New Cases per Day3 | 291,471 | 501,301 | ≤5,0002 | |
| Hospitalized3 | 104,902 | 133,784 | ≤3,0002 | |
| Deaths per Day3 | 2,294 | 2,340 | ≤502 | |
| 1 Minimum to achieve "herd immunity" (estimated between 70% and 85%). 2my goals to stop daily posts, 37-day average for Cases, Currently Hospitalized, and Deaths 🚩 Increasing 7-day average week-over-week for Cases, Hospitalized, and Deaths ✅ Goal met. | ||||
 Click on graph for larger image.
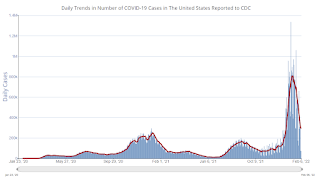
This graph shows the daily (columns) and 7-day average (line) of positive tests reported.
New cases and hospitalizations are now declining.
U.S. Courts: Bankruptcy Filings Decline 24 Percent in 2021
by Calculated Risk on 2/07/2022 02:41:00 PM
From the U.S. Courts: Bankruptcy Filings Drop 24 Percent
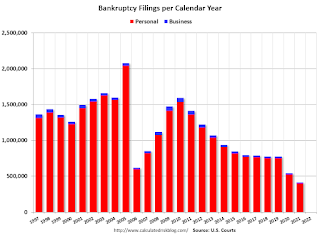
Bankruptcy filings fell again for the 12-month period ending Dec. 31, 2021. A steady decline in filings has continued since the COVID-19 pandemic began.
Annual bankruptcy filings in calendar year 2021 totaled 413,616, compared with 544,463 cases in 2020, according to statistics released by the Administrative Office of the U.S. Courts. That is a decrease of 24.0 percent.
 Click on graph for larger image.
This graph shows the business and non-business bankruptcy filings by calendar year since 1997.
The sharp decline in 2006 was due to the so-called "Bankruptcy Abuse Prevention and Consumer Protection Act of 2005". (a good example of Orwellian named legislation since this was more a "Lender Protection Act").
Black Knight Mortgage Monitor for December: "Worst affordability levels since 2008"
by Calculated Risk on 2/07/2022 10:18:00 AM
Today, in the Calculated Risk Real Estate Newsletter: Black Knight Mortgage Monitor for December: "Worst affordability levels since 2008"
A brief excerpt:
And on the payment to income ratio:There is much more in the article. You can subscribe at https://calculatedrisk.substack.com/
• It now takes 25.8% of the median household income to purchase the average home with 20% down and a 30-year mortgage, up from the 22.4% required at the end of Q3 2021
• Interest rate jumps in recent weeks have pushed us rapidly above the long-term, pre-Great Recession average payment-to-income ratio of 25%, resulting in the worst affordability levels since 2008
• While a 20.5% ratio has been the tipping point between market acceleration and deceleration over the past decade, severe inventory shortfalls are keeping home prices running hotter than they might otherwise
Housing Inventory February 7th Update: Inventory Down 5.9% Week-over-week; New Record Low
by Calculated Risk on 2/07/2022 09:43:00 AM
Tracking existing home inventory is very important in 2022.
Inventory usually declines in the winter, and this is a new record low for this series.

This inventory graph is courtesy of Altos Research.
As of February 4th, inventory was at 256 thousand (7-day average), compared to 355 thousand for the same week a year ago. That is a decline of 27.9%. A week ago, inventory was at 272 thousand, and was down 25.9% YoY.
Inventory was down 5.9% from the previous week.
Compared to the same week in 2020, inventory is down 64.6% from 722 thousand.
Last year, seasonally, inventory bottomed in April 2021 - very late in the year - usually inventory bottoms by February. An early key in 2022 will be to watch if inventory bottoms earlier this year.
Mike Simonsen discusses this data regularly on Youtube.


