 RSS Feed
 by Calculated Risk on 2/10/2022 09:17:00 PM
Thursday, February 10, 2022
"Mortgage Rates Hit 4.0% For First Time Since May 2019"
From Matthew Graham at Mortgage News Daily: Mortgage Rates Hit 4.0% For First Time Since May 2019
In case it wasn't already clear based on the headline, the average is currently up to 4.02%. Keep in mind that is an average among top tier scenarios. It means that some lenders are quoting 3.625% and others are up to 4.375%. Adding any complexity to the scenario would mean a different rate. Also keep in mind that lenders are MUCH more widely stratified than normal, which is often the case when we've seen as much volatility as we have so far in 2022. [30 year fixed 4.02%]On COVID (focus on hospitalizations and deaths):
emphasis added
| COVID Metrics | ||||
|---|---|---|---|---|
| Now | Week Ago | Goal | ||
| Percent fully Vaccinated | 64.3% | --- | ≥70.0%1 | |
| Fully Vaccinated (millions) | 213.4 | --- | ≥2321 | |
| New Cases per Day3 | 215,418 | 376,855 | ≤5,0002 | |
| Hospitalized3 | 99,535 | 125,219 | ≤3,0002 | |
| Deaths per Day3 | 2,313 | 2,458 | ≤502 | |
| 1 Minimum to achieve "herd immunity" (estimated between 70% and 85%). 2my goals to stop daily posts, 37-day average for Cases, Currently Hospitalized, and Deaths 🚩 Increasing 7-day average week-over-week for Cases, Hospitalized, and Deaths ✅ Goal met. | ||||
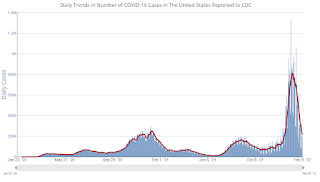 Click on graph for larger image.
This graph shows the daily (columns) and 7-day average (line) of positive tests reported.
New cases, hospitalizations and deaths are now declining.
Hotels: Occupancy Rate Down 16% Compared to Same Week in 2019
by Calculated Risk on 2/10/2022 04:27:00 PM
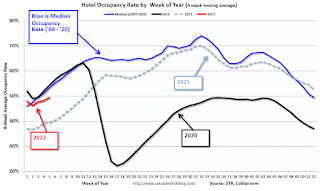
U.S. weekly hotel occupancy eclipsed 50% for the first time in more than a month, but the index to 2019 dipped from the week prior, according to STR‘s latest data through 5 February.The following graph shows the seasonal pattern for the hotel occupancy rate using the four-week average.
Jan. 30 through Feb. 5, 2022 (percentage change from comparable week in 2019*):
• Occupancy: 50.4% (-15.8%)
• Average daily rate (ADR): $125.06 (-1.2%)
• evenue per available room (RevPAR): $63.05 (-16.8%)
*Due to the pandemic impact, STR is measuring recovery against comparable time periods from 2019.
emphasis added
 Click on graph for larger image.
The red line is for 2022, black is 2020, blue is the median, and dashed light blue is for 2021.
The 4-week average of the occupancy rate is below the median rate for the previous 20 years (Blue).
Note: Y-axis doesn't start at zero to better show the seasonal change.
The 4-week average of the occupancy rate will increase seasonally over the next few months.
The Impact on Housing of Higher Mortgage Rates
by Calculated Risk on 2/10/2022 12:05:00 PM
Today, in the Calculated Risk Real Estate Newsletter: The Impact on Housing of Higher Mortgage Rates
A brief excerpt:
Looking back at previous periods with similar increases in mortgage rates - like in 2013 when mortgage rates increased from 3.4% to 4.5% from May to July - new home sales fell from about 440 thousand per month to about 390 thousand per month. This was a decline of about 10%.There is much more in the article. You can subscribe at https://calculatedrisk.substack.com/
There was a similar decline in 1994 when rates increased from 7.2% to 8.4%, and new home sales fell from around 730 thousand to 650 thousand. And in 2018, rates increased from around 4.0% to 4.9%, and new home sales declined from around 650 thousand to 590 thousand.
There are other periods when rates increased - like in 1999 - and new home sales only declined slightly. Here is a graph of 30-year mortage rates. The arrows point to the three periods mentioned above.
...
With 4% 30-year mortgage rates, we will likely see a slowdown in both new and existing home sales (based on previous periods of rising rates). It also seems likely house price growth will slow. However, the impact on inventory is unclear.
An interesting question: Will higher mortgage rates slow investor buying? Higher rates will make buy-to-rent less attractive. Investor buying - and build-to-rent - will be areas to watch.
There is further downside risk if mortgage rates continue to increase, or if we see a significant increase in inventory (something we didn’t see in previous periods of rising mortgage rates).
Cleveland Fed: Median CPI increased 0.6% and Trimmed-mean CPI increased 0.6% in January
by Calculated Risk on 2/10/2022 11:21:00 AM
The Cleveland Fed released the median CPI and the trimmed-mean CPI this morning:
According to the Federal Reserve Bank of Cleveland, the median Consumer Price Index rose 0.6% in January. The 16% trimmed-mean Consumer Price Index also increased 0.6% in January. "The median CPI and 16% trimmed-mean CPI are measures of core inflation calculated by the Federal Reserve Bank of Cleveland based on data released in the Bureau of Labor Statistics’ (BLS) monthly CPI report".
Note: The Cleveland Fed released the median CPI details here: "Used Cars" were only up 19% annualized, and this will likely show declines in coming months.
Note that Owners' Equivalent Rent and Rent of Primary Residence account for almost 1/3 of median CPI, and these measures were up around 5.5% annualized in January.
 Click on graph for larger image.
This graph shows the year-over-year change for these four key measures of inflation.
Click on graph for larger image.This graph shows the year-over-year change for these four key measures of inflation.
On a year-over-year basis, the median CPI rose 4.2%, the trimmed-mean CPI rose 5.4%, and the CPI less food and energy rose 6.0%. Core PCE is for December and increased 4.85% year-over-year.
MBA: "Mortgage Delinquencies Decrease in the Fourth Quarter of 2021"
by Calculated Risk on 2/10/2022 10:44:00 AM
From the MBA: Mortgage Delinquencies Decrease in the Fourth Quarter of 2021
The delinquency rate for mortgage loans on one-to-four-unit residential properties decreased to a seasonally adjusted rate of 4.65 percent of all loans outstanding at the end of the fourth quarter of 2021, according to the Mortgage Bankers Association’s (MBA) National Delinquency Survey.
For the purposes of the survey, MBA asks servicers to report loans in forbearance as delinquent if the payment was not made based on the original terms of the mortgage. The delinquency rate was down 23 basis points from the third quarter of 2021 and down 208 basis points from one year ago.
“Mortgage delinquencies descended in the final three months of 2021, reaching levels at or below MBA’s survey averages dating back to 1979,” said Marina Walsh, CMB, MBA’s Vice President of Industry Analysis. “The fourth-quarter delinquency rate of 4.65 percent was 67 basis points lower than MBA’s survey average of 5.32 percent. Furthermore, the seriously delinquent rate, the percentage of loans that are 90 days or more past due or in the process of foreclosure, was 2.83 percent in the fourth quarter, close to the long-term average of 2.80 percent.”
Added Walsh, “The quarters right before the COVID-19 pandemic represented some of the lowest delinquencies ever recorded. Delinquencies are now approaching levels not seen since the first quarter of 2020, which is a testament to the strength of the U.S. labor market.”
emphasis added
 Click on graph for larger image.
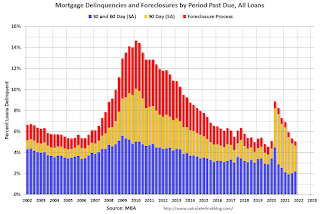
This graph shows the percent of loans delinquent by days past due. Overall delinquencies decreased in Q4.
From the MBA:
Compared to last quarter, the seasonally adjusted mortgage delinquency rate decreased for all loans outstanding. By stage, the 30-day delinquency rate increased 14 basis points to 1.65 percent, the 60-day delinquency rate increased 4 basis points to 0.56 percent, and the 90-day delinquency bucket decreased 41 basis points to 2.44 percent.This sharp increase in 2020 in the 90-day bucket was due to loans in forbearance (included as delinquent, but not reported to the credit bureaus).
...
The delinquency rate includes loans that are at least one payment past due but does not include loans in the process of foreclosure. The percentage of loans in the foreclosure process at the end of the fourth quarter was 0.42 percent, down 4 basis points from the third quarter of 2021 and 14 basis points lower than one year ago. This is the lowest foreclosure inventory rate since the third quarter of 1981. The percentage of loans on which foreclosure actions were started in the fourth quarter rose by 1 basis point to 0.04 percent, up from the survey low seen in third-quarter 2021 at 0.03 percent.
The percent of loans in the foreclosure process declined further and was at the lowest level since 1981.
Weekly Initial Unemployment Claims Decrease to 223,000
by Calculated Risk on 2/10/2022 08:40:00 AM
The DOL reported:
In the week ending February 5, the advance figure for seasonally adjusted initial claims was 223,000, a decrease of 16,000 from the previous week's revised level. The previous week's level was revised up by 1,000 from 238,000 to 239,000. The 4-week moving average was 253,250, a decrease of 2,000 from the previous week's revised average. The previous week's average was revised up by 250 from 255,000 to 255,250.The following graph shows the 4-week moving average of weekly claims since 1971.
emphasis added
 Click on graph for larger image.
The dashed line on the graph is the current 4-week average. The four-week average of weekly unemployment claims decreased to 253,250.
The previous week was revised up.
Weekly claims were lower than the consensus forecast.
BLS: CPI increased 0.6% in January; Core CPI increased 0.6%
by Calculated Risk on 2/10/2022 08:31:00 AM
The Consumer Price Index for All Urban Consumers (CPI-U) increased 0.6 percent in January on a seasonally adjusted basis, the U.S. Bureau of Labor Statistics reported today. Over the last 12 months, the all items index increased 7.5 percent before seasonal adjustment.Both CPI and core CPI were above expectations. I'll post a graph later today after the Cleveland Fed releases the median and trimmed-mean CPI.
Increases in the indexes for food, electricity, and shelter were the largest contributors to the seasonally adjusted all items increase. The food index rose 0.9 percent in January following a 0.5-percent increase in December. The energy index also increased 0.9 percent over the month, with an increase in the electricity index being partially offset by declines in the gasoline index and the natural gas index.
The index for all items less food and energy rose 0.6 percent in January, the same increase as in December. This was the seventh time in the last 10 months it has increased at least 0.5 percent. Along with the index for shelter, the indexes for household furnishings and operations, used cars and trucks, medical care, and apparel were among many indexes that increased over the month.
The all items index rose 7.5 percent for the 12 months ending January, the largest 12-month increase since the period ending February 1982. The all items less food and energy index rose 6.0 percent, the largest 12-month change since the period ending August 1982. The energy index rose 27.0 percent over the last year, and the food index increased 7.0 percent.
emphasis added
Wednesday, February 09, 2022
Thursday: CPI, Initial Unemployment Claims
by Calculated Risk on 2/09/2022 08:14:00 PM
Thursday:
• At 8:30 AM ET, the initial weekly unemployment claims report will be released. The consensus is for a decrease to 235 thousand from 238 thousand last week.
• Also, at 8:30 AM, The Consumer Price Index for January from the BLS. The consensus is for 0.5% increase in CPI, and a 0.5% increase in core CPI.
On COVID (focus on hospitalizations and deaths):
| COVID Metrics | ||||
|---|---|---|---|---|
| Now | Week Ago | Goal | ||
| Percent fully Vaccinated | 64.2% | --- | ≥70.0%1 | |
| Fully Vaccinated (millions) | 213.2 | --- | ≥2321 | |
| New Cases per Day3 | 230,602 | 413,730 | ≤5,0002 | |
| Hospitalized3 | 102,695 | 128,366 | ≤3,0002 | |
| Deaths per Day3 | 2,303 | 2,402 | ≤502 | |
| 1 Minimum to achieve "herd immunity" (estimated between 70% and 85%). 2my goals to stop daily posts, 37-day average for Cases, Currently Hospitalized, and Deaths 🚩 Increasing 7-day average week-over-week for Cases, Hospitalized, and Deaths ✅ Goal met. | ||||
 Click on graph for larger image.
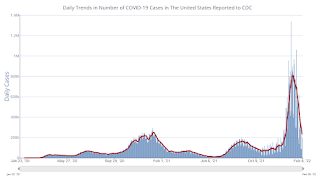
This graph shows the daily (columns) and 7-day average (line) of positive tests reported.
New cases, hospitalizations and deaths are now declining.
2nd Look at Local Housing Markets in January
by Calculated Risk on 2/09/2022 03:09:00 PM
Today, in the Calculated Risk Real Estate Newsletter: 2nd Look at Local Housing Markets in January
A brief excerpt:
Adding Houston, Memphis, Nashville, New Hampshire, North Texas and PortlandThere is much more in the article. You can subscribe at https://calculatedrisk.substack.com/
This is the second look at local markets in January. I’m tracking about 30 local housing markets in the US. Some of the 30 markets are states, and some are metropolitan areas. I’ll update these tables throughout the month as additional data is released.
My view is that if the housing market starts slowing, it will show up in inventory first (not yet!).
The following data is important, especially active inventory. One of the key factors for house prices is supply and tracking local inventory reports will help us understand what is happening with supply.
On a national basis, we are seeing record low inventory over the Winter. I’ll be watching to see if inventory follows the normal seasonal pattern and bottoms in February. Last year, inventory didn’t bottom until April.
...
Here is a summary of active listings for these housing markets in January. Inventory was down 9.5% in January month-over-month (MoM) from December, and down 25.7% year-over-year (YoY).
Inventory almost always declines seasonally during the Winter, so the MoM decline is not a surprise. Last month, these markets were down 24.8% YoY, so the YoY decline in January is slightly larger than in December. This isn’t indicating a slowing market.
Notes for all tables:
New additions to table in BOLD.
Northwest (Seattle), North Texas (Dallas)
Energy expenditures as a percentage of PCE
by Calculated Risk on 2/09/2022 09:25:00 AM
During the early stages of the pandemic, energy expenditures as a percentage of PCE hit an all-time low of 3.3% of PCE. Since then, energy expenditures have increased. Here is an update through the December PCE report.
Below is a graph of expenditures on energy goods and services as a percent of total personal consumption expenditures through December 2021.
This is one of the measures that Professor Hamilton at Econbrowser looks at to evaluate any drag on GDP from energy prices.
Click on graph for larger image.
Data source: BEA.
The huge spikes in energy prices during the oil crisis of 1973 and 1979 are obvious. As is the increase in energy prices during the 2001 through 2008 period.
In general, energy expenditures as a percent of PCE have been trending down for years.

In December 2021, energy expenditures as a percentage of PCE had increased and were at 4.3% of PCE.
This is above the pre-pandemic level in early 2020, but below the levels in 2018.


