 RSS Feed
 by Calculated Risk on 2/14/2022 08:57:00 AM
Monday, February 14, 2022
Six High Frequency Indicators for the Economy
These indicators are mostly for travel and entertainment. It is interesting to watch these sectors recover as the pandemic subsides.
There was a clear negative impact from the omicron variant of COVID that is starting to ease.
----- Airlines: Transportation Security Administration -----
The TSA is providing daily travel numbers.
This data is as of February 13th.
 Click on graph for larger image.
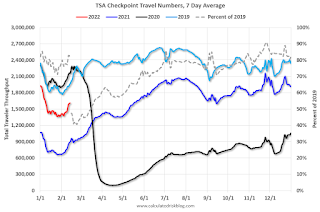
This data shows the 7-day average of daily total traveler throughput from the TSA for 2019 (Light Blue), 2020 (Black), 2021 (Blue) and 2022 (Red).
The dashed line is the percent of 2019 for the seven-day average.
The 7-day average is down 18.1% from the same day in 2019 (81.9% of 2019). (Dashed line)
----- Restaurants: OpenTable -----
The second graph shows the 7-day average of the year-over-year change in diners as tabulated by OpenTable for the US and several selected cities.
----- Movie Tickets: Box Office Mojo -----
 This data shows domestic box office for each week and the median for the years 2016 through 2019 (dashed light blue).
----- Hotel Occupancy: STR -----
 This graph shows the seasonal pattern for the hotel occupancy rate using the four-week average.
The red line is for 2022, black is 2020, blue is the median, and dashed light blue is for 2021.
This data is through February 5th. The occupancy rate was down 15.8% compared to the same week in 2019.
----- Transit: Apple Mobility -----
This graph is from Apple mobility. From Apple: "This data is generated by counting the number of requests made to Apple Maps for directions in select countries/regions, sub-regions, and cities." This is just a general guide - people that regularly commute probably don't ask for directions.
 This data is through February 10th
----- New York City Subway Usage -----
Here is some interesting data on New York subway usage (HT BR).
 This graph is from Todd W Schneider.
This data is through Friday, February 11th.
He notes: "Data updates weekly from the MTA’s public turnstile data, usually on Saturday mornings".
The TSA is providing daily travel numbers.
This data is as of February 13th.
Click on graph for larger image.This data shows the 7-day average of daily total traveler throughput from the TSA for 2019 (Light Blue), 2020 (Black), 2021 (Blue) and 2022 (Red).
The dashed line is the percent of 2019 for the seven-day average.
The 7-day average is down 18.1% from the same day in 2019 (81.9% of 2019). (Dashed line)
Air travel had been off about 20% relative to 2019 for most of the second half of 2021 (with some ups and downs) - but picked up over the Thanksgiving and Christmas holidays (solid leisure travel) - and has declined in early 2022 (omicron / weak business travel).
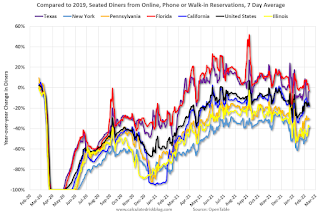
The second graph shows the 7-day average of the year-over-year change in diners as tabulated by OpenTable for the US and several selected cities.
IMPORTANT: OpenTable notes: "we’ve updated the data including downloadable dataset from January 1, 2021, onward to compare seated diners from 2021 to 2019, as opposed to year over year." Thanks!
 Thanks to OpenTable for providing this restaurant data:
This data is updated through February 12, 2022.
This data is "a sample of restaurants on the OpenTable network across all channels: online reservations, phone reservations, and walk-ins. For year-over-year comparisons by day, we compare to the same day of the week from the same week in the previous year."
Dining was mostly moving sideways but declined during the winter wave of COVID and is now increasing. The 7-day average for the US is down 17% compared to 2019.
Thanks to OpenTable for providing this restaurant data:This data is updated through February 12, 2022.
This data is "a sample of restaurants on the OpenTable network across all channels: online reservations, phone reservations, and walk-ins. For year-over-year comparisons by day, we compare to the same day of the week from the same week in the previous year."
Dining was mostly moving sideways but declined during the winter wave of COVID and is now increasing. The 7-day average for the US is down 17% compared to 2019.
This data shows domestic box office for each week and the median for the years 2016 through 2019 (dashed light blue). Black is 2020, Blue is 2021 and Red is 2022.
The data is from BoxOfficeMojo through February 10th.
Note that the data is usually noisy week-to-week and depends on when blockbusters are released.
Movie ticket sales were at $77 million last week, down about 41% from the median for the week.
Note that the data is usually noisy week-to-week and depends on when blockbusters are released.
Movie ticket sales were at $77 million last week, down about 41% from the median for the week.
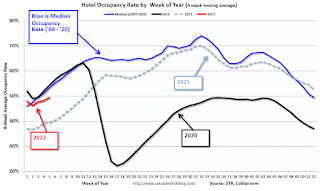
This graph shows the seasonal pattern for the hotel occupancy rate using the four-week average. The red line is for 2022, black is 2020, blue is the median, and dashed light blue is for 2021.
This data is through February 5th. The occupancy rate was down 15.8% compared to the same week in 2019.
The 4-week average of the occupancy rate is below the median rate for the previous 20 years (Blue).
Notes: Y-axis doesn't start at zero to better show the seasonal change.
Notes: Y-axis doesn't start at zero to better show the seasonal change.
The 4-week average of the occupancy rate will increase seasonally over the next few months. The key question is: How much business travel will return?
This graph is from Apple mobility. From Apple: "This data is generated by counting the number of requests made to Apple Maps for directions in select countries/regions, sub-regions, and cities." This is just a general guide - people that regularly commute probably don't ask for directions.
This data is through February 10th for the United States and several selected cities.
The graph is the running 7-day average to remove the impact of weekends.
IMPORTANT: All data is relative to January 13, 2020. This data is NOT Seasonally Adjusted. People walk and drive more when the weather is nice, so I'm just using the transit data.
According to the Apple data directions requests, public transit in the 7-day average for the US is at 105% of the January 2020 level.
Here is some interesting data on New York subway usage (HT BR).
This graph is from Todd W Schneider. This graph shows how much MTA traffic has recovered in each borough (Graph starts at first week in January 2020 and 100 = 2019 average).
Manhattan is at about 35% of normal.
This data is through Friday, February 11th.
He notes: "Data updates weekly from the MTA’s public turnstile data, usually on Saturday mornings".
Sunday, February 13, 2022
Sunday Night Futures
by Calculated Risk on 2/13/2022 06:10:00 PM
Weekend:
• Schedule for Week of February 13, 2022
Monday:
• No major economic releases scheduled.
From CNBC: Pre-Market Data and Bloomberg futures S&P 500 and DOW futures are mostly unchanged (fair value).
Oil prices were up over the last week with WTI futures at $93.10 per barrel and Brent at $94.44 per barrel. A year ago, WTI was at $60, and Brent was at $63 - so WTI oil prices are up about 50% year-over-year.
Here is a graph from Gasbuddy.com for nationwide gasoline prices. Nationally prices are at $3.47 per gallon. A year ago prices were at $2.50 per gallon, so gasoline prices are up $0.97 per gallon year-over-year.
3rd Look at Local Housing Markets in January
by Calculated Risk on 2/13/2022 10:37:00 AM
Today, in the Calculated Risk Real Estate Newsletter: 3rd Look at Local Housing Markets in January
A brief excerpt:
Adding Albuquerque, Atlanta, Colorado, Georgia, Jacksonville, Minnesota, Sacramento, Santa Clara and South CarolinaThere is much more in the article. You can subscribe at https://calculatedrisk.substack.com/
...
Here is a summary of active listings for these housing markets in January. Inventory was down 10.3% in January month-over-month (MoM) from December, and down 27.9% year-over-year (YoY).
Inventory almost always declines seasonally during the Winter, so the MoM decline is not a surprise. Last month, these markets were down 26.5% YoY, so the YoY decline in January is slightly larger than in December. This isn’t indicating a slowing market
Notes for all tables:
1. New additions to table in BOLD.
2. Northwest (Seattle), North Texas (Dallas), and Santa Clara (San Jose), Jacksonville, Source: Northeast Florida Association of REALTORS®
3. Totals do not include Denver and Atlanta (included in state totals).
Saturday, February 12, 2022
Real Estate Newsletter Articles this Week
by Calculated Risk on 2/12/2022 02:11:00 PM
At the Calculated Risk Real Estate Newsletter this week:
• The Impact on Housing of Higher Mortgage Rates
• 2nd Look at Local Housing Markets in January Adding Houston, Memphis, Nashville, New Hampshire, North Texas and Portland
• Black Knight Mortgage Monitor for December "Worst affordability levels since 2008"
• 1st Look at Local Housing Markets in January Denver: "the market ended with ... over 10 times less inventory than normal"
This is usually published several times a week, and provides more in-depth analysis of the housing market.
The blog will continue as always!
You can subscribe at https://calculatedrisk.substack.com/ Most content is available for free, but please subscribe!.
You can subscribe at https://calculatedrisk.substack.com/ Most content is available for free, but please subscribe!.
Schedule for Week of February 13, 2022
by Calculated Risk on 2/12/2022 08:11:00 AM
The key reports this week are January Housing Starts, Retail sales and Existing Home sales.
For manufacturing, the January Industrial Production report, and the February NY and Philly Fed manufacturing surveys will be released this week.
No major economic releases scheduled.
8:30 AM ET: The Producer Price Index for December from the BLS. The consensus is for a 0.5% increase in PPI, and a 0.5% increase in core PPI.
8:30 AM: The New York Fed Empire State manufacturing survey for February. The consensus is for a reading of 12.0, up from -0.7.
7:00 AM ET: The Mortgage Bankers Association (MBA) will release the results for the mortgage purchase applications index.
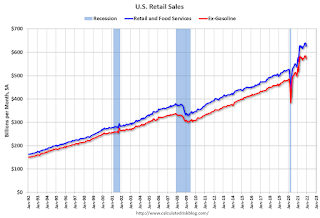 8:30 AM: Retail sales for January is scheduled to be released. The consensus is for a 1.8% increase in retail sales.
This graph shows retail sales since 1992. This is monthly retail sales and food service, seasonally adjusted (total and ex-gasoline).
Retail sales ex-gasoline were down 2.0% in December.
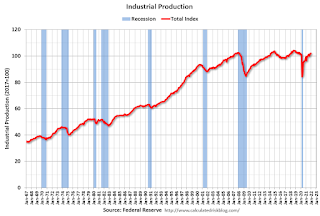 9:15 AM: The Fed will release Industrial Production and Capacity Utilization for January.
This graph shows industrial production since 1967.
The consensus is for a 0.4% increase in Industrial Production, and for Capacity Utilization to increase to 76.7%.
10:00 AM: The February NAHB homebuilder survey. The consensus is for a reading of 82, down from 83. Any number above 50 indicates that more builders view sales conditions as good than poor.
2:00 PM: FOMC Minutes, Meeting of Jan. 25-26
8:30 AM: The initial weekly unemployment claims report will be released. The consensus is for a decrease to 222 thousand from 223 thousand last week.
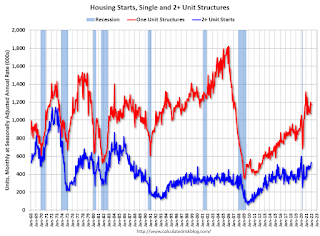 8:30 AM: Housing Starts for January.
 This graph shows single and multi-family housing starts since 1968.
The consensus is for 1.700 million SAAR, down from 1.702 million SAAR.
8:30 AM: the Philly Fed manufacturing survey for February. The consensus is for a reading of 20.0, down from 23.2.
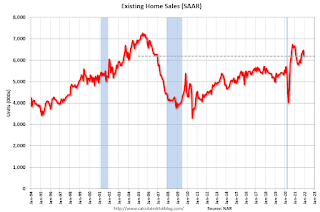 10:00 AM: Existing Home Sales for January from the National Association of Realtors (NAR). The consensus is for 6.12 million SAAR, down from 6.18 million.
The graph shows existing home sales from 1994 through the report last month.
Friday, February 11, 2022
COVID Update: February 11, 2022: Falling Cases, Deaths and Hospitalizations
by Calculated Risk on 2/11/2022 10:03:00 PM
On COVID (focus on hospitalizations and deaths):
| COVID Metrics | ||||
|---|---|---|---|---|
| Now | Week Ago | Goal | ||
| Percent fully Vaccinated | 64.3% | --- | ≥70.0%1 | |
| Fully Vaccinated (millions) | 213.6 | --- | ≥2321 | |
| New Cases per Day3 | 190,401 | 344,320 | ≤5,0002 | |
| Hospitalized3 | 95,642 | 121,845 | ≤3,0002 | |
| Deaths per Day3 | 2,305 | 2,419 | ≤502 | |
| 1 Minimum to achieve "herd immunity" (estimated between 70% and 85%). 2my goals to stop daily posts, 37-day average for Cases, Currently Hospitalized, and Deaths 🚩 Increasing 7-day average week-over-week for Cases, Hospitalized, and Deaths ✅ Goal met. | ||||
 Click on graph for larger image.
This graph shows the daily (columns) and 7-day average (line) of positive tests reported.
Lawler: Deaths by Age
by Calculated Risk on 2/11/2022 05:01:00 PM
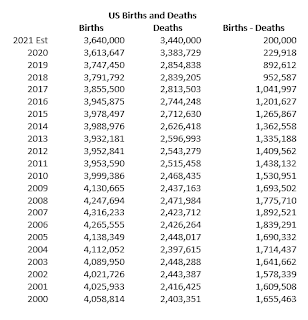
From housing economist Tom Lawler: (CR Note: This is valuable demographic data)
Provisional data from the CDC indicate that there have been 3,427,882 US deaths reported for 2021 as of 2/9/2022, up from 3,383,729 deaths in 2020. Because of reporting delays in some parts of the country the 2021 final death numbers will be a little bit higher that the numbers in the 2/9 report.
CDC also reports provisional death counts by age groups, and below is a table showing 2021 deaths reported so far by age compared to final death counts by age for 2020 and 2019.

Missing Workers by Age Group
by Calculated Risk on 2/11/2022 02:09:00 PM
Note: This is an update to an earlier post.
Back in November, Goldman Sachs economists put out a research note on the labor force participation rate: Why Isn’t Labor Force Participation Recovering?
Here are few excerpts from the note:
 Click on graph for larger image.
This data is comparing January 2022 to January 2020, using Not Seasonally Adjusted (NSA) data (I compared to January 2020 to minimize the seasonal impact when using NSA data).
While the unemployment rate continues to fall quickly, labor force participation has made no progress since August 2020. ... Most of the 5.0mn persons who have exited the labor force since the start of the pandemic are over age 55 (3.4mn), largely reflecting early (1.5mn) and natural (1mn) retirements that likely won’t reverse. The outlook for prime-age persons who have exited the labor force (1.7mn) is more positive, since very few are discouraged and most still view their exits as temporary.
First, there are two important monthly surveys from the BLS. The participation rate (and unemployment rate) comes from the Current Population Survey (CPS: commonly called the household survey), a monthly survey of about 60,000 households.
The jobs number comes from Current Employment Statistics (CES: payroll survey), a sample of approximately 634,000 business establishments nationwide.
These are very different surveys: the CPS gives the total number of employed (and unemployed including the alternative measures), and the CES gives the total number of positions (excluding some categories like the self-employed, and a person working two jobs counts as two positions).
Currently the payroll survey shows there are 2.9 million fewer jobs than in February 2020 (pre-pandemic).
The household survey shows there are 1.7 million fewer people employed than in February 2020.
Note: The 5 million number for the labor force, probably assumes some normal labor force growth; however, overall population growth has been dismal over the last 2 years (little immigration and large number of deaths). I'm not confident in Goldman's 5-million-person estimate.
Here is a graph of the number of missing people by age group (from the CPS household survey).
Click on graph for larger image.This data is comparing January 2022 to January 2020, using Not Seasonally Adjusted (NSA) data (I compared to January 2020 to minimize the seasonal impact when using NSA data).
Positive numbers are missing workers.
Almost all of the missing employed workers - by this method - are in the 25 to 29 and 45 to 49 age groups, and most are women.
Note: this is over a 2-year period, and there have been some demographic shifts between cohorts.
This data would suggest most of the missing workers are prime age (or some took early retirement).
Q1 GDP Forecasts: Slightly Positive
by Calculated Risk on 2/11/2022 11:28:00 AM
Here are a few early forecasts for Q1 GDP.
From BofA:
1Q GDP tracking estimate to 2.0% qoq saar [February 4 estimate]From Goldman Sachs:
emphasis added
We left our Q1 GDP tracking estimate unchanged at +0.5% (qoq ar). We also left our past-quarter GDP tracking estimate for Q4 unchanged at +7.1% (qoq ar). [February 9 estimate]And from the Altanta Fed: GDPNow
The GDPNow model estimate for real GDP growth (seasonally adjusted annual rate) in the first quarter of 2022 is 0.7 percent on February 9, unchanged from February 8 after rounding. After this morning’s wholesale trade release from the US Census Bureau, the nowcast of the contribution of inventory investment to first-quarter real GDP growth decreased from -2.40 percentage points to -2.41 percentage points. [February 9 estimate]
Lawler: Update on US Demographic Drivers in 2021
by Calculated Risk on 2/11/2022 09:02:00 AM
From housing economist Tom Lawler: Update on US Demographic Drivers in 2021
Births: Provisional data from the CDC show that US births totaled 978,000 in the third quarter of 2021, up 2.8% from the comparable quarter of 2020. While births in the first nine months of 2021 were down 0.18% from the comparable period of 2020, the trend in births began increasing in the second half of last year. Assuming this trend continued through last quarter – and adjusting for the normal seasonal pattern of births – a “best guess” for total US births in 2021 would be about 3.64 million. That level would be about 0.7% above 2020’s historically low level, though it would still be the second lowest annual number of births since 1981.
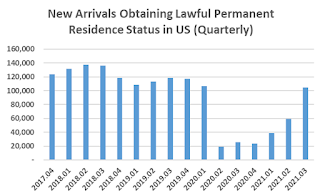
Net International Migration: While there are no timely data on net international migration, there are some indicators that suggest that US immigration increased significantly in the second half of last year from the incredibly low levels of the previous 18 months.
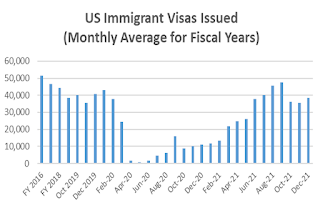
The U.S Department of State’s data on monthly immigrant visa issuance show that such issuance, which was incredibly low in the last nine months of 2020 and the first few months of 2021, increased significantly beginning in the Spring of last year.
If that were the case, and if the birth and death numbers I showed in the above were correct, then the US resident population last year would have increased by 650,000, or 0.2%. While such growth is historically extremely low, it is actually somewhat higher than the Census estimate for growth from 7/1/2020 to 7/1/2021 (392,665, or 0.1%).


