 RSS Feed
 by Calculated Risk on 2/16/2022 07:00:00 AM
Wednesday, February 16, 2022
MBA: Mortgage Applications Decrease in Latest Weekly Survey
From the MBA: Mortgage Applications Decrease in Latest MBA Weekly Survey
Mortgage applications decreased 5.4 percent from one week earlier, according to data from the Mortgage Bankers Association’s (MBA) Weekly Mortgage Applications Survey for the week ending February 11, 2022.
... The Refinance Index decreased 9 percent from the previous week and was 54 percent lower than the same week one year ago. The seasonally adjusted Purchase Index decreased 1 percent from one week earlier. The unadjusted Purchase Index increased 5 percent compared with the previous week and was 7 percent lower than the same week one year ago.
“Mortgage rates increased across the board last week following the recent rise in Treasury yields, which have moved higher due to unrelenting inflationary pressures and increased market expectations of more aggressive policy moves by the Federal Reserve," said Joel Kan, MBA's Associate Vice President of Economic and Industry Forecasting. "The 30-year fixed rate saw the largest single-week increase since March 2020 and was above the 4 percent mark for the first time since 2019. Consistent with this period of higher mortgage rates, refinance applications fell 9 percent last week and stood at around half of last year’s pace. The refinance share of applications was also at its lowest level since July 2019."
Added Kan, “Purchase applications saw a modest decline over the week, with government purchase applications accounting for most of the decrease. Prospective buyers still face elevated sales prices in addition to higher mortgage rates. The heavier mix of conventional applications again contributed to another record average loan size at $453,000.
...
The average contract interest rate for 30-year fixed-rate mortgages with conforming loan balances ($647,200 or less) increased to 4.05 percent from 3.83 percent, with points increasing to 0.45 from 0.40 (including the origination fee) for 80 percent loan-to-value ratio (LTV) loans.
emphasis added
 Click on graph for larger image.
The first graph shows the refinance index since 1990.
With higher mortgage rates, the refinance index has declined sharply over the last several months.
The second graph shows the MBA mortgage purchase index
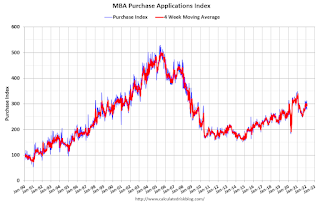 According to the MBA, purchase activity is down 7% year-over-year unadjusted.
Note: Red is a four-week average (blue is weekly).
Tuesday, February 15, 2022
Wednesday: Retail Sales, Industrial Production, Homebuilder Survey, FOMC Minutes
by Calculated Risk on 2/15/2022 07:19:00 PM
Wednesday:
• At 7:00 AM ET, The Mortgage Bankers Association (MBA) will release the results for the mortgage purchase applications index.
• At 8:30 AM, Retail sales for January is scheduled to be released. The consensus is for a 1.8% increase in retail sales. Retail sales ex-gasoline were down 2.0% in December.
• At 9:15 AM, The Fed will release Industrial Production and Capacity Utilization for January. The consensus is for a 0.4% increase in Industrial Production, and for Capacity Utilization to increase to 76.7%.
• At 10:00 AM, The February NAHB homebuilder survey. The consensus is for a reading of 82, down from 83. Any number above 50 indicates that more builders view sales conditions as good than poor.
• At 2:00 PM, FOMC Minutes, Meeting of Jan. 25-26
On COVID (focus on hospitalizations and deaths):
| COVID Metrics | ||||
|---|---|---|---|---|
| Now | Week Ago | Goal | ||
| Percent fully Vaccinated | 64.5% | --- | ≥70.0%1 | |
| Fully Vaccinated (millions) | 214.1 | --- | ≥2321 | |
| New Cases per Day3 | 146,921 | 244,558 | ≤5,0002 | |
| Hospitalized3 | 80.185 | 107,772 | ≤3,0002 | |
| Deaths per Day3 | 2,208 | 2,422 | ≤502 | |
| 1 Minimum to achieve "herd immunity" (estimated between 70% and 85%). 2my goals to stop daily posts, 37-day average for Cases, Currently Hospitalized, and Deaths 🚩 Increasing 7-day average week-over-week for Cases, Hospitalized, and Deaths ✅ Goal met. | ||||
 Click on graph for larger image.
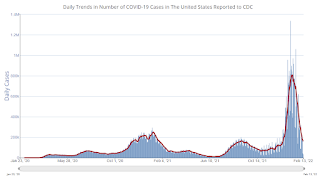
This graph shows the daily (columns) and 7-day average (line) of positive tests reported.
New cases, hospitalizations and deaths are now declining.
Boston: "Soft" Housing Sales in January due to Lack of Inventory
by Calculated Risk on 2/15/2022 11:10:00 AM
From the Greater Boston Association of REALTORS® (GBAR): Greater Boston Housing Market Feels Effects of Low Inventory, Sales Soften and Price Appreciation Slows in January
Sales of single-family homes and condominiums declined from year ago levels for a second consecutive month in January as inventory levels waned and mortgage rates rose, which compounded seasonal softening in buyer activity. ...This is a common complaint amoung agents. Inventory levels are near record lows almost everywhere.
“We’ve got very little to sell. In some communities, you can count on one or two hands the number of properties available for sale over the past month,” stated GBAR President Melvin A. Vieira, Jr., an agent at RE/MAX Destiny in Cambridge. “The appetite to buy is still quite strong, but the reality is it can be a lengthy process when there is little to choose from. The lack of listings remains the biggest drag on sales right now, but there is increasing anxiety over the rise in mortgage rates, and that’s going to affect buying power and possibly the size of the buyer pool going forward,” he noted.
The Housing Bubble and Mortgage Debt as a Percent of GDP
by Calculated Risk on 2/15/2022 09:11:00 AM
Today, in the Calculated Risk Real Estate Newsletter: The Housing Bubble and Mortgage Debt as a Percent of GDP
A brief excerpt:
In a 2005 post, I included a graph of household mortgage debt as a percent of GDP. Several readers asked if I could update the graph.There is much more in the article. You can subscribe at https://calculatedrisk.substack.com/
...
The second graph shows household mortgage debt as a percent of GDP through Q3 2021 (based on the Fed’s Flow of Funds report).
The "bubble" is pretty obvious on this graph, and the sharp increase in mortgage debt was one of the warning signs.
The blip up in Q2 2020 was related to the collapse in GDP rather than an increase in mortgage debt. With the recent house price increases, some people are worried about a new housing bubble - but mortgage debt isn't a concern and lending standards are much better now than during the bubble.

Monday, February 14, 2022
Tuesday: PPI, NY Fed Mfg
by Calculated Risk on 2/14/2022 08:12:00 PM
From Matthew Graham at Mortgage News Daily: Rates Jump Back Up to The Highs
Russia/Ukraine headlines continued throughout the day. Although this did cause some volatility at times, markets progressively tuned out. Moreover, geopolitical risk is not destined to be the key market moving consideration unless things get appreciably worse. Even then, the primary narrative remains focused on inflation and the Fed's evolving policy response. [30 year fixed 4.10%]Tuesday:
emphasis added
• At 8:30 AM ET, The Producer Price Index for December from the BLS. The consensus is for a 0.5% increase in PPI, and a 0.5% increase in core PPI.
• Also, at 8:30 AM: The New York Fed Empire State manufacturing survey for February. The consensus is for a reading of 12.0, up from -0.7.
On COVID (focus on hospitalizations and deaths):
| COVID Metrics | ||||
|---|---|---|---|---|
| Now | Week Ago | Goal | ||
| Percent fully Vaccinated | 64.4% | --- | ≥70.0%1 | |
| Fully Vaccinated (millions) | 214.0 | --- | ≥2321 | |
| New Cases per Day3 | 161,197 | 287,209 | ≤5,0002 | |
| Hospitalized3 | 81,007 | 111,402 | ≤3,0002 | |
| Deaths per Day3 | 2,196 | 2,339 | ≤502 | |
| 1 Minimum to achieve "herd immunity" (estimated between 70% and 85%). 2my goals to stop daily posts, 37-day average for Cases, Currently Hospitalized, and Deaths 🚩 Increasing 7-day average week-over-week for Cases, Hospitalized, and Deaths ✅ Goal met. | ||||
 Click on graph for larger image.
This graph shows the daily (columns) and 7-day average (line) of positive tests reported.
New cases, hospitalizations and deaths are now declining.
Second Home Market: South Lake Tahoe in January
by Calculated Risk on 2/14/2022 04:15:00 PM
With the pandemic, there was a surge in 2nd home buying.
I'm looking at data for some second home markets - and I'm tracking those markets to see if there is an impact from the lending changes.
This graph is for South Lake Tahoe since 2004 through January 2022, and shows inventory (blue), and the year-over-year (YoY) change in the median price (12-month average).
Note: The median price is distorted by the mix, but this is the available data.
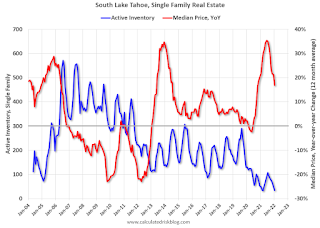
Following the housing bubble, prices declined for several years in South Lake Tahoe, with the median price falling about 50% from the bubble peak.
Currently inventory is still very low - just above the record low set in March 2021, and down YoY - and prices are up sharply YoY (but the YoY change has been trending down).
This will be interesting to watch, but so far there isn't any evidence of a 2nd home slowdown in these numbers.
A Few Comments on Inflation
by Calculated Risk on 2/14/2022 12:45:00 PM
With CPI inflation coming in at 7.5% year-over-year in January (YoY), and core CPI at 6.0% YoY - both the highest since 1982 - the FOMC is now expected to raise rates a number of times in 2022.
Last week, Goldman Sachs economists wrote:
“Following this morning’s strong CPI print, we are raising our Fed forecast to include seven consecutive 25bp rate hikes at each of the remaining FOMC meetings in 2022 (vs. five hikes in 2022 previously).”And Merrill Lynch economists noted:
emphasis added
"For the Fed, this report provides another wake-up call. Inflation is here and it continues to make its presence known everywhere. We remain comfortable with our hawkish call for the Fed to hike seven times this year ..."This is a significant outlook change from just a few months ago.
The FOMC will likely announce a rate hike at the March meeting, and perhaps even raise rates by 50bps (some analysts think the FOMC might announce an emergency hike before the FOMC meeting).
 Click on graph for larger image.
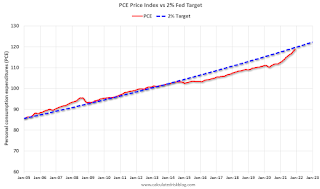
This graph is from January 2005 (just an arbitrary date) through December 2022.
This shows that inflation had been below target for years. If we were doing price targeting (we aren't), then prices would just be getting back to the target.
The second graph is for core PCE inflation shows the same pattern, but core PCE is even further below the trend line.
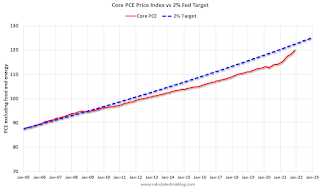 The question is not will some prices "stick", but rather will YoY inflation ease back towards the Fed's target? Or will inflation stay elevated?
My sense is once the pandemic slows significantly; inflation will ease back towards the Fed's target.
Of course, the pandemic is still contributing significantly to the surge in inflation (supply constraints, labor shortages, shift in buying patterns), and the FOMC cannot control the pandemic.
Housing Inventory February 14th Update: Inventory Down 2.5% Week-over-week; New Record Low
by Calculated Risk on 2/14/2022 10:02:00 AM
Tracking existing home inventory is very important in 2022.
Inventory usually declines in the winter, and this is a new record low for this series.
This inventory graph is courtesy of Altos Research.
As of February 11th, inventory was at 250 thousand (7-day average), compared to 344 thousand for the same week a year ago. That is a decline of 27.5%.
A week ago, inventory was at 256 thousand, and was down 27.9% YoY.
Inventory was down 5.9% from the previous week.
Compared to the same week in 2020, inventory is down 65.7% from 727 thousand.
Last year, seasonally, inventory bottomed in April 2021 - very late in the year - usually inventory bottoms by February. An early key in 2022 will be to watch if inventory bottoms earlier this year.
Mike Simonsen discusses this data regularly on Youtube.
Six High Frequency Indicators for the Economy
by Calculated Risk on 2/14/2022 08:57:00 AM
These indicators are mostly for travel and entertainment. It is interesting to watch these sectors recover as the pandemic subsides.
There was a clear negative impact from the omicron variant of COVID that is starting to ease.
----- Airlines: Transportation Security Administration -----
The TSA is providing daily travel numbers.
This data is as of February 13th.
 Click on graph for larger image.
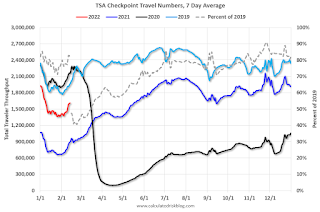
This data shows the 7-day average of daily total traveler throughput from the TSA for 2019 (Light Blue), 2020 (Black), 2021 (Blue) and 2022 (Red).
The dashed line is the percent of 2019 for the seven-day average.
The 7-day average is down 18.1% from the same day in 2019 (81.9% of 2019). (Dashed line)
----- Restaurants: OpenTable -----
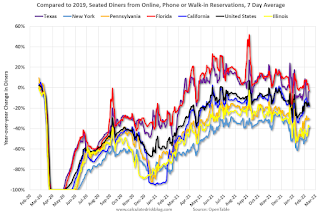
The second graph shows the 7-day average of the year-over-year change in diners as tabulated by OpenTable for the US and several selected cities.
----- Movie Tickets: Box Office Mojo -----
 This data shows domestic box office for each week and the median for the years 2016 through 2019 (dashed light blue).
----- Hotel Occupancy: STR -----
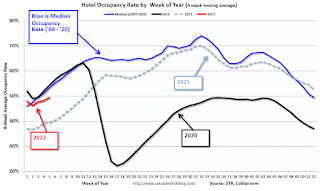 This graph shows the seasonal pattern for the hotel occupancy rate using the four-week average.
The red line is for 2022, black is 2020, blue is the median, and dashed light blue is for 2021.
This data is through February 5th. The occupancy rate was down 15.8% compared to the same week in 2019.
----- Transit: Apple Mobility -----
This graph is from Apple mobility. From Apple: "This data is generated by counting the number of requests made to Apple Maps for directions in select countries/regions, sub-regions, and cities." This is just a general guide - people that regularly commute probably don't ask for directions.
 This data is through February 10th
----- New York City Subway Usage -----
Here is some interesting data on New York subway usage (HT BR).
 This graph is from Todd W Schneider.
This data is through Friday, February 11th.
He notes: "Data updates weekly from the MTA’s public turnstile data, usually on Saturday mornings".
The TSA is providing daily travel numbers.
This data is as of February 13th.
Click on graph for larger image.This data shows the 7-day average of daily total traveler throughput from the TSA for 2019 (Light Blue), 2020 (Black), 2021 (Blue) and 2022 (Red).
The dashed line is the percent of 2019 for the seven-day average.
The 7-day average is down 18.1% from the same day in 2019 (81.9% of 2019). (Dashed line)
Air travel had been off about 20% relative to 2019 for most of the second half of 2021 (with some ups and downs) - but picked up over the Thanksgiving and Christmas holidays (solid leisure travel) - and has declined in early 2022 (omicron / weak business travel).
The second graph shows the 7-day average of the year-over-year change in diners as tabulated by OpenTable for the US and several selected cities.
IMPORTANT: OpenTable notes: "we’ve updated the data including downloadable dataset from January 1, 2021, onward to compare seated diners from 2021 to 2019, as opposed to year over year." Thanks!
 Thanks to OpenTable for providing this restaurant data:
This data is updated through February 12, 2022.
This data is "a sample of restaurants on the OpenTable network across all channels: online reservations, phone reservations, and walk-ins. For year-over-year comparisons by day, we compare to the same day of the week from the same week in the previous year."
Dining was mostly moving sideways but declined during the winter wave of COVID and is now increasing. The 7-day average for the US is down 17% compared to 2019.
Thanks to OpenTable for providing this restaurant data:This data is updated through February 12, 2022.
This data is "a sample of restaurants on the OpenTable network across all channels: online reservations, phone reservations, and walk-ins. For year-over-year comparisons by day, we compare to the same day of the week from the same week in the previous year."
Dining was mostly moving sideways but declined during the winter wave of COVID and is now increasing. The 7-day average for the US is down 17% compared to 2019.
This data shows domestic box office for each week and the median for the years 2016 through 2019 (dashed light blue). Black is 2020, Blue is 2021 and Red is 2022.
The data is from BoxOfficeMojo through February 10th.
Note that the data is usually noisy week-to-week and depends on when blockbusters are released.
Movie ticket sales were at $77 million last week, down about 41% from the median for the week.
Note that the data is usually noisy week-to-week and depends on when blockbusters are released.
Movie ticket sales were at $77 million last week, down about 41% from the median for the week.
This graph shows the seasonal pattern for the hotel occupancy rate using the four-week average. The red line is for 2022, black is 2020, blue is the median, and dashed light blue is for 2021.
This data is through February 5th. The occupancy rate was down 15.8% compared to the same week in 2019.
The 4-week average of the occupancy rate is below the median rate for the previous 20 years (Blue).
Notes: Y-axis doesn't start at zero to better show the seasonal change.
Notes: Y-axis doesn't start at zero to better show the seasonal change.
The 4-week average of the occupancy rate will increase seasonally over the next few months. The key question is: How much business travel will return?
This graph is from Apple mobility. From Apple: "This data is generated by counting the number of requests made to Apple Maps for directions in select countries/regions, sub-regions, and cities." This is just a general guide - people that regularly commute probably don't ask for directions.
This data is through February 10th for the United States and several selected cities.
The graph is the running 7-day average to remove the impact of weekends.
IMPORTANT: All data is relative to January 13, 2020. This data is NOT Seasonally Adjusted. People walk and drive more when the weather is nice, so I'm just using the transit data.
According to the Apple data directions requests, public transit in the 7-day average for the US is at 105% of the January 2020 level.
Here is some interesting data on New York subway usage (HT BR).
This graph is from Todd W Schneider. This graph shows how much MTA traffic has recovered in each borough (Graph starts at first week in January 2020 and 100 = 2019 average).
Manhattan is at about 35% of normal.
This data is through Friday, February 11th.
He notes: "Data updates weekly from the MTA’s public turnstile data, usually on Saturday mornings".
Sunday, February 13, 2022
Sunday Night Futures
by Calculated Risk on 2/13/2022 06:10:00 PM
Weekend:
• Schedule for Week of February 13, 2022
Monday:
• No major economic releases scheduled.
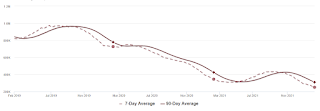
From CNBC: Pre-Market Data and Bloomberg futures S&P 500 and DOW futures are mostly unchanged (fair value).
Oil prices were up over the last week with WTI futures at $93.10 per barrel and Brent at $94.44 per barrel. A year ago, WTI was at $60, and Brent was at $63 - so WTI oil prices are up about 50% year-over-year.
Here is a graph from Gasbuddy.com for nationwide gasoline prices. Nationally prices are at $3.47 per gallon. A year ago prices were at $2.50 per gallon, so gasoline prices are up $0.97 per gallon year-over-year.


