 RSS Feed
 by Calculated Risk on 2/17/2022 01:02:00 PM
Thursday, February 17, 2022
January Housing Starts: Most Housing Units Under Construction Since 1973
Today, in the CalculatedRisk Real Estate Newsletter: January Housing Starts: Most Housing Units Under Construction Since 1973
Excerpt:
The fourth graph shows housing starts under construction, Seasonally Adjusted (SA).There is much more in the post. You can subscribe at https://calculatedrisk.substack.com/ (Most content is available for free, so please subscribe).
Red is single family units. Currently there are 785 thousand single family units under construction (SA). This is the highest level since December 2006.
For single family, many of these homes are already sold (Census counts sales when contract is signed). The reason there are so many homes is probably due to construction delays. Since many of these are already sold, it is unlikely this is “overbuilding”, or that this will impact prices (although the buyers will be moving out of their current home or apartment once these homes are completed).
Blue is for 2+ units. Currently there are 758 thousand multi-family units under construction. This is the highest level since July 1974! For multi-family, construction delays are probably also a factor. The completion of these units should help with rent pressure.
Census will release data in March (part of February survey) on the length of time from start to completion, and that will probably show long delays in 2021. In 2020, it took an average of 6.8 months from start to completion for single family homes, and 15.4 months for buildings with 2 or more units.
Combined, there are 1.543 million units under construction. This is the most since September 1973.
Weekly Initial Unemployment Claims Increase to 248,000
by Calculated Risk on 2/17/2022 10:30:00 AM
The DOL reported:
In the week ending February 12, the advance figure for seasonally adjusted initial claims was 248,000, an increase of 23,000 from the previous week's revised level. The previous week's level was revised up by 2,000 from 223,000 to 225,000. The 4-week moving average was 243,250, a decrease of 10,500 from the previous week's revised average. The previous week's average was revised up by 500 from 253,250 to 253,750.The following graph shows the 4-week moving average of weekly claims since 1971.
emphasis added
 Click on graph for larger image.
The dashed line on the graph is the current 4-week average. The four-week average of weekly unemployment claims decreased to 243,250.
The previous week was revised up.
Weekly claims were higher than the consensus forecast.
Housing Starts Decreased to 1.638 million Annual Rate in January
by Calculated Risk on 2/17/2022 08:37:00 AM
From the Census Bureau: Permits, Starts and Completions
Housing Starts:
Privately‐owned housing starts in January were at a seasonally adjusted annual rate of 1,638,000. This is 4.1 percent below the revised December estimate of 1,708,000, but is 0.8 percent above the January 2021 rate of 1,625,000. Single‐family housing starts in January were at a rate of 1,116,000; this is 5.6 percent below the revised December figure of 1,182,000. The January rate for units in buildings with five units or more was 510,000.
Building Permits:
Privately‐owned housing units authorized by building permits in January were at a seasonally adjusted annual rate of 1,899,000. This is 0.7 percent above the revised December rate of 1,885,000 and is 0.8 percent above the January 2021 rate of 1,883,000. Single‐family authorizations in January were at a rate of 1,205,000; this is 6.8 percent above the revised December figure of 1,128,000. Authorizations of units in buildings with five units or more were at a rate of 629,000 in January.
emphasis added
 Click on graph for larger image.
The first graph shows single and multi-family housing starts for the last several years.
Multi-family starts (blue, 2+ units) decreased in January compared to December. Multi-family starts were up 8.3% year-over-year in January.
Single-family starts (red) decreased in January and were down 2.4% year-over-year.
 The second graph shows single and multi-family housing starts since 1968.
 This shows the huge collapse following the housing bubble, and then the eventual recovery (but still not historically high).
Total housing starts in January were below expectations, however, starts in November and December were revised up, combined.
I'll have more later …
Wednesday, February 16, 2022
Thursday: Housing Starts, Unemployment Claims, Philly Fed Mfg
by Calculated Risk on 2/16/2022 08:39:00 PM
Thursday:
• At 8:30 AM ET, the initial weekly unemployment claims report will be released. The consensus is for a decrease to 222 thousand from 223 thousand last week.
• Also, at 8:30 AM, Housing Starts for January. The consensus is for 1.700 million SAAR, down from 1.702 million SAAR.
• Also, at 8:30 AM, the Philly Fed manufacturing survey for February. The consensus is for a reading of 20.0, down from 23.2.
On COVID (focus on hospitalizations and deaths):
| COVID Metrics | ||||
|---|---|---|---|---|
| Now | Week Ago | Goal | ||
| Percent fully Vaccinated | 64.5% | --- | ≥70.0%1 | |
| Fully Vaccinated (millions) | 214.2 | --- | ≥2321 | |
| New Cases per Day3 | 134,468 | 229,428 | ≤5,0002 | |
| Hospitalized3 | 80,185 | 107,772 | ≤3,0002 | |
| Deaths per Day3 | 2,100 | 2,331 | ≤502 | |
| 1 Minimum to achieve "herd immunity" (estimated between 70% and 85%). 2my goals to stop daily posts, 37-day average for Cases, Currently Hospitalized, and Deaths 🚩 Increasing 7-day average week-over-week for Cases, Hospitalized, and Deaths ✅ Goal met. | ||||
 Click on graph for larger image.
This graph shows the daily (columns) and 7-day average (line) of deaths reported.
New cases, hospitalizations and deaths are now declining.
Fannie and Freddie: REO inventory declined in Q4 year-over-year; Expected to increase in 2022
by Calculated Risk on 2/16/2022 04:59:00 PM
Fannie and Freddie earlier reported results for Q4 2021. Here is some information on single-family Real Estate Owned (REOs).
Here is a note on the pandemic impact on foreclosures, from Fannie:
"In response to the pandemic and with instruction from FHFA, we prohibited our servicers from completing foreclosures on our single-family loans through July 31, 2021, except in the case of vacant or abandoned properties. In addition, as described in “Single-Family Acquisition and Servicing Policies and Underwriting and Servicing Standards—COVID-19 Servicing Policies,” our servicers were required to comply with a CFPB rule that prohibited certain new single-family foreclosures on mortgage loans secured by the borrower’s principal residence until after December 31, 2021. As a result, foreclosure volumes were lower through 2021 and 2020 compared with pre-pandemic levels. We expect foreclosure volumes to gradually increase in 2022." emphasis added
Freddie Mac reported the number of REO declined to 1,615 at the end of Q4 2021 compared to 1,766 at the end of Q4 2020.
For Freddie, this is down 98% from the 74,897 peak number of REOs in Q3 2010.
Fannie Mae reported the number of REO declined to 7,166 at the end of Q4 2021 compared to 7,973 at the end of Q4 2020.
For Fannie, this is down 96% from the 166,787 peak number of REOs in Q3 2010.
 Click on graph for larger image.
Here is a graph of Fannie and Freddie Real Estate Owned (REO).
REO inventory decreased in Q4 2021, and combined inventory is down 10% year-over-year.
This is well below a normal level of REOs for Fannie and Freddie, and REO levels will increase in 2022.
For Freddie, this is down 98% from the 74,897 peak number of REOs in Q3 2010.
Fannie Mae reported the number of REO declined to 7,166 at the end of Q4 2021 compared to 7,973 at the end of Q4 2020.
For Fannie, this is down 96% from the 166,787 peak number of REOs in Q3 2010.
Click on graph for larger image.Here is a graph of Fannie and Freddie Real Estate Owned (REO).
REO inventory decreased in Q4 2021, and combined inventory is down 10% year-over-year.
This is well below a normal level of REOs for Fannie and Freddie, and REO levels will increase in 2022.
FOMC Minutes: "Faster" is the Word
by Calculated Risk on 2/16/2022 02:13:00 PM
From the Fed: Minutes of the Federal Open Market Committee, January 25-26, 2022. Excerpt on inflation:
In light of elevated inflation pressures and the strong labor market, participants continued to judge that the Committee's net asset purchases should be concluded soon. Most participants preferred to continue to reduce the Committee's net asset purchases according to the schedule announced in December, bringing them to an end in early March. A couple of participants stated that they favored ending the Committee's net asset purchases sooner to send an even stronger signal that the Committee was committed to bringing down inflation.
Participants discussed the implications of the economic outlook for the likely timing and pace for removing policy accommodation. Compared with conditions in 2015 when the Committee last began a process of removing monetary policy accommodation, participants viewed that there was a much stronger outlook for growth in economic activity, substantially higher inflation, and a notably tighter labor market. Consequently, most participants suggested that a faster pace of increases in the target range for the federal funds rate than in the post-2015 period would likely be warranted, should the economy evolve generally in line with the Committee's expectation. Even so, participants emphasized that the appropriate path of policy would depend on economic and financial developments and their implications for the outlook and the risks around the outlook, and they will be updating their assessments of the appropriate setting for the policy stance at each meeting. Participants noted that the removal of policy accommodation in current circumstances depended on the timing and pace of both increases in the target range of the federal funds rate and the reduction in the size of the Federal Reserve's balance sheet. In this context, a number of participants commented that conditions would likely warrant beginning to reduce the size of the balance sheet sometime later this year.
In their discussion of the outlook for monetary policy, many participants noted the influence on financial conditions of the Committee's recent communications and viewed these communications as helpful in shifting private-sector expectations regarding the policy outlook into better alignment with the Committee's assessment of appropriate policy. Participants continued to stress that maintaining flexibility to implement appropriate policy adjustments on the basis of risk-management considerations should be a guiding principle in conducting policy in the current highly uncertain environment. Most participants noted that, if inflation does not move down as they expect, it would be appropriate for the Committee to remove policy accommodation at a faster pace than they currently anticipate. Some participants commented on the risk that financial conditions might tighten unduly in response to a rapid removal of policy accommodation. A few participants remarked that this risk could be mitigated through clear and effective communication of the Committee's assessments of the economic outlook, the risks around the outlook, and the appropriate path for monetary policy.
emphasis added
Thoughts on Housing Supply and Demand With 30-year mortgage rates above 4%
by Calculated Risk on 2/16/2022 11:55:00 AM
Today, in the Calculated Risk Real Estate Newsletter: Thoughts on Housing Supply and Demand With 30-year mortgage rates above 4%
A brief excerpt:
So far, there has been no obvious impact on demand from 30-year mortgage rates above 4%.There is much more in the article. You can subscribe at https://calculatedrisk.substack.com/
...
I’ve spoken to several mortgage brokers over the last few days, and they are reporting purchase demand remains strong. They did mention a decline in refinance activity due to higher rates, and several brokers mentioned appraisals are falling short - and buyers are having to fill the “appraisal gap”.
Other measures of demand - like the MBA purchase index - have weakened a little - but are still showing solid purchase demand
...
Meanwhile, homebuilders are struggling with both price increases and supply constraints. The most recent new home sales report showed that the Inventory of homes under construction highest since 2007 and the most recent housing starts report showed Most Housing Units Under Construction Since 1973
NAHB: Builder Confidence Decreased to 82 in February
by Calculated Risk on 2/16/2022 10:09:00 AM
The National Association of Home Builders (NAHB) reported the housing market index (HMI) was at 82, down from 83 in January. Any number above 50 indicates that more builders view sales conditions as good than poor.
From the NAHB: Builder Confidence Eases on Supply-Side Constraints
Despite strong buyer demand, builder sentiment continued to slip in February as the industry grapples with ongoing building material production bottlenecks that are raising construction costs and delaying projects.
Builder confidence in the market for newly built single-family homes moved one point lower to 82 in February, marking the second straight month that confidence levels have declined by a single point, according to the NAHB/Wells Fargo Housing Market Index (HMI) released today. Despite these monthly declines, the HMI has posted very solid readings at or above the 80-point mark for the past five months.
“Production disruptions are so severe that many builders are waiting months to receive cabinets, garage doors, countertops and appliances,” said NAHB Chairman Jerry Konter. “These delivery delays are raising construction costs and pricing prospective buyers out of the market. Policymakers must make it a priority to address supply chain issues that are harming housing affordability.”
“Residential construction costs are up 21% on a year over year basis, and these higher development costs have hit first-time buyers particularly hard,” said NAHB Chief Economist Robert Dietz. “Higher interest rates in 2022 will further reduce housing affordability even as demand remains solid due to a lack of resale inventory.”
...
The HMI index gauging current sales conditions increased one point to 90, the gauge measuring sales expectations in the next six months fell two points to 80, and the component charting traffic of prospective buyers posted a four-point decline to 65.
Looking at the three-month moving averages for regional HMI scores, the Northeast increased three points to 76, the West rose one point to 89, the Midwest fell one point to 73 and the South edged one point lower to 86.
emphasis added
 Click on graph for larger image.
This graph shows the NAHB index since Jan 1985.
This was at the consensus forecast, and a strong reading.
Industrial Production Increased 1.4 Percent in January
by Calculated Risk on 2/16/2022 09:21:00 AM
From the Fed: Industrial Production and Capacity Utilization
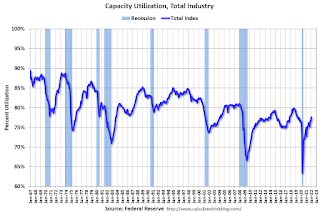
In January, total industrial production increased 1.4 percent. Manufacturing output and mining production rose 0.2 percent and 1.0 percent, respectively. The index for utilities jumped 9.9 percent; after being held down in December by unusually mild weather, the demand for heating surged in January with the arrival of significantly colder-than-normal temperatures. At 103.5 percent of its 2017 average, total industrial production in January was 4.1 percent higher than its year-earlier level and 2.1 percent above its pre-pandemic (February 2020) reading. Capacity utilization for the industrial sector increased 1.0 percentage point in January to 77.6 percent, a rate that is 1.9 percentage points below its long-run (1972–2021) average.
emphasis added
 Click on graph for larger image.
This graph shows Capacity Utilization. This series is up from the record low set in April 2020, and above the level in February 2020 (pre-pandemic).
Capacity utilization at 77.6% is 1.9% below the average from 1972 to 2020. This was above consensus expectations.
Note: y-axis doesn't start at zero to better show the change.
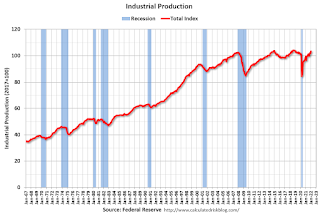 The second graph shows industrial production since 1967.
Industrial production increased in January to 103.5. This is above the February 2020 level.
The change in industrial production was above consensus expectations.
Retail Sales Increased 3.8% in January
by Calculated Risk on 2/16/2022 08:38:00 AM
On a monthly basis, retail sales were increased 3.8% from December to January (seasonally adjusted), and sales were up 13.0 percent from January 2021.
From the Census Bureau report:
Advance estimates of U.S. retail and food services sales for January 2022, adjusted for seasonal variation and holiday and trading-day differences, but not for price changes, were $649.8 billion, an increase of 3.8 percent from the previous month, and 13.0 percent above January 2021.
emphasis added
 Click on graph for larger image.
This graph shows retail sales since 1992. This is monthly retail sales and food service, seasonally adjusted (total and ex-gasoline).
Retail sales ex-gasoline were up 4.2% in January.
The second graph shows the year-over-year change in retail sales and food service (ex-gasoline) since 1993.
 Retail and Food service sales, ex-gasoline, increased by 11.2% on a YoY basis.
Sales in January were well above expectations, and sales in November and December were revised up, combined.


