 RSS Feed
 by Calculated Risk on 2/21/2022 08:50:00 AM
Monday, February 21, 2022
Six High Frequency Indicators for the Economy
These indicators are mostly for travel and entertainment. It is interesting to watch these sectors recover as the pandemic subsides.
There was a clear negative impact from the omicron variant of COVID that is starting to ease.
----- Airlines: Transportation Security Administration -----
The TSA is providing daily travel numbers.
This data is as of February 19th.
 Click on graph for larger image.
This data shows the 7-day average of daily total traveler throughput from the TSA for 2019 (Light Blue), 2020 (Black), 2021 (Blue) and 2022 (Red).
The dashed line is the percent of 2019 for the seven-day average.
The 7-day average is down 17.0% from the same day in 2019 (83.0% of 2019). (Dashed line)
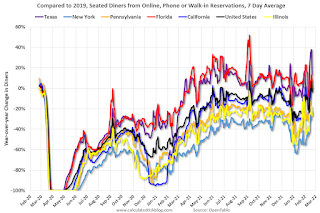
----- Restaurants: OpenTable -----
The second graph shows the 7-day average of the year-over-year change in diners as tabulated by OpenTable for the US and several selected cities.
----- Movie Tickets: Box Office Mojo -----
 This data shows domestic box office for each week and the median for the years 2016 through 2019 (dashed light blue).
----- Hotel Occupancy: STR -----
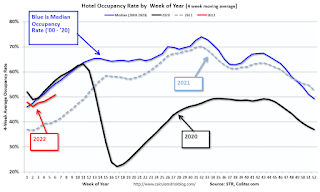 This graph shows the seasonal pattern for the hotel occupancy rate using the four-week average.
The red line is for 2022, black is 2020, blue is the median, and dashed light blue is for 2021.
This data is through February 12th. The occupancy rate was down 14.0% compared to the same week in 2019.
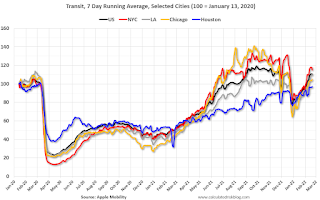
----- Transit: Apple Mobility -----
This graph is from Apple mobility. From Apple: "This data is generated by counting the number of requests made to Apple Maps for directions in select countries/regions, sub-regions, and cities." This is just a general guide - people that regularly commute probably don't ask for directions.
 This data is through February 19th
----- New York City Subway Usage -----
Here is some interesting data on New York subway usage (HT BR).
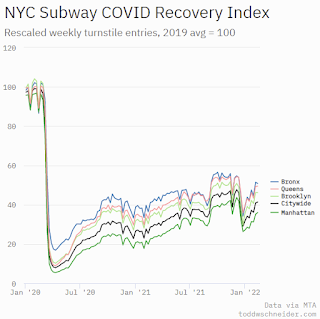 This graph is from Todd W Schneider.
This data is through Friday, February 18th.
He notes: "Data updates weekly from the MTA’s public turnstile data, usually on Saturday mornings".
The TSA is providing daily travel numbers.
This data is as of February 19th.
Click on graph for larger image.This data shows the 7-day average of daily total traveler throughput from the TSA for 2019 (Light Blue), 2020 (Black), 2021 (Blue) and 2022 (Red).
The dashed line is the percent of 2019 for the seven-day average.
The 7-day average is down 17.0% from the same day in 2019 (83.0% of 2019). (Dashed line)
Air travel declined in early 2022 (omicron / weak business travel) but appears to be picking up (both seasonally and less COVID).
The second graph shows the 7-day average of the year-over-year change in diners as tabulated by OpenTable for the US and several selected cities.
IMPORTANT: OpenTable notes that all data is compared to 2019. Thanks!
 Thanks to OpenTable for providing this restaurant data:
This data is updated through February 19, 2022.
This data is "a sample of restaurants on the OpenTable network across all channels: online reservations, phone reservations, and walk-ins. For year-over-year comparisons by day, we compare to the same day of the week from the same week in the previous year."
Dining was mostly moving sideways but declined during the winter wave of COVID and is now increasing. The 7-day average for the US is down 3% compared to 2019.
Thanks to OpenTable for providing this restaurant data:This data is updated through February 19, 2022.
This data is "a sample of restaurants on the OpenTable network across all channels: online reservations, phone reservations, and walk-ins. For year-over-year comparisons by day, we compare to the same day of the week from the same week in the previous year."
Dining was mostly moving sideways but declined during the winter wave of COVID and is now increasing. The 7-day average for the US is down 3% compared to 2019.
This data shows domestic box office for each week and the median for the years 2016 through 2019 (dashed light blue). Black is 2020, Blue is 2021 and Red is 2022.
The data is from BoxOfficeMojo through February 17th.
Note that the data is usually noisy week-to-week and depends on when blockbusters are released.
Movie ticket sales were at $81 million last week, down about 57% from the median for the week.
Note that the data is usually noisy week-to-week and depends on when blockbusters are released.
Movie ticket sales were at $81 million last week, down about 57% from the median for the week.
This graph shows the seasonal pattern for the hotel occupancy rate using the four-week average. The red line is for 2022, black is 2020, blue is the median, and dashed light blue is for 2021.
This data is through February 12th. The occupancy rate was down 14.0% compared to the same week in 2019.
The 4-week average of the occupancy rate is below the median rate for the previous 20 years (Blue).
Notes: Y-axis doesn't start at zero to better show the seasonal change.
Notes: Y-axis doesn't start at zero to better show the seasonal change.
The 4-week average of the occupancy rate will increase seasonally over the next few months. The key question is: How much business travel will return?
This graph is from Apple mobility. From Apple: "This data is generated by counting the number of requests made to Apple Maps for directions in select countries/regions, sub-regions, and cities." This is just a general guide - people that regularly commute probably don't ask for directions.
This data is through February 19th for the United States and several selected cities.
The graph is the running 7-day average to remove the impact of weekends.
IMPORTANT: All data is relative to January 13, 2020. This data is NOT Seasonally Adjusted. People walk and drive more when the weather is nice, so I'm just using the transit data.
According to the Apple data directions requests, public transit in the 7-day average for the US is at 110% of the January 2020 level.
Here is some interesting data on New York subway usage (HT BR).
This graph is from Todd W Schneider. This graph shows how much MTA traffic has recovered in each borough (Graph starts at first week in January 2020 and 100 = 2019 average).
Manhattan is at about 36% of normal.
This data is through Friday, February 18th.
He notes: "Data updates weekly from the MTA’s public turnstile data, usually on Saturday mornings".
Sunday, February 20, 2022
Quarterly Starts by Purpose and Design: "Built for rent" Increasing
by Calculated Risk on 2/20/2022 10:05:00 AM
Along with the monthly housing starts for January last week, the Census Bureau released Housing Units Started by Purpose and Design through Q4 2021.
This graph shows the NSA quarterly intent for four start categories since 1975: single family built for sale, owner built (includes contractor built for owner), starts built for rent, and condos built for sale.

Single family starts built for sale (red) were down 9% in Q4 2021 compared to Q4 2020.
Owner built starts (orange) were up 11% year-over-year.
Condos built for sale increased and are still low.
The 'units built for rent' (blue) and were up 35% in Q4 2021 compared to Q4 2020.
The recent housing boom had been mostly in single family homes 'built for sale', but 'built for rent' has been picking up.
Saturday, February 19, 2022
Real Estate Newsletter Articles this Week
by Calculated Risk on 2/19/2022 02:11:00 PM
At the Calculated Risk Real Estate Newsletter this week:
• Existing-Home Sales Increased to 6.50 million in January
• January Forecast and 4th Look at Local Housing Markets Lawler forecast, Adding Austin, Boston, California, Colorado, Des Moines, Minneapolis, Rhode Island and Washington, D.C.
• January Housing Starts: Most Housing Units Under Construction Since 1973 Housing Starts Decreased to 1.638 million Annual Rate in January
• Thoughts on Housing Supply and Demand With 30-year mortgage rates above 4%
• The Housing Bubble and Mortgage Debt as a Percent of GDP
• 3rd Look at Local Housing Markets in January Adding Albuquerque, Atlanta, Colorado, Georgia, Jacksonville, Minnesota, Sacramento, Santa Clara and South Carolina
This is usually published several times a week, and provides more in-depth analysis of the housing market.
The blog will continue as always!
You can subscribe at https://calculatedrisk.substack.com/ Most content is available for free, but please subscribe!.
You can subscribe at https://calculatedrisk.substack.com/ Most content is available for free, but please subscribe!.
Schedule for Week of February 20, 2022
by Calculated Risk on 2/19/2022 08:11:00 AM
The key reports this week are January New Home sales and the second estimate of Q4 GDP.
Other key reports include Case-Shiller house prices and Personal Income and Outlays for January.
For manufacturing, the February Richmond and Kansas City manufacturing surveys will be released.
All US markets will be closed in observance of Washington's Birthday.
9:00 AM: FHFA House Price Index for December 2021. This was originally a GSE only repeat sales, however there is also an expanded index.
 9:00 AM: S&P/Case-Shiller House Price Index for December.
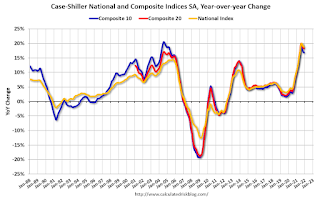
This graph shows the year-over-year change for the Case-Shiller National, Composite 10 and Composite 20 indexes, through the most recent report (the Composite 20 was started in January 2000).
The consensus is for a 18.2% year-over-year increase in the Comp 20 index for December.
10:00 AM: Richmond Fed Survey of Manufacturing Activity for February.
7:00 AM ET: The Mortgage Bankers Association (MBA) will release the results for the mortgage purchase applications index.
During the day: The AIA's Architecture Billings Index for January (a leading indicator for commercial real estate).
8:30 AM: The initial weekly unemployment claims report will be released. The consensus is for a decrease to 240 thousand from 248 thousand last week.
8:30 AM: Gross Domestic Product, 4th quarter 2021 (Second estimate). The consensus is that real GDP increased 7.0% annualized in Q4, up from the advance estimate of 6.9%.
8:30 AM ET: Chicago Fed National Activity Index for January. This is a composite index of other data.
 10:00 AM: New Home Sales for January from the Census Bureau.
 This graph shows New Home Sales since 1963.
The dashed line is the sales rate for last month.
The consensus is that new home sales decreased to 807 thousand SAAR, down from 811 thousand in December.
11:00 AM: the Kansas City Fed manufacturing survey for February.
----- Friday, February 25th -----
8:30 AM ET: Personal Income and Outlays for January. The consensus is for a 0.3% decrease in personal income, and for a 1.5% increase in personal spending. And for the Core PCE price index to increase 0.5%.
8:30 AM: Durable Goods Orders for January from the Census Bureau. The consensus is for a 0.7% increase in durable goods orders.
10:00 AM: Pending Home Sales Index for January. The consensus is for a 0.5% increase in the index.
10:00 AM: University of Michigan's Consumer sentiment index (Final for February). The consensus is for a reading of 61.7.
11:00 AM: the Kansas City Fed manufacturing survey for February.
8:30 AM ET: Personal Income and Outlays for January. The consensus is for a 0.3% decrease in personal income, and for a 1.5% increase in personal spending. And for the Core PCE price index to increase 0.5%.
8:30 AM: Durable Goods Orders for January from the Census Bureau. The consensus is for a 0.7% increase in durable goods orders.
10:00 AM: Pending Home Sales Index for January. The consensus is for a 0.5% increase in the index.
10:00 AM: University of Michigan's Consumer sentiment index (Final for February). The consensus is for a reading of 61.7.
Friday, February 18, 2022
COVID Update: February 18, 2022: Falling Cases, Deaths and Hospitalizations
by Calculated Risk on 2/18/2022 08:45:00 PM
On COVID (focus on hospitalizations and deaths):
| COVID Metrics | ||||
|---|---|---|---|---|
| Now | Week Ago | Goal | ||
| Percent fully Vaccinated | 64.6% | --- | ≥70.0%1 | |
| Fully Vaccinated (millions) | 214.6 | --- | ≥2321 | |
| New Cases per Day3 | 112,653 | 188,440 | ≤5,0002 | |
| Hospitalized3 | 80,185 | 107,772 | ≤3,0002 | |
| Deaths per Day3 | 1,998 | 2,344 | ≤502 | |
| 1 Minimum to achieve "herd immunity" (estimated between 70% and 85%). 2my goals to stop daily posts, 37-day average for Cases, Currently Hospitalized, and Deaths 🚩 Increasing 7-day average week-over-week for Cases, Hospitalized, and Deaths ✅ Goal met. | ||||
 Click on graph for larger image.
This graph shows the daily (columns) and 7-day average (line) of deaths reported.
New cases, hospitalizations and deaths are now declining.
Note: Hospitalizations have not been updated for a few days and are probably lower than in the table.
Hotels: Occupancy Rate Down 14% Compared to Same Week in 2019
by Calculated Risk on 2/18/2022 03:09:00 PM
U.S. weekly hotel performance advanced to its highest levels since December, according to STR‘s latest data through Feb. 12.The following graph shows the seasonal pattern for the hotel occupancy rate using the four-week average.
Feb. 6-12, 2022 (percentage change from comparable week in 2019*):
• Occupancy: 54.6% (-14.0%)
• Average daily rate (ADR): $133.72 (+1.3%)
• Revenue per available room (RevPAR): $73.00 (-12.9%)
*Due to the pandemic impact, STR is measuring recovery against comparable time periods from 2019.
emphasis added
Click on graph for larger image.The red line is for 2022, black is 2020, blue is the median, and dashed light blue is for 2021.
The 4-week average of the occupancy rate is below the median rate for the previous 20 years (Blue).
Note: Y-axis doesn't start at zero to better show the seasonal change.
The 4-week average of the occupancy rate will increase seasonally over the next few months.
Q1 GDP Forecasts: Moving Up to Around 2%
by Calculated Risk on 2/18/2022 01:45:00 PM
Here are a few early forecasts for Q1 GDP.
From BofA:
In the second release of 4Q GDP, we expect a revision upwards to 7.5% qoq saar growth from 6.9%. We are now tracking 2.5% for 1Q (prev 2.0%), following the retail sales beat [February 17 estimate]From Goldman Sachs:
emphasis added
We left our Q1 GDP tracking estimate unchanged at +2.0% (qoq ar). [February 17 estimate]And from the Altanta Fed: GDPNow
The GDPNow model estimate for real GDP growth (seasonally adjusted annual rate) in the first quarter of 2022 is 1.3 percent on February 17, down from 1.5 percent on February 16. After this morning’s housing starts report from the US Census Bureau, the nowcast of first-quarter real residential investment growth decreased from 4.7 percent to 0.3 percent. [February 17 estimate]
More Analysis on January Existing Home Sales
by Calculated Risk on 2/18/2022 11:31:00 AM
Today, in the CalculatedRisk Real Estate Newsletter: Existing-Home Sales Increased to 6.50 million in January
Excerpt:
This graph shows existing home sales by month for 2021 and 2022.There is much more in the post. You can subscribe at https://calculatedrisk.substack.com/ (Most content is available for free, so please subscribe).
Sales declined 2.3% year-over-year compared to January 2021. This was the sixth consecutive month with sales down year-over-year.
...
[and on inventory] According to the NAR, inventory decreased to 0.86 million in January from 0.88 million in December. Inventory is now at a record low.
NAR: Existing-Home Sales Increased to 6.50 million SAAR in January
by Calculated Risk on 2/18/2022 10:15:00 AM
From the NAR: Existing-Home Sales Surge 6.7% in January
Existing-home sales rose in January, making a notable move upward following a previous month where sales declined, according to the National Association of Realtors®. On a month-over-month basis, each of the four major U.S. regions experienced an increase in sales in January. However, year-over-year, activity was mixed as two regions reported sagging sales, another watched sales increase and a fourth region remained flat.
Total existing-home sales, completed transactions that include single-family homes, townhomes, condominiums and co-ops, climbed 6.7% from December to a seasonally adjusted annual rate of 6.50 million in January. Year-over-year, sales fell 2.3% (6.65 million in January 2021).
...
Total housing inventory at the end of January amounted to 860,000 units, down 2.3% from December and down 16.5% from one year ago (1.03 million). Unsold inventory sits at a 1.6-month supply at the current sales pace, down from 1.7 months in December and from 1.9 months in January 2021.
emphasis added
 Click on graph for larger image.
This graph shows existing home sales, on a Seasonally Adjusted Annual Rate (SAAR) basis since 1993.
Sales in January (6.50 million SAAR) were up 6.7% from last month and were 2.3% below the January 2021 sales rate.
The second graph shows nationwide inventory for existing homes.
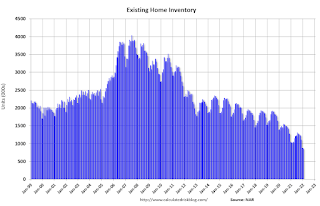 According to the NAR, inventory decreased to 0.86 million in January from 0.88 million in December.
Headline inventory is not seasonally adjusted, and inventory usually decreases to the seasonal lows in December and January, and peaks in mid-to-late summer.
The last graph shows the year-over-year (YoY) change in reported existing home inventory and months-of-supply. Since inventory is not seasonally adjusted, it really helps to look at the YoY change. Note: Months-of-supply is based on the seasonally adjusted sales and not seasonally adjusted inventory.
 Inventory was down 16.5% year-over-year in January compared to January 2021.
Months of supply declined to 1.6 months in January from 1.7 months in December.
This was above the consensus forecast. I'll have more later.
The last graph shows the year-over-year (YoY) change in reported existing home inventory and months-of-supply. Since inventory is not seasonally adjusted, it really helps to look at the YoY change. Note: Months-of-supply is based on the seasonally adjusted sales and not seasonally adjusted inventory.
Inventory was down 16.5% year-over-year in January compared to January 2021. Months of supply declined to 1.6 months in January from 1.7 months in December.
This was above the consensus forecast. I'll have more later.
LA Area Port Traffic: Record Inbound Traffic for January
by Calculated Risk on 2/18/2022 08:30:00 AM
Notes: The expansion to the Panama Canal was completed in 2016 (As I noted a few years ago), and some of the traffic that used the ports of Los Angeles and Long Beach is probably going through the canal. This might be impacting TEUs on the West Coast.
Also, incoming port traffic is still backed up in the LA area.
Container traffic gives us an idea about the volume of goods being exported and imported - and usually some hints about the trade report since LA area ports handle about 40% of the nation's container port traffic.
The following graphs are for inbound and outbound traffic at the ports of Los Angeles and Long Beach in TEUs (TEUs: 20-foot equivalent units or 20-foot-long cargo container).
To remove the strong seasonal component for inbound traffic, the first graph shows the rolling 12-month average.
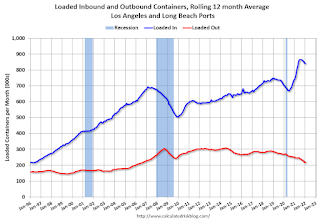
On a rolling 12-month basis, inbound traffic was up 0.1% in January compared to the rolling 12 months ending in December. Outbound traffic was down 0.5% compared to the rolling 12 months ending the previous month.
The 2nd graph is the monthly data (with a strong seasonal pattern for imports).

It seems likely there won't be a dip in February and March this year (like last year) with ships still backed up waiting to unload.
Imports were up 2% YoY in January, and exports were down 5% YoY.
This was a record for inbound traffic for January.


