 RSS Feed
 by Calculated Risk on 2/26/2022 08:11:00 AM
Saturday, February 26, 2022
Schedule for Week of February 27, 2022
The key report scheduled for this week is the February employment report.
Other key reports scheduled for this week are ISM Manufacturing and February vehicle sales.
Fed Chair Powell presents the Semiannual Monetary Policy Report to the Congress on Wednesday and Thursday.
9:45 AM: Chicago Purchasing Managers Index for February. The consensus is for a reading of 63.9, down from 65.2 in January.
10:30 AM: Dallas Fed Survey of Manufacturing Activity for February. This is the last of regional manufacturing surveys for February.
8:00 AM: Corelogic House Price index for January.
10:00 AM: ISM Manufacturing Index for January. The consensus is for the ISM to be at 58.0, up from 57.6 in January.
10:00 AM: Construction Spending for December. The consensus is for a 0.2% decrease in construction spending.
 All day: Light vehicle sales for February. The consensus is for light vehicle sales to be 14.4 million SAAR in February, down from 15.0 million in January (Seasonally Adjusted Annual Rate).
This graph shows light vehicle sales since the BEA started keeping data in 1967. The dashed line is the January sales rate.
7:00 AM ET: The Mortgage Bankers Association (MBA) will release the results for the mortgage purchase applications index.
8:15 AM: The ADP Employment Report for February. This report is for private payrolls only (no government). The consensus is for 320,000 payroll jobs added in February, up from 301,000 lost in January.
10:00 AM: Testimony, Fed Chair Jerome Powell, Semiannual Monetary Policy Report to the Congress, Before the Committee on Financial Services, U.S. House of Representatives
2:00 PM: the Federal Reserve Beige Book, an informal review by the Federal Reserve Banks of current economic conditions in their Districts.
8:30 AM: The initial weekly unemployment claims report will be released. The consensus is for a decrease to 230 thousand from 232 thousand last week.
10:00 AM: Testimony, Fed Chair Jerome Powell, Semiannual Monetary Policy Report to the Congress, Before the Committee on Banking, Housing, and Urban Affairs, U.S. Senate
10:00 AM: the ISM Services Index for February.
 8:30 AM: Employment Report for February. The consensus is for 400,000 jobs added, and for the unemployment rate to decrease to 3.9%.
There were 467,000 jobs added in January, and the unemployment rate was at 4.0%.
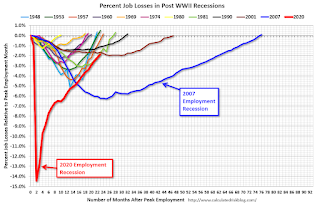
This graph shows the job losses from the start of the employment recession, in percentage terms.
The current employment recession was by far the worst recession since WWII in percentage terms. However, the current employment recession, 23 months after the onset, is now significantly better than the worst of the "Great Recession".
Friday, February 25, 2022
COVID Update: February 25, 2022: Hoping to Stop Daily COVID Posts in March!
by Calculated Risk on 2/25/2022 10:28:00 PM
On COVID (focus on hospitalizations and deaths):
| COVID Metrics | ||||
|---|---|---|---|---|
| Now | Week Ago | Goal | ||
| Percent fully Vaccinated | 64.9% | --- | ≥70.0%1 | |
| Fully Vaccinated (millions) | 215.3 | --- | ≥2321 | |
| New Cases per Day3 | 72,111 | 112,296 | ≤5,0002 | |
| Hospitalized3 | 51,462 | 70,979 | ≤3,0002 | |
| Deaths per Day3 | 1,720 | 2,049 | ≤502 | |
| 1 Minimum to achieve "herd immunity" (estimated between 70% and 85%). 2my goals to stop daily posts, 37-day average for Cases, Currently Hospitalized, and Deaths 🚩 Increasing 7-day average week-over-week for Cases, Hospitalized, and Deaths ✅ Goal met. | ||||
 Click on graph for larger image.
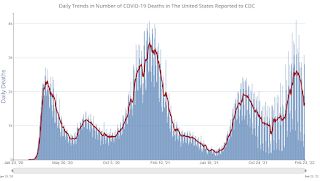
This graph shows the daily (columns) and 7-day average (line) of deaths reported.
New cases, hospitalizations and deaths are now declining.
Zillow Case-Shiller House Price Forecast: "Reaccelerating" in January
by Calculated Risk on 2/25/2022 03:16:00 PM
The Case-Shiller house price indexes for December were released this week. Zillow forecasts Case-Shiller a month early, and I like to check the Zillow forecasts since they have been pretty close.
From Zillow Research: December Case-Shiller Results & Forecast: Reaccelerating
Monthly growth in January as reported by Case-Shiller is expected to accelerate from December in the 20-city and national indices, and slow in the 10-city index. The pace of annual growth is expected to climb in all three indices. S&P Dow Jones Indices is expected to release data for the January S&P CoreLogic Case-Shiller Indices on Tuesday, March 29.
emphasis added
 The Zillow forecast is for the year-over-year change for the Case-Shiller National index to be at 18.9% in January, up from 18.8% in December.
Q1 GDP Forecasts: Around 2%
by Calculated Risk on 2/25/2022 12:58:00 PM
From BofA:
We continue to track 2.5% qoq saar for 1Q GDP. [February 25 estimate]From Goldman Sachs:
emphasis added
We boosted our Q1 GDP forecast by 1.5pp to +2.0% (qoq ar) [February 21 estimate]And from the Altanta Fed: GDPNow
The GDPNow model estimate for real GDP growth (seasonally adjusted annual rate) in the first quarter of 2022 is 0.6 percent on February 25, down from 1.3 percent on February 17. After this morning’s personal income and outlays report from the US Bureau of Economic Analysis, the nowcast of first-quarter real personal consumption expenditures growth decreased from 3.2 percent to 1.6 percent. [February 25 estimate]
NAR: Pending Home Sales Decreased 5.7% in January
by Calculated Risk on 2/25/2022 10:03:00 AM
From the NAR: Pending Home Sales Decrease 5.7% in January
Pending home sales slumped in January, continuing what is now a three-month drop in transactions, the National Association of Realtors® reported. Of the four major U.S. regions, only the West registered an increase in month-over-month contract activity. All four regions posted a decline in year-over-year activity.This was well below expectations of a 0.5% increase for this index. Note: Contract signings usually lead sales by about 45 to 60 days, so this would usually be for closed sales in February and March.
The Pending Home Sales Index (PHSI), a forward-looking indicator of home sales based on contract signings, fell 5.7% to 109.5 in January. Year-over-year, transactions decreased 9.5%. An index of 100 is equal to the level of contract activity in 2001.
...
Month-over-month, the Northeast PHSI dropped 12.1% to 84.3 in January, a 16.7% decrease from a year ago. In the Midwest, the index fell 5.9% to 104.4 last month, down 5.9% from January 2021.
Pending home sales transactions in the South slipped 6.3% to an index of 134.6 in January, down 8.7% from January 2021. The index in the West increased 1.5% in January to 95.2, down 9.7% from a year prior.
emphasis added
Personal Income increased slightly in January; Spending increased 2.1%
by Calculated Risk on 2/25/2022 08:41:00 AM
The BEA released the Personal Income and Outlays report for January:
Personal income increased $9.0 billion (less than 0.1 percent) in January, according to estimates released today by the Bureau of Economic Analysis. Disposable personal income (DPI) increased $19.8 billion (0.1 percent) and personal consumption expenditures (PCE) increased $337.2 billion (2.1 percent).The January PCE price index increased 6.1 percent year-over-year and the PCE price index, excluding food and energy, increased 5.2 percent year-over-year.
Real DPI decreased 0.5 percent in January and Real PCE increased 1.5 percent; goods increased 4.3 percent and services increased 0.1 percent. The PCE price index increased 0.6 percent. Excluding food and energy, the PCE price index increased 0.5 percent
emphasis added
The following graph shows real Personal Consumption Expenditures (PCE) through January 2022 (2012 dollars). Note that the y-axis doesn't start at zero to better show the change.
 Click on graph for larger image.
The dashed red lines are the quarterly levels for real PCE.
Personal income was above expectations, and the increase in PCE was also above expectations.
Thursday, February 24, 2022
Friday: Personal Income and Outlays, Durable Goods, Pending Home Sales
by Calculated Risk on 2/24/2022 09:18:00 PM
Friday:
• At 8:30 AM ET, Personal Income and Outlays for January. The consensus is for a 0.3% decrease in personal income, and for a 1.5% increase in personal spending. And for the Core PCE price index to increase 0.5%.
• Also, at 8:30 AM, Durable Goods Orders for January from the Census Bureau. The consensus is for a 0.7% increase in durable goods orders.
• At 10:00 AM, Pending Home Sales Index for January. The consensus is for a 0.5% increase in the index.
• Also, at 10:00 AM, University of Michigan's Consumer sentiment index (Final for February). The consensus is for a reading of 61.7.
On COVID (focus on hospitalizations and deaths):
| COVID Metrics | ||||
|---|---|---|---|---|
| Now | Week Ago | Goal | ||
| Percent fully Vaccinated | 64.8% | --- | ≥70.0%1 | |
| Fully Vaccinated (millions) | 215.3 | --- | ≥2321 | |
| New Cases per Day3 | 75,208 | 120,760 | ≤5,0002 | |
| Hospitalized3 | 53,987 | 74,353 | ≤3,0002 | |
| Deaths per Day3 | 1,674 | 2,062 | ≤502 | |
| 1 Minimum to achieve "herd immunity" (estimated between 70% and 85%). 2my goals to stop daily posts, 37-day average for Cases, Currently Hospitalized, and Deaths 🚩 Increasing 7-day average week-over-week for Cases, Hospitalized, and Deaths ✅ Goal met. | ||||
 Click on graph for larger image.
This graph shows the daily (columns) and 7-day average (line) of deaths reported.
New cases, hospitalizations and deaths are now declining.
Freddie Mac: Mortgage Serious Delinquency Rate decreased in January
by Calculated Risk on 2/24/2022 05:01:00 PM
Freddie Mac reported that the Single-Family serious delinquency rate in January was 1.06%, down from 1.12% in December. Freddie's rate is down year-over-year from 2.56% in January 2021.
Freddie's serious delinquency rate peaked in February 2010 at 4.20% following the housing bubble and peaked at 3.17% in August 2020 during the pandemic.
These are mortgage loans that are "three monthly payments or more past due or in foreclosure".
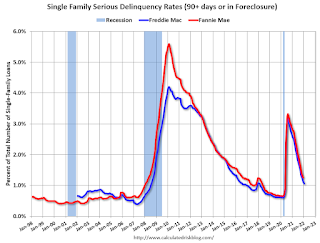
Mortgages in forbearance are being counted as delinquent in this monthly report but are not reported to the credit bureaus.
This is very different from the increase in delinquencies following the housing bubble. Lending standards have been fairly solid over the last decade, and most of these homeowners have equity in their homes - and they will be able to restructure their loans once (if) they are employed.
Also - for multifamily - delinquencies were at 0.07%, down from the peak of 0.20% in April 2021.
Hotels: Occupancy Rate Down 8% Compared to Same Week in 2019
by Calculated Risk on 2/24/2022 03:00:00 PM
Helped by Presidents’ Day weekend, U.S. hotel performance increased from the previous week and showed improvement against 2019 comparables, according to STR‘s latest data through Feb. 19.The following graph shows the seasonal pattern for the hotel occupancy rate using the four-week average.
Feb. 13-19, 2022 (percentage change from comparable week in 2019*):
• Occupancy: 59.1% (-8.4%)
• Average daily rate (ADR): $140.11 (+8.4%)
• Revenue per available room (RevPAR): $82.87 (-0.8%)
*Due to the pandemic impact, STR is measuring recovery against comparable time periods from 2019.
emphasis added
 Click on graph for larger image.
The red line is for 2022, black is 2020, blue is the median, and dashed light blue is for 2021.
The 4-week average of the occupancy rate is below the median rate for the previous 20 years (Blue).
Note: Y-axis doesn't start at zero to better show the seasonal change.
The 4-week average of the occupancy rate will increase seasonally over the next few months.
January New Home Sales: Record 106 thousand Homes Have Not been Started
by Calculated Risk on 2/24/2022 12:20:00 PM
Today, in the Calculated Risk Real Estate Newsletter: January New Home Sales: Record 106 thousand Homes Have Not been Started
Brief excerpt:
The next graph shows new home sales for 2021 and 2022 by month (Seasonally Adjusted Annual Rate). Sales in January 2022 were down 19.3% from January 2021 (new home sales were very strong at the end of 2020 and in January 2021).You can subscribe at https://calculatedrisk.substack.com/.
The year-over-year comparisons will be easier going forward.
...
The next graph shows the months of supply by stage of construction. “Months of supply” is inventory at each stage, divided by the sales rate.
The inventory of completed homes for sale was at 37 thousand in January, up from the record low of 33 thousand in March through July 2021. That is about 0.6 months of completed supply (red line). This is about half the normal level.
The inventory of new homes under construction is at 3.9 months (blue line) - well above the normal level. This elevated level of homes under construction is due to supply chain constraints.
And 106 thousand homes have not been started - about 1.6 months of supply (grey line) - almost double the normal level. Homebuilders are probably waiting to start some homes until they have a firmer grasp on prices.


