by Calculated Risk on 3/02/2022 08:43:00 AM
Wednesday, March 02, 2022
Fed Chair Powell: Raise Rates in March, Effects of Invasion "highly uncertain"
Watch Live here at 10 AM ET.
An excerpt from prepared testimony of Fed Chair Pro Tempore Powell: Semiannual Monetary Policy Report to the Congress
Our monetary policy has been adapting to the evolving economic environment, and it will continue to do so. We have phased out our net asset purchases. With inflation well above 2 percent and a strong labor market, we expect it will be appropriate to raise the target range for the federal funds rate at our meeting later this month.
The process of removing policy accommodation in current circumstances will involve both increases in the target range of the federal funds rate and reduction in the size of the Federal Reserve's balance sheet. As the FOMC noted in January, the federal funds rate is our primary means of adjusting the stance of monetary policy. Reducing our balance sheet will commence after the process of raising interest rates has begun, and will proceed in a predictable manner primarily through adjustments to reinvestments.
The near-term effects on the U.S. economy of the invasion of Ukraine, the ongoing war, the sanctions, and of events to come, remain highly uncertain. Making appropriate monetary policy in this environment requires a recognition that the economy evolves in unexpected ways. We will need to be nimble in responding to incoming data and the evolving outlook.
emphasis added
ADP: Private Employment Increased 475,000 in February
by Calculated Risk on 3/02/2022 08:19:00 AM
Private sector employment increased by 475,000 jobs from January to February according to the February ADP® National Employment ReportTM. Broadly distributed to the public each month, free of charge, the ADP National Employment Report is produced by the ADP Research Institute® in collaboration with Moody’s Analytics. The report, which is derived from ADP’s actual data of those who are on a company’s payroll, measures the change in total nonfarm private employment each month on a seasonally-adjusted basisThis was above the consensus forecast of 320,000 for this report.
“Hiring remains robust but capped by reduced labor supply post-pandemic. Last month large companies showed they are well-poised to compete with higher wages and benefit offerings, and posted the strongest reading since the early days of the pandemic recovery,” said Nela Richardson, chief economist, ADP. “Small companies lost ground as they continue to stuggle to keep pace with the wages and benefits needed to attract a limited pool of qualified workers.”
emphasis added
The BLS report will be released Friday, and the consensus is for 400 thousand non-farm payroll jobs added in February. The ADP report has not been very useful in predicting the BLS report, but this suggests a solid February BLS report.
MBA: Mortgage Applications Decrease in Latest Weekly Survey
by Calculated Risk on 3/02/2022 07:00:00 AM
From the MBA: Mortgage Applications Decrease in Latest MBA Weekly Survey
Mortgage applications decreased 0.7 percent from one week earlier, according to data from the Mortgage Bankers Association’s (MBA) Weekly Mortgage Applications Survey for the week ending February 25, 2022.
... The Refinance Index increased 1 percent from the previous week and was 56 percent lower than the same week one year ago. The seasonally adjusted Purchase Index decreased 2 percent from one week earlier. The unadjusted Purchase Index increased 1 percent compared with the previous week and was 9 percent lower than the same week one year ago.
“Mortgage rates last week reached multi-year highs, putting a damper on applications activity. The 30- year fixed rate reached its highest level since 2019 at 4.15 percent, and the refinance share of applications dipped below 50 percent. Although there was an increase in government refinance applications, higher rates continue to push potential refinance borrowers out of the market,” said Joel Kan, MBA’s Associate Vice President of Economic and Industry Forecasting. “Purchase activity remained weak, but the average loan size increased again, which indicates that home-price growth remains strong, and a greater share of the activity is occurring at the higher end of the market.”
Added Kan, “We will continue to assess the potential impact on mortgage demand from the sharp drop in interest rates this week due to the invasion of Ukraine.”
...
The average contract interest rate for 30-year fixed-rate mortgages with conforming loan balances ($647,200 or less) increased to 4.15 percent from 4.06 percent, with points decreasing to 0.44 from 0.48 (including the origination fee) for 80 percent loan-to-value ratio (LTV) loans.
emphasis added
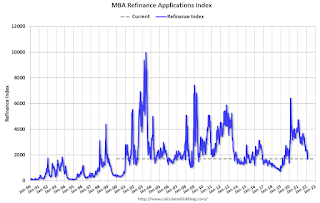 Click on graph for larger image.
The first graph shows the refinance index since 1990.
The second graph shows the MBA mortgage purchase index
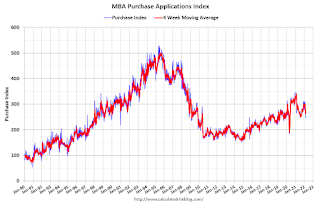 According to the MBA, purchase activity is down 9% year-over-year unadjusted.
Note: Red is a four-week average (blue is weekly).
Tuesday, March 01, 2022
Wednesday: Fed Chair Powell Testimony, ADP Employment, Beige Book
by Calculated Risk on 3/01/2022 09:37:00 PM
Wednesday:
• At 7:00 AM ET, The Mortgage Bankers Association (MBA) will release the results for the mortgage purchase applications index.
• At 8:15 AM, The ADP Employment Report for February. This report is for private payrolls only (no government). The consensus is for 320,000 payroll jobs added in February, up from 301,000 lost in January.
• At 10:00 AM, Testimony, Fed Chair Jerome Powell, Semiannual Monetary Policy Report to the Congress, Before the Committee on Financial Services, U.S. House of Representatives
• At 2:00 PM, the Federal Reserve Beige Book, an informal review by the Federal Reserve Banks of current economic conditions in their Districts.
On COVID (focus on hospitalizations and deaths):
| COVID Metrics | ||||
|---|---|---|---|---|
| Now | Week Ago | Goal | ||
| Percent fully Vaccinated | 65.0% | --- | ≥70.0%1 | |
| Fully Vaccinated (millions) | 215.7 | --- | ≥2321 | |
| New Cases per Day3 | 68,480 | 80,815 | ≤5,0002 | |
| Hospitalized3 | 41,898 | 59,829 | ≤3,0002 | |
| Deaths per Day3🚩 | 1,832 | 1,686 | ≤502 | |
| 1 Minimum to achieve "herd immunity" (estimated between 70% and 85%). 2my goals to stop daily posts, 37-day average for Cases, Currently Hospitalized, and Deaths 🚩 Increasing 7-day average week-over-week for Cases, Hospitalized, and Deaths ✅ Goal met. | ||||
 Click on graph for larger image.
This graph shows the daily (columns) and 7-day average (line) of deaths reported.
February Vehicles Sales decreased to 14.07 million SAAR
by Calculated Risk on 3/01/2022 07:24:00 PM
Wards Auto released their estimate of light vehicle sales for February. Wards Auto estimates sales of 14.07 million SAAR in February 2022 (Seasonally Adjusted Annual Rate), down 6.3% from the January sales rate, and down 11.7% from February 2021.
 Click on graph for larger image.
This graph shows light vehicle sales since 2006 from the BEA (blue) and Wards Auto's estimate for February (red).
The impact of COVID-19 was significant, and April 2020 was the worst month. After April 2020, sales increased, and were close to sales in 2019 (the year before the pandemic).
Rents Still Increasing Sharply Year-over-year
by Calculated Risk on 3/01/2022 12:44:00 PM
Today, in the Calculated Risk Real Estate Newsletter: Rents Still Increasing Sharply Year-over-year
A brief excerpt:
Here is a graph of the year-over-year (YoY) change for these measures since January 2015. All of these measures are through January 2022 (Apartment List through February 2022).There is much more in the article. You can subscribe at https://calculatedrisk.substack.com/
Note that new lease measures (Zillow, Apartment List) dipped early in the pandemic, whereas the BLS measures were steady. Then new leases took off, and the BLS measures are just starting to pick up.
...
The Zillow measure is up 15.9% YoY in January, down slightly from 16.0% YoY in December. And the ApartmentList measure is up 17.6% as of February, down slightly from 17.9% in January. Both the Zillow measure (a repeat rent index), and ApartmentList are showing a sharp increase in rents.
Clearly rents are still increasing, and we should expect this to continue to spill over into measures of inflation in 2022. The Owners’ Equivalent Rent (OER) was up 4.1% YoY in January, from 3.8% YoY in December - and will likely increase further in the coming months.
Construction Spending Increased 1.3% in January
by Calculated Risk on 3/01/2022 10:19:00 AM
From the Census Bureau reported that overall construction spending increased 1.3%:
Construction spending during January 2022 was estimated at a seasonally adjusted annual rate of $1,677.2 billion, 1.3 percent above the revised December estimate of $1,655.8 billion. The January figure is 8.2 percent above the January 2021 estimate of $1,549.8 billion.Private and public spending increased:
emphasis added
Spending on private construction was at a seasonally adjusted annual rate of $1,326.5 billion, 1.5 percent above the revised December estimate of $1,307.1 billion ...
In January, the estimated seasonally adjusted annual rate of public construction spending was $350.7 billion, 0.6 percent above the revised December estimate of $348.7 billion.
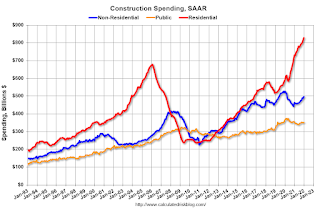 Click on graph for larger image.
This graph shows private residential and nonresidential construction spending, and public spending, since 1993. Note: nominal dollars, not inflation adjusted.
Residential (red) spending is 22% above the bubble peak (in nominal terms - not adjusted for inflation).
Non-residential (blue) spending is 20% above the bubble era peak in January 2008 (nominal dollars).
Public construction spending is 8% above the peak in March 2009.
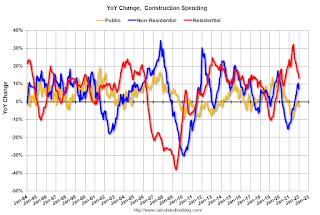 The second graph shows the year-over-year change in construction spending.
On a year-over-year basis, private residential construction spending is up 13.4%. Non-residential spending is up 7.3% year-over-year. Public spending is down 1.3% year-over-year.
ISM® Manufacturing index Increased to 58.6% in February
by Calculated Risk on 3/01/2022 10:05:00 AM
(Posted with permission). The ISM manufacturing index indicated expansion. The PMI® was at 58.6% in February, up from 57.6% in January. The employment index was at 52.9%, down from 54.5% last month, and the new orders index was at 61.7%, up from 57.9%.
From ISM: Manufacturing PMI® at 58.6% February 2022 Manufacturing ISM® Report On Business®
Economic activity in the manufacturing sector grew in February, with the overall economy achieving a 21st consecutive month of growth, say the nation's supply executives in the latest Manufacturing ISM® Report On Business®.This suggests manufacturing expanded at a slightly faster pace in February than in January.
The report was issued today by Timothy R. Fiore, CPSM, C.P.M., Chair of the Institute for Supply Management® (ISM®) Manufacturing Business Survey Committee:
“The February Manufacturing PMI® registered 58.6 percent, an increase of 1 percentage point from the January reading of 57.6 percent. This figure indicates expansion in the overall economy for the 21st month in a row after a contraction in April and May 2020. The New Orders Index registered 61.7 percent, up 3.8 percentage points compared to the January reading of 57.9 percent. The Production Index registered 58.5 percent, an increase of 0.7 percentage point compared to the January reading of 57.8 percent. The Prices Index registered 75.6 percent, down 0.5 percentage point compared to the January figure of 76.1 percent. The Backlog of Orders Index registered 65 percent, 8.6 percentage points higher than the January reading of 56.4 percent. The Employment Index registered 52.9 percent, 1.6 percentage points lower than the January reading of 54.5 percent. The Supplier Deliveries Index registered 66.1 percent, an increase of 1.5 percentage points compared to the January figure of 64.6 percent. The Inventories Index registered 53.6 percent, 0.4 percentage point higher than the January reading of 53.2 percent. The New Export Orders Index registered 57.1 percent, up 3.4 percentage points compared to the January reading of 53.7 percent. The Imports Index registered 55.4 percent, a 0.3-percentage point increase from the January reading of 55.1 percent.”
emphasis added
CoreLogic: House Prices up 19.1% YoY in January; "Highest Level in at Least 45 Years"
by Calculated Risk on 3/01/2022 08:00:00 AM
Notes: This CoreLogic House Price Index report is for January. The recent Case-Shiller index release was for December. The CoreLogic HPI is a three-month weighted average and is not seasonally adjusted (NSA).
From CoreLogic: New Year, New Highs: CoreLogic Reports Home Price Appreciation Reaches 19.1% in January – Highest Level in at Least 45 Years
CoreLogic® ... today released the CoreLogic Home Price Index (HPI™) and HPI Forecast™ for January 2022.
Consumers looking to purchase a home have remained optimistic moving into the new year, with more expecting to buy over the next six months as rapid home price appreciation is forecasted to slow. Despite market and economic challenges such as low inventory, continued buyer competition and declining affordability, potential buyers are ready to move while mortgage rates remain relatively low.
"In December and January, for-sale inventory continued to be the lowest we have seen in a generation,” said Dr. Frank Nothaft, chief economist at CoreLogic. “Buyers have continued to bid prices up for the limited supply on the market. However, the rise in mortgage rates since January further eroded buyer affordability and is expected to slow price gains in coming months.”
...
Nationally, home prices increased 19.1% in January 2022, compared to January 2021. On a month-over-month basis, home prices increased by 1.4% compared to December 2021.
...
Home price gains are projected to slow to a 3.8% annual increase by January 2023.
emphasis added
Monday, February 28, 2022
Tuesday: ISM Mfg, Construction Spending, Vehicle Sales
by Calculated Risk on 2/28/2022 08:36:00 PM
From Matthew Graham at Mortgage News Daily: Mortgage Rates Drop Noticeably as Global Drama Unfolds
To be sure, the average conventional 30yr fixed rate is still much higher than it was 3 weeks ago, but it's now lower than any day in between. Pricing is very stratified, depending on the lender, but the average lender is an entire eighth of a percent lower than Friday. That's a big move in general, but it's an exceptionally big move in the context of recent volatility.Tuesday:
emphasis added
• At 8:00 AM ET, Corelogic House Price index for January.
• At 10:00 AM, ISM Manufacturing Index for January. The consensus is for the ISM to be at 58.0, up from 57.6 in January.
• Also, at 10:00 AM, Construction Spending for December. The consensus is for a 0.2% decrease in construction spending.
• All day: Light vehicle sales for February. The consensus is for light vehicle sales to be 14.4 million SAAR in February, down from 15.0 million in January (Seasonally Adjusted Annual Rate).
On COVID (focus on hospitalizations and deaths):
| COVID Metrics | ||||
|---|---|---|---|---|
| Now | Week Ago | Goal | ||
| Percent fully Vaccinated | 64.9% | --- | ≥70.0%1 | |
| Fully Vaccinated (millions) | 215.6 | --- | ≥2321 | |
| New Cases per Day3 | 62,556 | 99,986 | ≤5,0002 | |
| Hospitalized3 | 41,242 | 62,792 | ≤3,0002 | |
| Deaths per Day3 | 1,686 | 1,940 | ≤502 | |
| 1 Minimum to achieve "herd immunity" (estimated between 70% and 85%). 2my goals to stop daily posts, 37-day average for Cases, Currently Hospitalized, and Deaths 🚩 Increasing 7-day average week-over-week for Cases, Hospitalized, and Deaths ✅ Goal met. | ||||
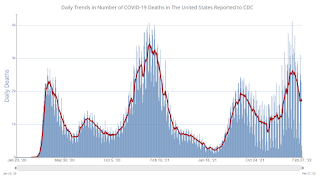 Click on graph for larger image.
This graph shows the daily (columns) and 7-day average (line) of deaths reported.


