 RSS Feed
 by Calculated Risk on 3/04/2022 12:35:00 PM
Friday, March 04, 2022
Q1 GDP Forecasts: Moving Down
From BofA:
This week’s data pushed up 4Q GDP tracking to 7.4% qoq saar from 7.0%, but lowered 1Q GDP tracking to 1.6% from 2.5%. [March 4 estimate]And from the Altanta Fed: GDPNow
emphasis added
The GDPNow model estimate for real GDP growth (seasonally adjusted annual rate) in the first quarter of 2022 is 0.0 percent on March 1, down from 0.6 percent on February 25. [March 1 estimate]
Comments on February Employment Report
by Calculated Risk on 3/04/2022 09:31:00 AM
This was a strong report with upward revisions to prior months.
The headline jobs number in the February employment report was above expectations, and employment for the previous two months was revised up by 92,000. The participation rate and the employment-population ratio both increased, and the unemployment rate decreased to 3.8%.
Leisure and hospitality gained 179 thousand jobs in February. In March and April of 2020, leisure and hospitality lost 8.20 million jobs, and are now down 1.53 million jobs since February 2020. So, leisure and hospitality has now added back about 81% all of the jobs lost in March and April 2020.
Construction employment increased 60 thousand and is now only 11 thousand below the pre-pandemic level.
Manufacturing added 36 thousand jobs and is still 178 thousand below the pre-pandemic level.
Earlier: February Employment Report: 678 thousand Jobs, 3.8% Unemployment Rate
In February, the year-over-year employment change was 6.67 million jobs.
Permanent Job Losers
 Click on graph for larger image.
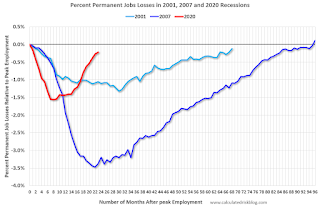
This graph shows permanent job losers as a percent of the pre-recession peak in employment through the report today.
In February, the year-over-year employment change was 6.67 million jobs.
Permanent Job Losers
Click on graph for larger image.This graph shows permanent job losers as a percent of the pre-recession peak in employment through the report today.
This data is only available back to 1994, so there is only data for three recessions.
In February, the number of permanent job losers decreased to 1.583 million from 1.630 million in the previous month.
In February, the number of permanent job losers decreased to 1.583 million from 1.630 million in the previous month.
These jobs will likely be the hardest to recover, so it is a positive that the number of permanent job losers is declining fairly rapidly.
Prime (25 to 54 Years Old) Participation
 Since the overall participation rate has declined due to cyclical (recession) and demographic (aging population, younger people staying in school) reasons, here is the employment-population ratio for the key working age group: 25 to 54 years old.
The prime working age will be key as the economy recovers.
The 25 to 54 participation rate increased in February to 82.2% from 82.0% in January, and the 25 to 54 employment population ratio increased to 79.5% from 79.1% the previous month.
Both are still below the pre-pandemic levels and indicate that some prime workers have still not returned to the labor force.
Part Time for Economic Reasons
 From the BLS report:
These workers are included in the alternate measure of labor underutilization (U-6) that increased to 7.2% from 7.1% in the previous month. This is down from the record high in April 22.9% for this measure since 1994. This measure was at 7.0% in February 2020 (pre-pandemic).
Unemployed over 26 Weeks
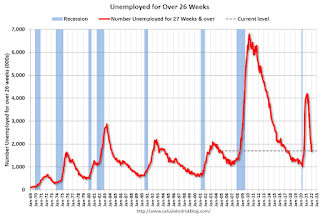 This graph shows the number of workers unemployed for 27 weeks or more.
According to the BLS, there are 1.702 million workers who have been unemployed for more than 26 weeks and still want a job, up from 1.691 million the previous month.
This does not include all the people that left the labor force.
Summary:
The headline monthly jobs number was above expectations; and the previous two months were revised up by 92,000 combined.
Part Time for Economic Reasons
From the BLS report:"The number of persons employed part time for economic reasons increased by 418,000 to 4.1 million in February but remains below its February 2020 level of 4.4 million. These individuals, who would have preferred full-time employment, were working part time because their hours had been reduced or they were unable to find full-time jobs."The number of persons working part time for economic reasons increased in February to 4.135 million from 3.717 million in January. This is lower than pre-recession levels.
These workers are included in the alternate measure of labor underutilization (U-6) that increased to 7.2% from 7.1% in the previous month. This is down from the record high in April 22.9% for this measure since 1994. This measure was at 7.0% in February 2020 (pre-pandemic).
Unemployed over 26 Weeks
This graph shows the number of workers unemployed for 27 weeks or more. According to the BLS, there are 1.702 million workers who have been unemployed for more than 26 weeks and still want a job, up from 1.691 million the previous month.
This does not include all the people that left the labor force.
Summary:
The headline monthly jobs number was above expectations; and the previous two months were revised up by 92,000 combined.
The headline unemployment rate decreased to 3.8%. The household survey indicated a solid gain in employment of 548 thousand, following a gain of 1.2 million last month.
Both the prime age participation rate and employment-population ratio increased, but still below pre-pandemic levels, indicating some prime workers are still out of the labor force. And there are still 2.1 million fewer jobs than prior to the recession.
Overall, this was another strong report.
February Employment Report: 678 thousand Jobs, 3.8% Unemployment Rate
by Calculated Risk on 3/04/2022 08:44:00 AM
From the BLS:
Total nonfarm payroll employment rose by 678,000 in February, and the unemployment rate edged down to 3.8 percent, the U.S. Bureau of Labor Statistics reported today. Job growth was widespread, led by gains in leisure and hospitality, professional and business services, health care, and construction.
The change in total nonfarm payroll employment for December was revised up by 78,000, from +510,000 to +588,000, and the change for January was revised up by 14,000, from +467,000 to +481,000. With these revisions, employment in December and January combined is 92,000 higher than previously reported.
emphasis added
 Click on graph for larger image.
The first graph shows the year-over-year change in total non-farm employment since 1968.
In February, the year-over-year change was 6.67 million jobs. This was up significantly year-over-year.
Total payrolls increased by 678 thousand in February. Private payrolls increased by 654 thousand, and public payrolls increased 24 thousand.
Payrolls for December and January were revised up 92 thousand, combined.
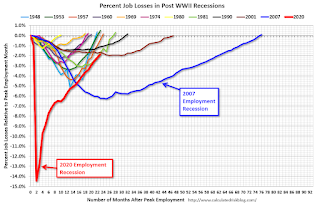
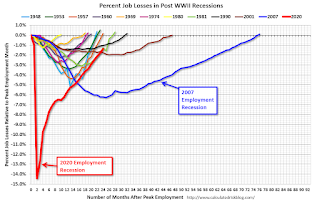 The second graph shows the job losses from the start of the employment recession, in percentage terms.
The current employment recession was by far the worst recession since WWII in percentage terms. However, the current employment recession, 24 months after the onset, is now significantly better than the worst of the "Great Recession".
The third graph shows the employment population ratio and the participation rate.
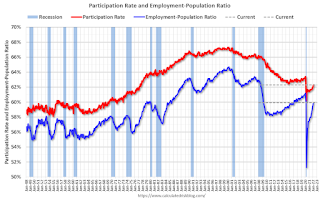 The Labor Force Participation Rate increased to 62.3% in February, from 62.2% in January. This is the percentage of the working age population in the labor force.
 The Employment-Population ratio increased to 59.9% from 59.7% (blue line).
I'll post the 25 to 54 age group employment-population ratio graph later.
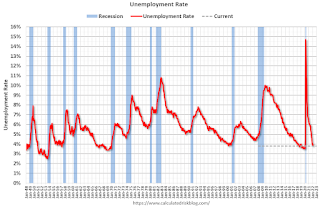 The fourth graph shows the unemployment rate.
 The unemployment rate decreased in February to 3.8% from 4.0% in January.
This was above consensus expectations; and November and December payrolls were revised up by 92,000 combined.
I'll have more later ...
Thursday, March 03, 2022
Friday: February Employment Report
by Calculated Risk on 3/03/2022 09:08:00 PM
My February Employment Preview
Goldman February Payrolls Preview
Friday:
• At 8:30 AM ET, Employment Report for February. The consensus is for 400,000 jobs added, and for the unemployment rate to decrease to 3.9%.
On COVID (focus on hospitalizations and deaths):
| COVID Metrics | ||||
|---|---|---|---|---|
| Now | Week Ago | Goal | ||
| Percent fully Vaccinated | 65.0% | --- | ≥70.0%1 | |
| Fully Vaccinated (millions) | 215.9 | --- | ≥2321 | |
| New Cases per Day3 | 53,016 | 74,143 | ≤5,0002 | |
| Hospitalized3 | 38,175 | 54,307 | ≤3,0002 | |
| Deaths per Day3 | 1,558 | 1,711 | ≤502 | |
| 1 Minimum to achieve "herd immunity" (estimated between 70% and 85%). 2my goals to stop daily posts, 37-day average for Cases, Currently Hospitalized, and Deaths 🚩 Increasing 7-day average week-over-week for Cases, Hospitalized, and Deaths ✅ Goal met. | ||||
 Click on graph for larger image.
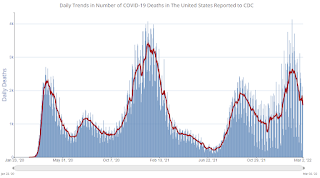
This graph shows the daily (columns) and 7-day average (line) of deaths reported.
Goldman February Payrolls Preview
by Calculated Risk on 3/03/2022 04:28:00 PM
A few brief excerpts from a note by Goldman Sachs economist Spencer Hill:
We estimate nonfarm payrolls rose by 500k in February (mom sa), above consensus of +400k. Our forecast assumes the return of roughly 200k payroll workers who missed work in January due to Omicron. ... We estimate a two-tenths drop in the unemployment rate to 3.8%—compared to consensus of 3.9%.CR Note: The consensus is for 400 thousand jobs added, and for the unemployment rate to decline to 3.9%.
emphasis added
Hotels: Occupancy Rate Down 5% Compared to Same Week in 2019
by Calculated Risk on 3/03/2022 01:35:00 PM
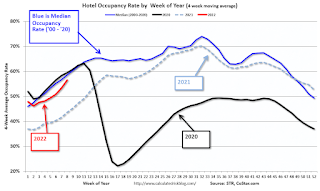
U.S. hotel performance increased from the previous week and showed significant improvement against 2019 comparables, according to STR‘s latest data through Feb. 26.The following graph shows the seasonal pattern for the hotel occupancy rate using the four-week average.
Feb. 20-26, 2022 (percentage change from comparable week in 2019*):
• Occupancy: 62.2% (-4.7%)
• Average daily rate (ADR): $143.83 (+13.1%)
• Revenue per available room (RevPAR): $89.45 (+7.7%)
*Due to the pandemic impact, STR is measuring recovery against comparable time periods from 2019.
emphasis added
 Click on graph for larger image.
The red line is for 2022, black is 2020, blue is the median, and dashed light blue is for 2021.
The 4-week average of the occupancy rate is below the median rate for the previous 20 years (Blue).
Note: Y-axis doesn't start at zero to better show the seasonal change.
The 4-week average of the occupancy rate will increase seasonally over the next few months.
February Employment Preview
by Calculated Risk on 3/03/2022 11:25:00 AM
On Friday at 8:30 AM ET, the BLS will release the employment report for February. The consensus is for 400,000 jobs added, and for the unemployment rate to decrease to 3.9%.
 Click on graph for larger image.
• First, currently there are still about 2.9 million fewer jobs than in February 2020 (before the pandemic).
This graph shows the job losses from the start of the employment recession, in percentage terms.
The current employment recession was by far the worst recession since WWII in percentage terms. However, the current employment recession, 23 months after the onset, is now significantly better than the worst of the "Great Recession".
• ADP Report: The ADP employment report showed a gain of 475,000 private sector jobs, well above the consensus estimates of 320,000 jobs added. The ADP report hasn't been very useful in predicting the BLS report, but this suggests the BLS report could be above expectations.
• ISM Surveys: Note that the ISM services are diffusion indexes based on the number of firms hiring (not the number of hires). The ISM® manufacturing employment index decreased in February to 52.9%, down from 54.5% last month. This would suggest no change in manufacturing employment in February. ADP showed 30,000 manufacturing jobs gained.
The ISM® Services employment index decreased in February to 48.5%, down from 52.3% last month. This would suggest a 30 thousand increase in service employment in February. Combined, the ISM indexes suggest employment well below the consensus estimate.
• Unemployment Claims: The weekly claims report showed a decrease in the number of initial unemployment claims during the reference week (includes the 12th of the month) from 290,000 in January to 249,000 in February. This would usually suggest fewer layoffs in February than in January, although this might not be very useful right now. In general, weekly claims were close to expectations in February.
 • Permanent Job Losers: Something to watch in the employment report will be "Permanent job losers". This graph shows permanent job losers as a percent of the pre-recession peak in employment through the January report.
This data is only available back to 1994, so there is only data for three recessions. In January, he number of permanent job losers decreased to 1.630 million from 1.703 million the previous month.
These jobs will likely be the hardest to recover, so it is a positive that the number of permanent job losers is declining fairly rapidly.
• COVID: As far as the pandemic, the number of daily cases during the reference week in February was around 200,000, down sharply from around 800,000 in January. The current wave peaked during the January reference week, and declined in February
• Conclusion: There is optimism concerning the February employment report due to the sharp decline in COVID cases. Overall, the ADP report was solid, and unemployment claims decreased during the reference week. However, the ISM employment surveys were weak in February. My sense is the report will be below consensus expectations.
ISM® Services Index Decreased to 56.5% in February
by Calculated Risk on 3/03/2022 10:04:00 AM
(Posted with permission). The ISM® Services index was at 56.5%, down from 59.9% last month. The employment index decreased to 48.5%, from 52.3%. Note: Above 50 indicates expansion, below 50 in contraction.
From the Institute for Supply Management: Services PMI® at 56.5% February 2022 Services ISM® Report On Business®
Economic activity in the services sector grew in February for the 21st month in a row — with the Services PMI® registering 56.5 percent — say the nation’s purchasing and supply executives in the latest Services ISM® Report On Business®.The employment index decreased to 48.5%, from 52.3% the previous month.
The report was issued today by Anthony Nieves, CPSM, C.P.M., A.P.P., CFPM, Chair of the Institute for Supply Management® (ISM®) Services Business Survey Committee: “In February, the Services PMI® registered 56.5 percent, 3.4 percentage points below January's reading of 59.9 percent. The Business Activity Index registered 55.1 percent, a decrease of 4.8 percentage points compared to the reading of 59.9 percent in January, and the New Orders Index figure of 56.1 percent is 5.6 percentage points lower than the January reading of 61.7 percent.
emphasis added
Weekly Initial Unemployment Claims Decrease to 215,000
by Calculated Risk on 3/03/2022 08:35:00 AM
The DOL reported:
In the week ending February 26, the advance figure for seasonally adjusted initial claims was 215,000, a decrease of 18,000 from the previous week's revised level. The previous week's level was revised up by 1,000 from 232,000 to 233,000. The 4-week moving average was 230,500, a decrease of 6,000 from the previous week's revised average. The previous week's average was revised up by 250 from 236,250 to 236,500.The following graph shows the 4-week moving average of weekly claims since 1971.
emphasis added
 Click on graph for larger image.
The dashed line on the graph is the current 4-week average. The four-week average of weekly unemployment claims decreased to 230,500.
The previous week was revised up.
Weekly claims were lower than the consensus forecast.
Wednesday, March 02, 2022
Thursday: Fed Chair Powell Testimony, Unemployment Claims, ISM Services
by Calculated Risk on 3/02/2022 08:32:00 PM
Thursday:
• At 8:30 AM ET, The initial weekly unemployment claims report will be released. The consensus is for a decrease to 230 thousand from 232 thousand last week.
• At 10:00 AM, Testimony, Fed Chair Jerome Powell, Semiannual Monetary Policy Report to the Congress, Before the Committee on Banking, Housing, and Urban Affairs, U.S. Senate
• Also at 10:00 AM, the ISM Services Index for February.
On COVID (focus on hospitalizations and deaths):
| COVID Metrics | ||||
|---|---|---|---|---|
| Now | Week Ago | Goal | ||
| Percent fully Vaccinated | 65.0% | --- | ≥70.0%1 | |
| Fully Vaccinated (millions) | 215.8 | --- | ≥2321 | |
| New Cases per Day3 | 56,253 | 81,212 | ≤5,0002 | |
| Hospitalized3 | 40,190 | 56,955 | ≤3,0002 | |
| Deaths per Day3 | 1,674 | 1,687 | ≤502 | |
| 1 Minimum to achieve "herd immunity" (estimated between 70% and 85%). 2my goals to stop daily posts, 37-day average for Cases, Currently Hospitalized, and Deaths 🚩 Increasing 7-day average week-over-week for Cases, Hospitalized, and Deaths ✅ Goal met. | ||||
 Click on graph for larger image.
This graph shows the daily (columns) and 7-day average (line) of deaths reported.


