 RSS Feed
 by Calculated Risk on 3/07/2022 09:42:00 AM
Monday, March 07, 2022
Housing Inventory March 7th Update: Inventory Down 1.4% Week-over-week; New Record Low; Possible Bottom
Tracking existing home inventory is very important in 2022.
Inventory usually declines in the winter, and this is a new record low for this series.
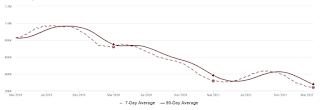
This inventory graph is courtesy of Altos Research.
As of March 4th, inventory was at 241 thousand (7-day average), compared to 318 thousand for the same week a year ago. That is a decline of 24.2%.
A week ago, inventory was at 244 thousand, and was down 24.9% YoY.
Inventory was down 1.4% from the previous week.
Compared to the same week in 2020, inventory is down 66.5% from 720 thousand.
Last year inventory bottomed seasonally in April 2021 - very late in the year. An early key in 2022 will be to watch if inventory bottoms earlier this year.
| Week Ending | YoY Change |
|---|---|
| 12/31/2021 | -30.0% |
| 1/7/2022 | -26.0% |
| 1/14/2022 | -28.6% |
| 1/21/2022 | -27.1% |
| 1/28/2022 | -25.9% |
| 2/4/2022 | -27.9% |
| 2/11/2022 | -27.5% |
| 2/18/2022 | -25.8% |
| 2/25/2022 | -24.9% |
| 3/4/2022 | -24.2% |
Based on the trend, it appears possible inventory bottomed seasonally last week, and will be up week-over-week in the next report.
Mike Simonsen discusses this data regularly on Youtube.
Used Vehicle Wholesale Prices Decline in February
by Calculated Risk on 3/07/2022 09:18:00 AM
From Manheim Consulting today: Wholesale Used-Vehicle Prices Decline in February
Wholesale used-vehicle prices (on a mix-, mileage-, and seasonally adjusted basis) declined 2.1% in February from January. The Manheim Used Vehicle Value Index declined to 231.3, which was a 36.7% increase from a year ago. The non-adjusted price change in February was a decline of 2.2% compared to January, leaving the unadjusted average price up 32.4% year over year.
Manheim Market Report (MMR) values saw weekly price decreases in February that decelerated each week.
emphasis added
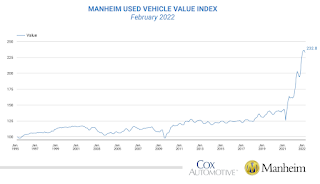 Click on graph for larger image.
This index from Manheim Consulting is based on all completed sales transactions at Manheim’s U.S. auctions.
The Manheim index suggests used car prices declined in February but are still up 36.7% year-over-year.
According to the BLS, "Used cars and trucks" were up 1.5% in January compared to December 2021 (up 19.1% annualized) and up 40.5% year-over-year in January. It seems likely that "Used cars and trucks" will be down in the February CPI report.
Six High Frequency Indicators for the Economy
by Calculated Risk on 3/07/2022 08:57:00 AM
These indicators are mostly for travel and entertainment. It is interesting to watch these sectors recover as the pandemic subsides.
The TSA is providing daily travel numbers.
This data is as of March7th.
 Click on graph for larger image.
This data shows the 7-day average of daily total traveler throughput from the TSA for 2019 (Light Blue), 2020 (Black), 2021 (Blue) and 2022 (Red).
The dashed line is the percent of 2019 for the seven-day average.
The 7-day average is down 15.2% from the same day in 2019 (84.8% of 2019). (Dashed line)
Air travel was picking up over the last few of weeks but turned down again last week (dashed line).
The second graph shows the 7-day average of the year-over-year change in diners as tabulated by OpenTable for the US and several selected cities.
IMPORTANT: OpenTable notes that all data is compared to 2019. Thanks!
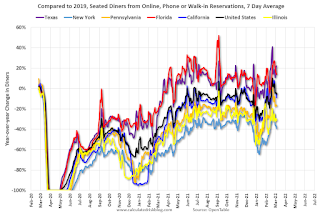 Thanks to OpenTable for providing this restaurant data:
This data is updated through March 5, 2022.
This data is "a sample of restaurants on the OpenTable network across all channels: online reservations, phone reservations, and walk-ins. For year-over-year comparisons by day, we compare to the same day of the week from the same week in the previous year."
Dining was mostly moving sideways but declined during the winter wave of COVID and is now increasing. The 7-day average for the US is down 5% compared to 2019.
Thanks to OpenTable for providing this restaurant data:This data is updated through March 5, 2022.
This data is "a sample of restaurants on the OpenTable network across all channels: online reservations, phone reservations, and walk-ins. For year-over-year comparisons by day, we compare to the same day of the week from the same week in the previous year."
Dining was mostly moving sideways but declined during the winter wave of COVID and is now increasing. The 7-day average for the US is down 5% compared to 2019.
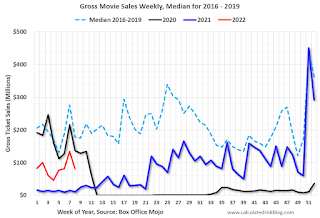 This data shows domestic box office for each week and the median for the years 2016 through 2019 (dashed light blue).
 Black is 2020, Blue is 2021 and Red is 2022.
The data is from BoxOfficeMojo through March 3rd.
Note that the data is usually noisy week-to-week and depends on when blockbusters are released.
Movie ticket sales were at $80 million last week, down about 55% from the median for the week.
Note that the data is usually noisy week-to-week and depends on when blockbusters are released.
Movie ticket sales were at $80 million last week, down about 55% from the median for the week.
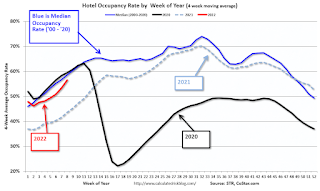 This graph shows the seasonal pattern for the hotel occupancy rate using the four-week average.
 The red line is for 2022, black is 2020, blue is the median, and dashed light blue is for 2021.
This data is through February 26th. The occupancy rate was down 4.7% compared to the same week in 2019.
The 4-week average of the occupancy rate is below the median rate for the previous 20 years (Blue).
Notes: Y-axis doesn't start at zero to better show the seasonal change.
Notes: Y-axis doesn't start at zero to better show the seasonal change.
The 4-week average of the occupancy rate will increase seasonally over the next few months.
This graph is from Apple mobility. From Apple: "This data is generated by counting the number of requests made to Apple Maps for directions in select countries/regions, sub-regions, and cities." This is just a general guide - people that regularly commute probably don't ask for directions.
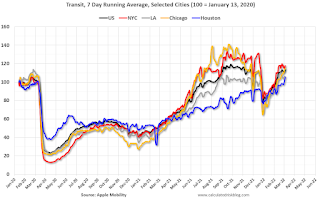 This data is through March 4th
 for the United States and several selected cities.
The graph is the running 7-day average to remove the impact of weekends.
IMPORTANT: All data is relative to January 13, 2020. This data is NOT Seasonally Adjusted. People walk and drive more when the weather is nice, so I'm just using the transit data.
According to the Apple data directions requests, public transit in the 7-day average for the US is at 113% of the January 2020 level.
Here is some interesting data on New York subway usage (HT BR).
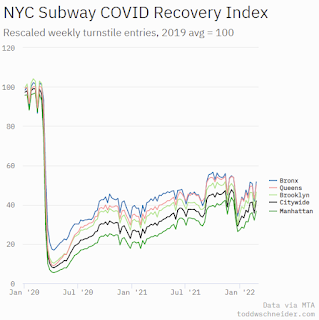 This graph is from Todd W Schneider.
 This graph shows how much MTA traffic has recovered in each borough (Graph starts at first week in January 2020 and 100 = 2019 average).
Manhattan is at about 37% of normal.
This data is through Friday, March 4th.
He notes: "Data updates weekly from the MTA’s public turnstile data, usually on Saturday mornings".
Sunday, March 06, 2022
Sunday Night Futures
by Calculated Risk on 3/06/2022 07:12:00 PM
Weekend:
• Schedule for Week of March 6, 2022
Monday:
• No major economic releases scheduled.
From CNBC: Pre-Market Data and Bloomberg futures S&P 500 futures are down 58, and and DOW futures are down 311 fair value).
Oil prices were up over the last week with WTI futures at $126.76 per barrel and Brent at $129.86 per barrel. A year ago, WTI was at $65, and Brent was at $70 - so WTI oil prices are up almost double year-over-year.
Here is a graph from Gasbuddy.com for nationwide gasoline prices. Nationally prices are at $4.06 per gallon. A year ago prices were at $2.77 per gallon, so gasoline prices are up $1.25 per gallon year-over-year.
Weather Adjusted Employment Gains in February
by Calculated Risk on 3/06/2022 11:55:00 AM
This is something I like to check during the Winter.
The BLS reported 161 thousand people were employed in non-agriculture industries, with a job, but not at work due to bad weather. The average for February over the previous 10 years was 347 thousand. The median was 248 thousand.
The BLS also reported 592 thousand people were usually full-time employees but were working part time in February due to bad weather. The average for February over the previous 10 years was 1.54 million. The median was 708 thousand.

The San Francisco Fed estimates Weather-Adjusted Change in Total Nonfarm Employment (monthly change, seasonally adjusted). They use local area weather to estimate the impact on employment.
For February, the BLS reported 678 thousand jobs added, the San Francisco Fed estimates that weather adjusted employment gains were 665 thousand. This suggests weather had little impact on employment in February.
Saturday, March 05, 2022
Real Estate Newsletter Articles this Week
by Calculated Risk on 3/05/2022 02:11:00 PM
At the Calculated Risk Real Estate Newsletter this week:
• Delinquencies, Foreclosures and REO
• The War and Mortgage Rates
• Rents Still Increasing Sharply Year-over-year Higher Rents will impact measures of inflation in 2022
• Median vs Repeat Sales Index House Prices
This is usually published several times a week and provides more in-depth analysis of the housing market.
The blog will continue as always!
You can subscribe at https://calculatedrisk.substack.com/ Most content is available for free (and no Ads), but please subscribe!
You can subscribe at https://calculatedrisk.substack.com/ Most content is available for free (and no Ads), but please subscribe!
Schedule for Week of March 6, 2022
by Calculated Risk on 3/05/2022 08:11:00 AM
The key report scheduled for this week is February CPI.
No major economic releases scheduled.
6:00 AM ET: NFIB Small Business Optimism Index for February.
 8:30 AM: Trade Balance report for January from the Census Bureau.
 This graph shows the U.S. trade deficit, with and without petroleum, through the most recent report. The blue line is the total deficit, and the black line is the petroleum deficit, and the red line is the trade deficit ex-petroleum products.
The consensus is the trade deficit to be $87.1 billion. The U.S. trade deficit was at $80.7 Billion in December.
7:00 AM ET: The Mortgage Bankers Association (MBA) will release the results for the mortgage purchase applications index.
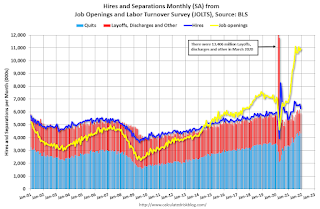 10:00 AM ET: Job Openings and Labor Turnover Survey for January from the BLS.
 This graph shows job openings (yellow line), hires (purple), Layoff, Discharges and other (red column), and Quits (light blue column) from the JOLTS.
Jobs openings increased in December to 10.9 million from 10.8 million in November.
8:30 AM: The Consumer Price Index for February from the BLS. The consensus is for a 0.8% increase in CPI, and a 0.5% increase in core CPI. The consensus is for CPI to be up 7.9% Year-over-year (YoY), and core CPI to be up 6.4% YoY.
8:30 AM: The initial weekly unemployment claims report will be released. The consensus is for a decrease to 210 thousand from 215 thousand last week.
12:00 PM: Q4 Flow of Funds Accounts of the United States from the Federal Reserve.
10:00 AM: University of Michigan's Consumer sentiment index (Preliminary for March).
Friday, March 04, 2022
COVID Update: March 4, 2022; Under 50,000 New Cases First Time Since July 2021
by Calculated Risk on 3/04/2022 09:15:00 PM
On COVID (focus on hospitalizations and deaths):
| COVID Metrics | ||||
|---|---|---|---|---|
| Now | Week Ago | Goal | ||
| Percent fully Vaccinated | 65.1% | --- | ≥70.0%1 | |
| Fully Vaccinated (millions) | 216.0 | --- | ≥2321 | |
| New Cases per Day3 | 49,888 | 70,968 | ≤5,0002 | |
| Hospitalized3 | 36,278 | 51,764 | ≤3,0002 | |
| Deaths per Day3 | 1,413 | 1,739 | ≤502 | |
| 1 Minimum to achieve "herd immunity" (estimated between 70% and 85%). 2my goals to stop daily posts, 37-day average for Cases, Currently Hospitalized, and Deaths 🚩 Increasing 7-day average week-over-week for Cases, Hospitalized, and Deaths ✅ Goal met. | ||||
 Click on graph for larger image.
This graph shows the daily (columns) and 7-day average (line) of deaths reported.
AAR: February Rail Carloads and Intermodal Up Year-over-year; Still Soft
by Calculated Risk on 3/04/2022 03:59:00 PM
From the Association of American Railroads (AAR) Rail Time Indicators. Graphs and excerpts reprinted with permission.
U.S. rail carloads were up 11.0% in February 2022 over February 2021, but that’s misleading — the big percentage gain is mainly a function of weak carloads in February 2021 caused by severe winter storms back then in Texas and elsewhere. (The third week of February 2021 had the fewest rail carloads of any week in our records going back to 1988.) For the first two months of 2022, carloads were up 3.6% ...
U.S. intermodal volume in February 2022 was up 1.4% over last year
emphasis added
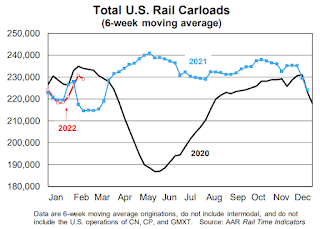 Click on graph for larger image.
This graph from the Rail Time Indicators report shows the six-week average of U.S. Carloads in 2019, 2020 and 2021:
Total carloads were 915,329 in February 2022, an average of 228,832 per week. Other than February 2020, that’s the lowest weekly average for a February since sometime before 1988, when our U.S. rail traffic data begin.
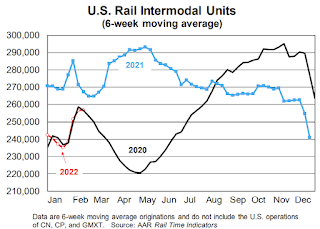 The second graph shows the six-week average (not monthly) of U.S. intermodal in 2019, 2020 and 2021: (using intermodal or shipping containers):
Volume in February 2022 was 1.03 million, up 1.4% (14,294 containers and trailers) over February 2021. The weekly average in February 2022 was 238,220, well below the first half 2021 weekly average of 282,004 and the second half 2021 average of 261,938. The two-month total in 2022 was 2.03 million. Since 2016, only 2020 had a lower January-February total.
Delinquencies, Foreclosures and REO
by Calculated Risk on 3/04/2022 01:53:00 PM
Today, in the Calculated Risk Real Estate Newsletter: Delinquencies, Foreclosures and REO
A brief excerpt:
Last year, I pointed out that the foreclosure moratorium, combined with the expiration of a large number of forbearance plans, would NOT lead to a surge in foreclosures and impact house prices (as happened following the housing bubble).There is much more in the article. You can subscribe at https://calculatedrisk.substack.com/
...
Here is some data on REOs through Q4 2021 …
...
We will probably see an increase in REOs in 2022.
This graph shows the nominal dollar value of Residential REO for FDIC insured institutions. Note: The FDIC reports the dollar value and not the total number of REOs.
The dollar value of 1-4 family residential Real Estate Owned (REOs, foreclosed houses) declined from $1.11 billion in Q4 2020 to $0.78 billion in Q4 2021. This is the lowest level of REOs in many years. (Probably declined sharply due to foreclosure moratoriums, forbearance programs and house price increases).
...
The bottom line is there will be an increase in foreclosures in 2022 (from record low levels), but it will not be a huge wave of foreclosures.


