 RSS Feed
 by Calculated Risk on 3/09/2022 02:22:00 PM
Wednesday, March 09, 2022
Vehicle Sales Mix and Heavy Trucks
It will be interesting to see if high gasoline prices will lead to a higher percentage of passenger car sales.
This graph shows the percent of light vehicle sales between passenger cars and trucks / SUVs through February 2022.
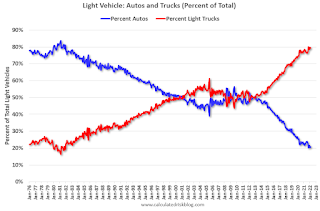 Over time the mix has changed more and more towards light trucks and SUVs.
Only when oil prices are high, does the trend slow or reverse.
The percent of light trucks and SUVs was at 79.2% in February 2022 - just below the record high percentage of 80.0% last October.
The second graph shows heavy truck sales since 1967 using data from the BEA. The dashed line is the February 2022 seasonally adjusted annual sales rate (SAAR).
Heavy truck sales really collapsed during the great recession, falling to a low of 180 thousand SAAR in May 2009. Then heavy truck sales increased to a new all time high of 563 thousand SAAR in September 2019.
Note: "Heavy trucks - trucks more than 14,000 pounds gross vehicle weight."
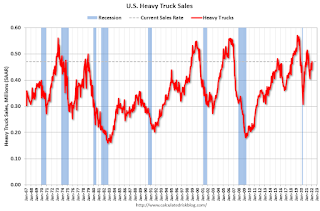 Heavy truck sales really declined at the beginning of the pandemic, falling to a low of 299 thousand SAAR in May 2020.
 Heavy truck sales were at 471 thousand SAAR in February, up from 441 thousand SAAR in January, and up 2% from 460 thousand SAAR in February 2021.
BLS: Job Openings "little changed" at 11.3 million in January
by Calculated Risk on 3/09/2022 10:09:00 AM
From the BLS: Job Openings and Labor Turnover Summary
The number of job openings was little changed at 11.3 million on the last business day of January, the U.S. Bureau of Labor Statistics reported today. Hires and total separations were little changed at 6.5 million and 6.1 million, respectively. Within separations, the quits rate decreased to 2.8 percent. The layoffs and discharges rate was little changed at 0.9 percent.The following graph shows job openings (yellow line), hires (dark blue), Layoff, Discharges and other (red column), and Quits (light blue column) from the JOLTS.
emphasis added
This series started in December 2000.
Note: The difference between JOLTS hires and separations is similar to the CES (payroll survey) net jobs headline numbers. This report is for January, the employment report last Friday was for February.
 Click on graph for larger image.
Note that hires (dark blue) and total separations (red and light blue columns stacked) are usually pretty close each month. This is a measure of labor market turnover. When the blue line is above the two stacked columns, the economy is adding net jobs - when it is below the columns, the economy is losing jobs.
The huge spike in layoffs and discharges in March 2020 are labeled, but off the chart to better show the usual data.
Jobs openings decreased in January to 11.3 million from 11.4 million in December.
The number of job openings (yellow) were up 56% year-over-year.
Quits were up 28% year-over-year. These are voluntary separations. (See light blue columns at bottom of graph for trend for "quits").
MBA: Mortgage Applications Increase in Latest Weekly Survey
by Calculated Risk on 3/09/2022 07:00:00 AM
From the MBA: Mortgage Applications Increase in Latest MBA Weekly Survey
Mortgage applications increased 8.5 percent from one week earlier, according to data from the Mortgage Bankers Association’s (MBA) Weekly Mortgage Applications Survey for the week ending March 4, 2022.
... The Refinance Index increased 9 percent from the previous week and was 50 percent lower than the same week one year ago. The seasonally adjusted Purchase Index increased 9 percent from one week earlier. The unadjusted Purchase Index increased 11 percent compared with the previous week and was 7 percent lower than the same week one year ago.
"Mortgage rates dropped for the first time in 12 weeks, as the war in Ukraine spurred an investor flight to quality, which pushed U.S. Treasury yields lower. A 6-basis-point decline in the 30-year fixed-rate mortgage led to a slight rebound in total refinance activity, with a larger gain in government refinances. Looking ahead, the potential for higher inflation amidst disruptions in oil and other commodity flows will likely lead to a period of volatility in rates as these effects work against each other,” said Joel Kan, MBA’s Associate Vice President of Economic and Industry Forecasting. “Purchase activity also increased, as prospective buyers acted on lower rates and the early start of the spring buying season. The average loan size remained close to record highs, with higher-balance loan applications continuing to dominate growth.
...
The average contract interest rate for 30-year fixed-rate mortgages with conforming loan balances ($647,200 or less) decreased to 4.09 percent from 4.15 percent, with points remaining unchanged at 0.44 (including the origination fee) for 80 percent loan-to-value ratio (LTV) loans.
emphasis added
 Click on graph for larger image.
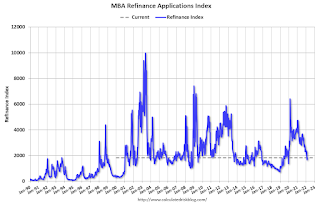
The first graph shows the refinance index since 1990.
With higher mortgage rates, the refinance index has declined sharply over the last several months. Refinance activity rebounded slightly as rates fell due to the invasion.
The second graph shows the MBA mortgage purchase index
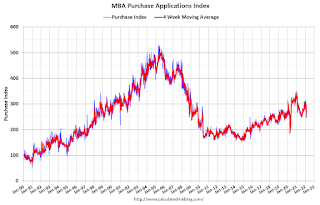 According to the MBA, purchase activity is down 7% year-over-year unadjusted.
Note: Red is a four-week average (blue is weekly).
Tuesday, March 08, 2022
Wednesday: Job Openings
by Calculated Risk on 3/08/2022 08:55:00 PM
Wednesday:
• At 7:00 AM ET, The Mortgage Bankers Association (MBA) will release the results for the mortgage purchase applications index.
• At 10:00 AM, Job Openings and Labor Turnover Survey for January from the BLS.
On COVID (focus on hospitalizations and deaths):
| COVID Metrics | ||||
|---|---|---|---|---|
| Now | Week Ago | Goal | ||
| Percent fully Vaccinated | 65.1% | --- | ≥70.0%1 | |
| Fully Vaccinated (millions) | 216.3 | --- | ≥2321 | |
| New Cases per Day3 | 40,433 | 66,869 | ≤5,0002 | |
| Hospitalized3 | 29,633 | 42,589 | ≤3,0002 | |
| Deaths per Day3 | 1,208 | 1,887 | ≤502 | |
| 1 Minimum to achieve "herd immunity" (estimated between 70% and 85%). 2my goals to stop daily posts, 37-day average for Cases, Currently Hospitalized, and Deaths 🚩 Increasing 7-day average week-over-week for Cases, Hospitalized, and Deaths ✅ Goal met. | ||||
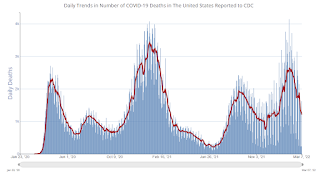 Click on graph for larger image.
This graph shows the daily (columns) and 7-day average (line) of deaths reported.
Leading Index for Commercial Real Estate "Recovers in February"
by Calculated Risk on 3/08/2022 02:00:00 PM
From Dodge Data Analytics: Dodge Momentum Index Recovers in February
The Dodge Momentum Index increased 4% in February to 158.2 (2000=100), from the revised January reading of 151.9. The Momentum Index, issued by Dodge Construction Network, is a monthly measure of the initial report for nonresidential building projects in planning, which have been shown to lead construction spending for nonresidential buildings by a full year. In February, institutional planning rose 9%, and commercial planning moved 1% higher.
The Dodge Momentum Index rebounded from three consecutive monthly declines that followed a 14-year high in October 2021. Much of February’s gain was due to a sizeable jump in the institutional component, as more education and healthcare projects entered planning. Commerical planning remained solid thanks to office and warehouse projects. When compared to February 2021, the overall Momentum Index was 11% higher in February 2022. The institutional component was up 37%, while the commercial component was down 1% on a year-over-year basis.
emphasis added
 Click on graph for larger image.
This graph shows the Dodge Momentum Index since 2002. The index was at 158.2 in February, up from 151.9 in January.
According to Dodge, this index leads "construction spending for nonresidential buildings by a full year". This index suggested a decline in Commercial Real Estate construction through most of 2021, but a solid pickup in 2022.
1st Look at Local Housing Markets in February
by Calculated Risk on 3/08/2022 10:27:00 AM
Today, in the Calculated Risk Real Estate Newsletter: 1st Look at Local Housing Markets in February
A brief excerpt:
Here is a summary of active listings for these housing markets in February. Inventory was up 2.4% in February month-over-month (MoM) from January, and down 30.0% year-over-year (YoY).There is much more in the article. You can subscribe at https://calculatedrisk.substack.com/
It appears inventory has bottomed seasonally in some areas. Last month, these markets were down 38.8% YoY, so the YoY decline in February is smaller than in January. This isn’t indicating a slowing market, but maybe a few baby steps towards a more balanced market in some areas.
Notes for all tables:
1) New additions to table in BOLD.
2) Northwest (Seattle) and Santa Clara (San Jose)
Trade Deficit Increased to $89.7 Billion in January
by Calculated Risk on 3/08/2022 08:42:00 AM
From the Department of Commerce reported:
The U.S. Census Bureau and the U.S. Bureau of Economic Analysis announced today that the goods and services deficit was $89.7 billion in January, up $7.7 billion from $82.0 billion in December, revised.
January exports were $224.4 billion, $3.9 billion less than December exports. January imports were $314.1 billion, $3.8 billion more than December imports.
emphasis added
 Click on graph for larger image.
Exports decreased and imports increased in January.
Exports are up 15% compared to January 2021; imports are up 21% year-over-year.
Both imports and exports decreased sharply due to COVID-19, and have now bounced back (imports more than exports),
The second graph shows the U.S. trade deficit, with and without petroleum.
 The blue line is the total deficit, and the black line is the petroleum deficit, and the red line is the trade deficit ex-petroleum products.
Note that net, imports and exports of petroleum products are close to zero.
The trade deficit with China increased to $36.4 billion in January, from $26.3 billion in January 2021.
Monday, March 07, 2022
Tuesday: Trade Deficit
by Calculated Risk on 3/07/2022 09:14:00 PM
From Matthew Graham at Mortgage News Daily: Mortgage Rates Jump Back Up to Start The Week
Mortgage rates have experienced significant volatility so far in 2022. At first, this was almost exclusively a function of the Federal Reserve or, rather, the market's reaction to changes being discussed by the Fed. It was also almost exclusively biased toward higher rates.Tuesday:
Since late February, Ukraine is the key consideration for financial markets. At first, this pushed rates noticeably lower, but that trend has leveled off as of last week. Now we're seeing rates move broadly sideways in the bigger picture, with extreme volatility at times. [30 year fixed 4.09%]
emphasis added
• At 6:00 AM ET, NFIB Small Business Optimism Index for February.
• At 8:30 AM, Trade Balance report for January from the Census Bureau. The consensus is the trade deficit to be $87.1 billion. The U.S. trade deficit was at $80.7 Billion in December.
On COVID (focus on hospitalizations and deaths):
| COVID Metrics | ||||
|---|---|---|---|---|
| Now | Week Ago | Goal | ||
| Percent fully Vaccinated | 65.1% | --- | ≥70.0%1 | |
| Fully Vaccinated (millions) | 216.2 | --- | ≥2321 | |
| New Cases per Day3 | 42,204 | 62,266 | ≤5,0002 | |
| Hospitalized3 | 29,837 | 44,714 | ≤3,0002 | |
| Deaths per Day3 | 1,259 | 1,723 | ≤502 | |
| 1 Minimum to achieve "herd immunity" (estimated between 70% and 85%). 2my goals to stop daily posts, 37-day average for Cases, Currently Hospitalized, and Deaths 🚩 Increasing 7-day average week-over-week for Cases, Hospitalized, and Deaths ✅ Goal met. | ||||
 Click on graph for larger image.
This graph shows the daily (columns) and 7-day average (line) of deaths reported.
Homebuilder Comments in February: “Demand is still high"
by Calculated Risk on 3/07/2022 05:28:00 PM
Today, in the Calculated Risk Real Estate Newsletter: Homebuilder Comments in February: “Demand is still high"
A brief excerpt:
Some homebuilder comments courtesy of Rick Palacios Jr., Director of Research at John Burns Real Estate Consulting (a must follow for housing on twitter!):There is much more in the article. You can subscribe at https://calculatedrisk.substack.com/
Here is Rick’s summary of builder comments for various markets (emphasis added in bold):
Homebuilder survey results are in for February. Top themes: 1) Record high new home price increases at +20% YOY nationally. 2) Record low builder finished inventory. 3) Demand still off the charts & quality of home buyer prospect lists still solid. Market commentary to follow ...
#Charlotte builder: “We’ve stopped selling homes in the majority of our communities due to supply chain & labor delays. We release homes for sale once they get to drywall stage. This will throw off our community counts & sales numbers."
#Boston builder: “We continue to limit lot releases, even sold our models. Our agents are not holding open houses nor advertising. Lots are reserved within days of release.”
#Nashville builder: “Market is still extremely strong even with rates moving up. Still a large shortage of homes on the market.”
#Dallas builder: “We’re limiting sales to spec inventory in order to limit inflation risk.”
#Austin builder: “Traditional detached sales (entry level and move-up) continued to be very strong in February."
Black Knight Mortgage Monitor for January: "$275 billion in equity withdrawn" in 2021
by Calculated Risk on 3/07/2022 12:45:00 PM
Today, in the Calculated Risk Real Estate Newsletter: Black Knight Mortgage Monitor for January: "$275 billion in equity withdrawn" in 2021
A brief excerpt:
And on the payment to income ratio (this is high):There is much more in the article. You can subscribe at https://calculatedrisk.substack.com/
• Rising home prices and interest rates continue to put significant pressure on home buyers
• The principal and interest payment required to buy the average-priced home is up $186 (14%) over the first two months of the year and $417 (37%) year-over-year
• It now requires 27.5% of the median household income to purchase the average home – well above the long-term affordability benchmark of 25%, though still below the high of 34% during the pre-Great Recession bubble
• From 2013 through 2019, a payment-to-income ratio of 21.5% universally corresponded with home price deceleration – a trend that's been shattered in the post-pandemic world


