 RSS Feed
 by Calculated Risk on 3/12/2022 08:11:00 AM
Saturday, March 12, 2022
Schedule for Week of March 13, 2022
The key reports this week are February Retail Sales, Housing Starts and Existing Home Sales.
For manufacturing, the February Industrial Production report and the March NY and Philly Fed manufacturing surveys will be released.
The FOMC meets this week, and the FOMC is expected to raise rates.
10:00 AM: State Employment and Unemployment (Monthly), January 2022
8:30 AM: The New York Fed Empire State manufacturing survey for March. The consensus is for a reading of 7.2, up from 3.1.
8:30 AM ET: The Producer Price Index for February from the BLS. The consensus is for a 0.9% increase in PPI, and a 0.6% increase in core PPI.
7:00 AM ET: The Mortgage Bankers Association (MBA) will release the results for the mortgage purchase applications index.
 8:30 AM: Retail sales for February is scheduled to be released. The consensus is for a 0.4% increase in retail sales.
This graph shows retail sales since 1992. This is monthly retail sales and food service, seasonally adjusted (total and ex-gasoline). Retail sales ex-gasoline were up 4.2% in January.
10:00 AM: The March NAHB homebuilder survey. The consensus is for a reading of 81, down from 82. Any number above 50 indicates that more builders view sales conditions as good than poor.
2:00 PM: FOMC Meeting Announcement. The FOMC is expected to raise the Fed Funds rate by 25bps at this meeting.
2:00 PM: FOMC Forecasts This will include the Federal Open Market Committee (FOMC) participants' projections of the appropriate target federal funds rate along with the quarterly economic projections.
2:30 PM: Fed Chair Jerome Powell holds a press briefing following the FOMC announcement.
 8:30 AM: Housing Starts for February.
 This graph shows single and multi-family housing starts since 1968.
The consensus is for 1.695 million SAAR, up from 1.638 million SAAR.
8:30 AM: The initial weekly unemployment claims report will be released. The consensus is for a decrease to 225 thousand from 227 thousand last week.
8:30 AM: the Philly Fed manufacturing survey for March. The consensus is for a reading of 15.0, down from 16.0.
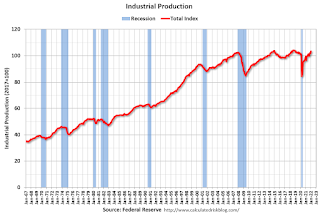 9:15 AM: The Fed will release Industrial Production and Capacity Utilization for February.
This graph shows industrial production since 1967.
The consensus is for a 0.5% increase in Industrial Production, and for Capacity Utilization to increase to 77.9%.
 10:00 AM: Existing Home Sales for February from the National Association of Realtors (NAR). The consensus is for 6.16 million SAAR, down from 6.50 million.
The graph shows existing home sales from 1994 through the report last month.
Friday, March 11, 2022
COVID Update: March 11, 2022; New Cases at 35,000, Lowest Since July 2021
by Calculated Risk on 3/11/2022 09:19:00 PM
On COVID (focus on hospitalizations and deaths):
| COVID Metrics | ||||
|---|---|---|---|---|
| Now | Week Ago | Goal | ||
| Percent fully Vaccinated | 65.2% | --- | ≥70.0%1 | |
| Fully Vaccinated (millions) | 216.4 | --- | ≥2321 | |
| New Cases per Day3 | 35,652 | 49,000 | ≤5,0002 | |
| Hospitalized3 | 25,878 | 36,756 | ≤3,0002 | |
| Deaths per Day3 | 1,197 | 1,434 | ≤502 | |
| 1 Minimum to achieve "herd immunity" (estimated between 70% and 85%). 2my goals to stop daily posts, 37-day average for Cases, Currently Hospitalized, and Deaths 🚩 Increasing 7-day average week-over-week for Cases, Hospitalized, and Deaths ✅ Goal met. | ||||
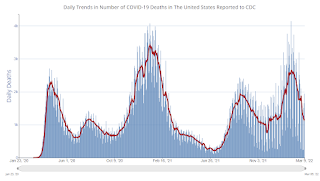
 Click on graph for larger image.
This graph shows the daily (columns) and 7-day average (line) of deaths reported.
Q1 GDP Forecasts: Close to Zero
by Calculated Risk on 3/11/2022 12:53:00 PM
From BofA:
This week’s trade and inventory data along with some adjustments to assumptions left our 1Q GDP tracking estimate unchanged at 1.0% qoq saar. [March 11 estimate]From Goldman:
emphasis added
We are downgrading our US GDP forecast to reflect higher oil prices and other drags on growth related to the war in Ukraine. ... As a result, we now forecast GDP growth of +0.5%/+1.5%/+2.5%/+2.5% in 2022Q1-Q4 (vs. 1.0%/2.5%/2.5%/2.0% previously), lowering our 2022 real GDP growth forecast to +1.75% on a Q4/Q4 basis (vs. +2.0% previous; 2.7% consensus). [0.5% Q1 March 10 estimate]And from the Altanta Fed: GDPNow
The GDPNow model estimate for real GDP growth (seasonally adjusted annual rate) in the first quarter of 2022 is 0.5 percent on March 8, up from 0.0 percent on March 1. [March 8 estimate]
2nd Look at Local Housing Markets in February
by Calculated Risk on 3/11/2022 10:02:00 AM
Today, in the Calculated Risk Real Estate Newsletter: 2nd Look at Local Housing Markets in February
A brief excerpt:
Important on Houston MarketThere is much more in the article. You can subscribe at https://calculatedrisk.substack.com/
From the Houston Association of REALTORS® (HAR): February Is a Strong Month for Houston Home Sales (Sales up sharply due partially to the freeze in February 2021)Home sales scored double-digit gains in February, but part of the strong showing was because the statistics compared to last February, when that deadly Texas freeze halted real estate activity for days, and in some cases, even longer. Undistorted by the weather factor were the continued squeeze on inventory, which returned to its all-time low, and pricing, which due to limited supply and ongoing consumer demand, soared to record highs.
emphasis addedAnd a table of February sales. Sales in these areas were down 2.0% YoY, Not Seasonally Adjusted (NSA). Note: The Houston market was up 25.6% year-over-year due to the freeze in February 2021.
Notes for all tables:
1) New additions to table in BOLD.
2) Northwest (Seattle), North Texas (Dallas), and Santa Clara (San Jose), Jacksonville, Source: Northeast Florida Association of REALTORS®
3) Totals do not include Atlanta, and Denver (included in state totals).
Hotels: Occupancy Rate Down 8% Compared to Same Week in 2019
by Calculated Risk on 3/11/2022 08:30:00 AM
From CoStar: STR: US Hotel Performance Down From Previous Week
U.S. hotel performance decreased from the previous week, according to STR‘s latest data through March 5.The following graph shows the seasonal pattern for the hotel occupancy rate using the four-week average.
Feb. 27 through March 5, 2022 (percentage change from comparable week in 2019*):
• Occupancy: 61.2% (-8.2%)
• Average daily rate (ADR): $137.96 (+4.7%)
• Revenue per available room (RevPAR): $84.39 (-3.8%)
*Due to the pandemic impact, STR is measuring recovery against comparable time periods from 2019.
emphasis added
 Click on graph for larger image.
The red line is for 2022, black is 2020, blue is the median, and dashed light blue is for 2021.
The 4-week average of the occupancy rate is close to the median rate for the previous 20 years (Blue).
Note: Y-axis doesn't start at zero to better show the seasonal change.
The 4-week average of the occupancy rate will increase seasonally over the next few weeks.
Thursday, March 10, 2022
30-Year Mortgage Rates Highest in almost 3 Years
by Calculated Risk on 3/10/2022 09:15:00 PM
From Matthew Graham at Mortgage News Daily: Sorry... Mortgage Rates Definitely Aren't Still Under 4%
The average lender is now definitively up and over 4.25% for the first time since early 2019. In other words, today's rates are the highest in almost 3 years. [30 year fixed 4.28%]Friday:
emphasis added
• At 10:00 AM, University of Michigan's Consumer sentiment index (Preliminary for March).
On COVID (focus on hospitalizations and deaths):
| COVID Metrics | ||||
|---|---|---|---|---|
| Now | Week Ago | Goal | ||
| Percent fully Vaccinated | 65.2% | --- | ≥70.0%1 | |
| Fully Vaccinated (millions) | 216.4 | --- | ≥2321 | |
| New Cases per Day3 | 37,146 | 52,155 | ≤5,0002 | |
| Hospitalized3 | 26,655 | 38,581 | ≤3,0002 | |
| Deaths per Day3 | 1,179 | 1,572 | ≤502 | |
| 1 Minimum to achieve "herd immunity" (estimated between 70% and 85%). 2my goals to stop daily posts, 37-day average for Cases, Currently Hospitalized, and Deaths 🚩 Increasing 7-day average week-over-week for Cases, Hospitalized, and Deaths ✅ Goal met. | ||||
 Click on graph for larger image.
This graph shows the daily (columns) and 7-day average (line) of deaths reported.
The Home ATM Open in Q4 2021; Closing in 2022, aka Mortgage Equity Withdrawal (MEW)
by Calculated Risk on 3/10/2022 02:32:00 PM
Today, in the Real Estate Newsletter: The Home ATM Open in Q4 2021; Closing in 2022
Excerpt:
First, here is the quarterly increase in mortgage debt from the Federal Reserve’s report since 2000. In the mid ‘00s, there was a large increase in mortgage debt associated with the housing bubble.There is much more in the article. You can subscribe at https://calculatedrisk.substack.com/ (All ad free, most content free).
In Q4 2021, mortgage debt increased $245 billion, the largest quarterly increase since 2006. Note the almost 7 year of declining mortgage debt as distressed sales (foreclosures and short sales) wiped out a significant amount of debt.
However, some of this debt is being used to increase the housing stock (purchase new homes), so this isn’t all MEW.
...
The bottom line is the recent increase in MEW is not concerning - it is far less as a percent of disposable personal income than during the bubble, and most homeowners have substantial equity.
Also, it is very likely that MEW will decrease sharply in 2022 as refinance activity declines due to higher mortgage rates. I expect significantly lower levels of MEW in 2022.
Fed's Flow of Funds: Household Net Worth Increased $5.3 Trillion in Q4
by Calculated Risk on 3/10/2022 02:08:00 PM
The Federal Reserve released the Q4 2021 Flow of Funds report today: Financial Accounts of the United States.
The net worth of households and nonprofits rose to $150.3 trillion during the fourth quarter of 2021. The value of directly and indirectly held corporate equities increased $2.5 trillion and the value of real estate increased $1.5 trillion.
...
Household debt increased 8 percent at an annual rate in the fourth quarter of 2021. Consumer credit grew at an annual rate of 6.9 percent, while mortgage debt (excluding charge-offs) grew at an annual rate of 8 percent.
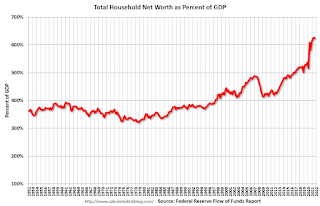 Click on graph for larger image.
The first graph shows Households and Nonprofit net worth as a percent of GDP.
With the sharp decline in GDP in Q2 2020, net worth as a percent of GDP increased sharply, and then declined somewhat. But now net worth as a percent of GDP is at a new all-time high.
This includes real estate and financial assets (stocks, bonds, pension reserves, deposits, etc) net of liabilities (mostly mortgages). Note that this does NOT include public debt obligations.
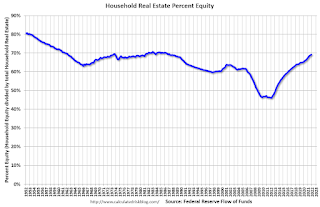 This graph shows homeowner percent equity since 1952.
Household percent equity (as measured by the Fed) collapsed when house prices fell sharply in 2007 and 2008.
In Q4 2021, household percent equity (of household real estate) was at 69.2% - up from 68.8% in Q3 This is the highest percent equity since the 1980s.
Note: about 30.3% of owner occupied households had no mortgage debt as of April 2010. So, the approximately 50+ million households with mortgages have less than 67.7% equity - and about 1.1 million homeowners still have negative equity.
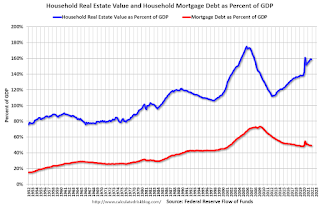 The third graph shows household real estate assets and mortgage debt as a percent of GDP. Note this graph was impacted by the sharp decline in Q2 2020 GDP.
Mortgage debt increased by $245 billion in Q4. This is the largest quarterly increase in mortgage debt since 2006.
Mortgage debt is up $1.05 trillion from the peak during the housing bubble, but, as a percent of GDP is at 48.9% - down from Q2 - and down from a peak of 73.3% of GDP during the housing bubble.
The value of real estate, as a percent of GDP, increased in Q4, and is well above the average of the last 30 years.
This graph shows homeowner percent equity since 1952. Household percent equity (as measured by the Fed) collapsed when house prices fell sharply in 2007 and 2008.
In Q4 2021, household percent equity (of household real estate) was at 69.2% - up from 68.8% in Q3 This is the highest percent equity since the 1980s.
Note: about 30.3% of owner occupied households had no mortgage debt as of April 2010. So, the approximately 50+ million households with mortgages have less than 67.7% equity - and about 1.1 million homeowners still have negative equity.
The third graph shows household real estate assets and mortgage debt as a percent of GDP. Note this graph was impacted by the sharp decline in Q2 2020 GDP.Mortgage debt increased by $245 billion in Q4. This is the largest quarterly increase in mortgage debt since 2006.
Mortgage debt is up $1.05 trillion from the peak during the housing bubble, but, as a percent of GDP is at 48.9% - down from Q2 - and down from a peak of 73.3% of GDP during the housing bubble.
The value of real estate, as a percent of GDP, increased in Q4, and is well above the average of the last 30 years.
Cleveland Fed: Median CPI increased 0.5% and Trimmed-mean CPI increased 0.5% in February
by Calculated Risk on 3/10/2022 11:18:00 AM
The Cleveland Fed released the median CPI and the trimmed-mean CPI this morning:
According to the Federal Reserve Bank of Cleveland, the median Consumer Price Index rose 0.5% in February. The 16% trimmed-mean Consumer Price Index also increased 0.5% in February. "The median CPI and 16% trimmed-mean CPI are measures of core inflation calculated by the Federal Reserve Bank of Cleveland based on data released in the Bureau of Labor Statistics’ (BLS) monthly CPI report".
Note: The Cleveland Fed released the median CPI details here: "Used Cars" were down 3% annualized, and this will likely show declines in coming months. Motor fuel was up 118% annualized in February and will likely increase further in March.
Note that Owners' Equivalent Rent and Rent of Primary Residence account for almost 1/3 of median CPI, and these measures were up around 5.9% annualized in February.
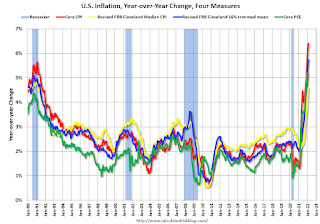 Click on graph for larger image.
This graph shows the year-over-year change for these four key measures of inflation.
Click on graph for larger image.This graph shows the year-over-year change for these four key measures of inflation.
On a year-over-year basis, the median CPI rose 4.6%, the trimmed-mean CPI rose 5.7%, and the CPI less food and energy rose 6.4%. Core PCE is for January and increased 5.2% year-over-year.
CoreLogic: Homeowners with Negative Equity Lowest in Over 12 Years
by Calculated Risk on 3/10/2022 09:14:00 AM
From CoreLogic: Number of U.S. Homeowners in Negative Equity Dropped to Lowest Level in Over 12 Years, CoreLogic Reports
CoreLogic® ... today released the Homeowner Equity Report for the fourth quarter of 2021. The report shows U.S. homeowners with mortgages (which account for roughly 63% of all properties) have seen their equity increase by 29.3% year over year, representing a collective equity gain of over $3.2 trillion, and an average gain of $55,300 per borrower, since the fourth quarter of 2020.
U.S. home prices rose 18% year over year in the fourth quarter of 2021, up from the 8% annual gain recorded in the fourth quarter of 2020. The appreciation helped push the national negative equity figure to the lowest in over a dozen years, with just 1.1 million homeowners underwater on their mortgages. Western state homeowners saw the biggest equity gains by dollar value, led by Hawaii, California and Washington. Year-over-year price appreciation increased by 19.1% in January 2022 according to CoreLogic’s latest Home Price Index, though growth is projected to eventually slow over the next 12 months.
“Home prices rose 18% during 2021 in the CoreLogic Home Price Index, the largest annual gain recorded in its 45-year history, generating a big increase in home equity wealth,” said Dr. Frank Nothaft, chief economist for CoreLogic. “For low- and moderate-income homeowners, home equity has historically been a major source of wealth.”
Negative equity, also referred to as underwater or upside-down mortgages, applies to borrowers who owe more on their mortgages than their homes are currently worth. As of the fourth quarter of 2021, negative equity share, and the quarter-over-quarter and year-over-year changes, were as follows:
• Quarterly change: From the third quarter of 2021 to the fourth quarter of 2021, the total number of mortgaged homes in negative equity decreased by 3% to 1.1 million homes, or 2.1% of all mortgaged properties.
• Annual change: In the fourth quarter of 2020, 1.5 million homes, or 2.8% of all mortgaged properties, were in negative equity. This number decreased by 24.9%, or approximately 380,000 properties, by the fourth quarter of 2021.
• Distribution of negative equity: Of loans in negative equity in the fourth quarter of 2021, 42% had a loan-to-value ratio below 125%, and 58% had a loan-to-value ratio of 125% or higher.
emphasis added
 Click on graph for larger image.
This graph from CoreLogic compares Q4 to Q3 2021 equity distribution by LTV. There are still a few properties with LTV over 125%. But most homeowners have a significant amount of equity. This is a very different picture than at the start of the housing bust when many homeowners had little equity.
On a year-over-year basis, the number of homeowners with negative equity has declined from 1.5 million to 1.1 million.


