 RSS Feed
 by Calculated Risk on 3/15/2022 01:38:00 PM
Tuesday, March 15, 2022
3rd Look at Local Housing Markets in February
Today, in the Calculated Risk Real Estate Newsletter: 3rd Look at Local Housing Markets in February
A brief excerpt:
California doesn’t report monthly sales (not seasonally adjusted) or inventory, but here is the press release from the California Association of Realtors® (C.A.R.): California home sales edge higher in February amid geopolitical tensions and inflation uncertainty, C.A.R. reportsThere is much more in the article.February’s sales pace was down 4.5 percent on a monthly basis from 444,540 in January and was down 8.2 percent from a year ago ... California’s Unsold Inventory Index (UII) rose in February as active listings climbed from January to the highest level in three months. February’s UII was 2.0 months and 2.1 months in February 2021.Active Inventory in February
Here is a summary of active listings for these housing markets in February. Inventory was down 5.3% in February month-over-month (MoM) from January, and down 23.9% year-over-year (YoY).
It appears inventory has bottomed seasonally in some areas. Last month, these markets were down 26.5% YoY, so the YoY decline in February is smaller than in January. This isn’t indicating a slowing market, but maybe a few baby steps towards a more balanced market in some areas.
Notes for all tables:
1) New additions to table in BOLD.
2) Northwest (Seattle), North Texas (Dallas), and Santa Clara (San Jose), Jacksonville, Source: Northeast Florida Association of REALTORS®
3) otals do not include Atlanta, Denver, Minneapolis (included in state totals).
You can subscribe at https://calculatedrisk.substack.com/
Predicting the Next Recession
by Calculated Risk on 3/15/2022 09:51:00 AM
Way back in 2013, I wrote a post "Predicting the Next Recession. This post was in response to several recession forecasts (that were incorrect).
In that 2013 post, I wrote:
The next recession will probably be caused by one of the following (from least likely to most likely):Unfortunately, in 2020, one of these low probability events happened (pandemic, emphasis added), and that led to a recession in 2020.
3) An exogenous event such as a pandemic, significant military conflict, disruption of energy supplies for any reason, a major natural disaster (meteor strike, super volcano, etc), and a number of other low probability reasons. All of these events are possible, but they are unpredictable, and the probabilities are low that they will happen in the next few years or even decades.
2) Significant policy error. Two examples: not reaching a fiscal agreement and going off the "fiscal cliff" probably would have led to a recession, and Congress refusing to "pay the bills" would have been a policy error that would have taken the economy into recession.We've seen several policy errors over the last several years, mostly related to immigration and trade during the previous administration, but none that would lead the economy into a recession.
1) Most of the post-WWII recessions were caused by the Fed tightening monetary policy to slow inflation. I think this is the most likely cause of the next recession. Usually, when inflation starts to become a concern, the Fed tries to engineer a "soft landing", and frequently the result is a recession.And this most common cause of a recession is the current concern. With inflation picking up due to the pandemic (stimulus spending, supply constraints) and now due to the invasion of Ukraine, the Fed will embark this week on a tightening cycle to slow inflation.
The Fed cannot ease pandemic related supply constraints (except by curbing demand), and the Fed cannot stop the war. So, there is a possibility that the Fed will tighten too much and that will lead to a "hard landing" (aka recession).
The key will be to watch housing. Housing is the main transmission mechanism for Fed policy. We have already seen mortgage rates rise enough to sharply slow mortgage equity withdrawal, and further increases will likely slow housing.
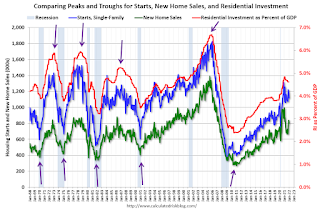
For the economy, what I focus on is single family starts and new home sales. For the bottoms and troughs for key housing activity, here is a graph of Single family housing starts, New Home Sales, and Residential Investment (RI) as a percent of GDP.
Note: The pandemic has distorted the economic data, and - as I've noted many times - we can't be a slave to any model.
 Click on graph for larger image.
The arrows point to some of the earlier peaks and troughs for these three measures.
The purpose of this graph is to show that these three indicators generally reach peaks and troughs together. Note that Residential Investment is quarterly and single-family starts and new home sales are monthly.
New home sales and single-family starts turned down last year, but this was because of the huge surge in sales and starts in the 2nd half of 2020.
 The second graph shows the YoY change in New Home Sales from the Census Bureau.
Note: the New Home Sales data is smoothed using a three month centered average before calculating the YoY change. The Census Bureau data starts in 1963.
Some observations:
1) When the YoY change in New Home Sales falls about 20%, usually a recession will follow. An exception for this data series was the mid '60s when the Vietnam buildup kept the economy out of recession. Another exception was the recent situation - we saw a YoY decline in new home sales related to the pandemic and the surge in new home sales in the second half of 2020.
Also note that the sharp decline in 2010 was related to the housing tax credit policy in 2009 - and was just a continuation of the housing bust.
2) It is also interesting to look at the '86/'87 and the mid '90s periods. New Home sales fell in both of these periods, although not quite 20%. As I noted in earlier posts, the mid '80s saw a surge in defense spending and MEW that more than offset the decline in New Home sales. In the mid '90s, nonresidential investment remained strong.
If the Fed tightening cycle will lead to a recession, we should see housing turn down first (new home sales, single family starts, residential investment). There are other indicators too - such as the yield curve and heavy truck sales - but mostly I'll be watching housing. (I'm not currently on recession watch)
Monday, March 14, 2022
Tuesday: PPI, NY Fed Mfg
by Calculated Risk on 3/14/2022 09:05:00 PM
It appears there is another wave coming (Europe and China are seeing sharp increases). According to Andy Slavitt the new variant "BA2 spreads approx 30% faster than omicron". Hopefully it will not be severe.
Tuesday:
• At 8:30 AM ET, The New York Fed Empire State manufacturing survey for March. The consensus is for a reading of 7.2, up from 3.1.
• At 8:30 AM, The Producer Price Index for February from the BLS. The consensus is for a 0.9% increase in PPI, and a 0.6% increase in core PPI.
On COVID (focus on hospitalizations and deaths):
| COVID Metrics | ||||
|---|---|---|---|---|
| Now | Week Ago | Goal | ||
| Percent fully Vaccinated | 65.3% | --- | ≥70.0%1 | |
| Fully Vaccinated (millions) | 216.7 | --- | ≥2321 | |
| New Cases per Day3 | 34,113 | 41,216 | ≤5,0002 | |
| Hospitalized3 | 21,471 | 31,949 | ≤3,0002 | |
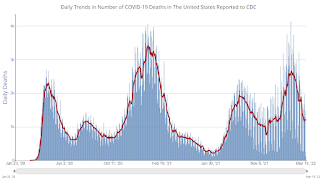
| Deaths per Day3 | 1,187 | 1,295 | ≤502 | |
| 1 Minimum to achieve "herd immunity" (estimated between 70% and 85%). 2my goals to stop daily posts, 37-day average for Cases, Currently Hospitalized, and Deaths 🚩 Increasing 7-day average week-over-week for Cases, Hospitalized, and Deaths ✅ Goal met. | ||||
 Click on graph for larger image.
This graph shows the daily (columns) and 7-day average (line) of deaths reported.
"Mortgage Rates Explode Higher"
by Calculated Risk on 3/14/2022 04:37:00 PM
From Matthew Graham at MortgageNewsDaily: Mortgage Rates Explode Higher. Anything Quoted Before Right Now is LONG Gone
If you received a mortgage rate quote any time in the past few days or weeks, unless it was at the end of the business day on Monday, March 14th, you're looking at a relic of a bygone era. Print it out and hang it up in the halls of Woulda, Shoulda, Coulda. ...
In the very best cases, some lenders are only .125% higher in rate (to put that in perspective, few individual days see bigger moves). Other lenders are closer to 0.25% higher. That puts today in a league with fewer than 10 players over the past decade. The average conventional 30yr fixed rate is easily up and over 4.25% now, with lenders anywhere from 4.375 to 4.625% depending on the scenario.
 Click on graph for larger image.
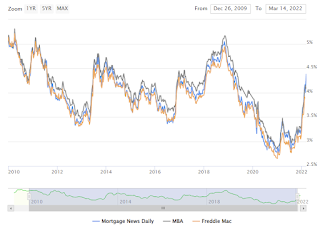
This is a graph from Mortgage News Daily (MND) showing 30-year fixed rates from three sources (MND, MBA, Freddie Mac) since 2010.
The 30-year fixed rate for top tier scenarios was 4.38% today, up from 4.29% on Friday.
This is the highest rate since March 2019.
Go to MND and you can adjust the graph for different time periods.
Second Home Market: South Lake Tahoe in February
by Calculated Risk on 3/14/2022 11:53:00 AM
With the pandemic, there was a surge in 2nd home buying.
I'm looking at data for some second home markets - and I'm tracking those markets to see if there is an impact from lending changes, rising mortgage rates or easing of the pandemic.
This graph is for South Lake Tahoe since 2004 through February 2022, and shows inventory (blue), and the year-over-year (YoY) change in the median price (12-month average).
Note: The median price is distorted by the mix, but this is the available data.
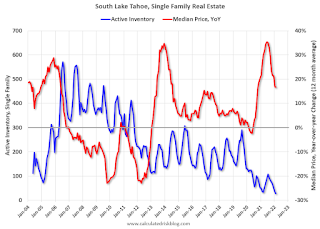
Following the housing bubble, prices declined for several years in South Lake Tahoe, with the median price falling about 50% from the bubble peak.
Currently inventory is at a record low - just below the previous record low set in March 2021 - and prices are up sharply YoY (but the YoY change has been trending down).
This will be interesting to watch, but so far there isn't any evidence of a 2nd home slowdown in these numbers.
Housing Inventory May Have Bottomed Seasonally
by Calculated Risk on 3/14/2022 09:19:00 AM
Today, in the Calculated Risk Real Estate Newsletter: Housing Inventory May Have Bottomed Seasonally
A brief excerpt:
Last year inventory bottomed seasonally in April 2021 - very late in the year. This year, by this measure, it appears inventory bottomed seasonally at the beginning of March (we need a few more weeks of increasing inventory to confirm this).There is much more in the article. You can subscribe at https://calculatedrisk.substack.com/
Inventory is still very low. Compared to the same week in 2021, inventory is down 21.7%, and compared to the same week in 2020, and inventory is down 65.9% from 730 thousand.
One of the keys will be to watch the year-over-year change each week to see if the declines are decreasing. Here is a table of the year-over-year change by week since the beginning of the year.
Week Ending YoY Change 12/31/2021 -30.0% 1/7/2022 -26.0% 1/14/2022 -28.6% 1/21/2022 -27.1% 1/28/2022 -25.9% 2/4/2022 -27.9% 2/11/2022 -27.5% 2/18/2022 -25.8% 2/25/2022 -24.9% 3/4/2022 -24.2% 3/11/2022 -21.7%
Last week I wrote: "Based on the trend, it appears possible inventory bottomed seasonally last week, and will be up week-over-week in the next report." That happened.
Now we need to watch if the YoY change continues to decrease. Based on the current trend, it is possible inventory will be up YoY later this year.
Six High Frequency Indicators for the Economy
by Calculated Risk on 3/14/2022 08:38:00 AM
These indicators are mostly for travel and entertainment. It is interesting to watch these sectors recover as the pandemic subsides.
The TSA is providing daily travel numbers.
This data is as of March 14th.
 Click on graph for larger image.
This data shows the 7-day average of daily total traveler throughput from the TSA for 2019 (Light Blue), 2020 (Black), 2021 (Blue) and 2022 (Red).
The dashed line is the percent of 2019 for the seven-day average.
The 7-day average is down 14.3% from the same day in 2019 (85.7% of 2019). (Dashed line)
Air travel was picking up over the last few of weeks but turned down again last week (dashed line).
The second graph shows the 7-day average of the year-over-year change in diners as tabulated by OpenTable for the US and several selected cities.
IMPORTANT: OpenTable notes that all data is compared to 2019. Thanks!
 Thanks to OpenTable for providing this restaurant data:
This data is updated through March 9, 2022.
This data is "a sample of restaurants on the OpenTable network across all channels: online reservations, phone reservations, and walk-ins. For year-over-year comparisons by day, we compare to the same day of the week from the same week in the previous year."
Dining was mostly moving sideways but declined during the winter wave of COVID and is now increasing. The 7-day average for the US is down 7% compared to 2019.
Thanks to OpenTable for providing this restaurant data:This data is updated through March 9, 2022.
This data is "a sample of restaurants on the OpenTable network across all channels: online reservations, phone reservations, and walk-ins. For year-over-year comparisons by day, we compare to the same day of the week from the same week in the previous year."
Dining was mostly moving sideways but declined during the winter wave of COVID and is now increasing. The 7-day average for the US is down 7% compared to 2019.
 This data shows domestic box office for each week and the median for the years 2016 through 2019 (dashed light blue).
 Black is 2020, Blue is 2021 and Red is 2022.
The data is from BoxOfficeMojo through March 10th.
Note that the data is usually noisy week-to-week and depends on when blockbusters are released.
Movie ticket sales were at $216 million last week, up about 23% from the median for the week. Almost all of the ticket sales were for The Batman.
Note that the data is usually noisy week-to-week and depends on when blockbusters are released.
Movie ticket sales were at $216 million last week, up about 23% from the median for the week. Almost all of the ticket sales were for The Batman.
 This graph shows the seasonal pattern for the hotel occupancy rate using the four-week average.
 The red line is for 2022, black is 2020, blue is the median, and dashed light blue is for 2021.
This data is through March 5th. The occupancy rate was down 8.2% compared to the same week in 2019.
The 4-week average of the occupancy rate is close to the median rate for the previous 20 years (Blue).
Notes: Y-axis doesn't start at zero to better show the seasonal change.
Notes: Y-axis doesn't start at zero to better show the seasonal change.
The 4-week average of the occupancy rate will increase seasonally over the next few weeks.
This graph is from Apple mobility. From Apple: "This data is generated by counting the number of requests made to Apple Maps for directions in select countries/regions, sub-regions, and cities." This is just a general guide - people that regularly commute probably don't ask for directions.
 This data is through March 11th
 for the United States and several selected cities.
The graph is the running 7-day average to remove the impact of weekends.
IMPORTANT: All data is relative to January 13, 2020. This data is NOT Seasonally Adjusted. People walk and drive more when the weather is nice, so I'm just using the transit data.
According to the Apple data directions requests, public transit in the 7-day average for the US is at 118% of the January 2020 level.
Here is some interesting data on New York subway usage (HT BR).
 This graph is from Todd W Schneider.
 This graph shows how much MTA traffic has recovered in each borough (Graph starts at first week in January 2020 and 100 = 2019 average).
Manhattan is at about 37% of normal.
This data is through Friday, March 11th.
He notes: "Data updates weekly from the MTA’s public turnstile data, usually on Saturday mornings".
Sunday, March 13, 2022
Sunday Night Futures
by Calculated Risk on 3/13/2022 06:52:00 PM
Weekend:
• Schedule for Week of March 13, 2022
Monday:
• At 10:00 AM, State Employment and Unemployment (Monthly), January 2022
From CNBC: Pre-Market Data and Bloomberg futures S&P 500 futures are up 20, and and DOW futures are up 147 fair value).
Oil prices were down over the last week with WTI futures at $106.98 per barrel and Brent at $110.71 per barrel. A year ago, WTI was at $65, and Brent was at $69 - so WTI oil prices are up 65% year-over-year.
Here is a graph from Gasbuddy.com for nationwide gasoline prices. Nationally prices are at $4.30 per gallon. A year ago prices were at $2.85 per gallon, so gasoline prices are up $1.45 per gallon year-over-year.
FOMC Preview: Liftoff
by Calculated Risk on 3/13/2022 10:11:00 AM
Expectations are the FOMC will announce a 25bps rate hike at the meeting this week. In addition, the FOMC will hint at balance sheet reduction (runoff of assets / not reinvesting) and indicate further rate hikes at upcoming meetings.
The invasion of Ukraine will probably keep a 50bps rate hike off the table for now (the war is leading to a surge in prices, but the Fed cannot stop the war or end the pandemic with monetary policy).
From Merrill Lynch:
From Goldman last month:
1 Projections of change in real GDP and inflation are from the fourth quarter of the previous year to the fourth quarter of the year indicated.
The unemployment rate was at 3.8% in February. There will likely be a slight reduction in the unemployment rate forecast for Q4 2022.
2 Projections for the unemployment rate are for the average civilian unemployment rate in the fourth quarter of the year indicated.
As of January 2022, PCE inflation was up 6.1% from January 2021. It seems like the FOMC will revise up their inflation projections for 2022.
"We expect the Fed to kick off the rate hiking cycle at the March FOMC meeting with a 25bp increase in the fed funds target range to 0.25-0.50%. In addition, the Fed is likely to release an addendum to their “Principles for Reducing the Size of the Federal Reserve's Balance Sheet”, with specifics on caps for the unwinding of their holdings of Treasuries and agency securities. This will provide a strong signal that the Fed is ready to commence Quantitative Tightening (QT) as early as the following meeting in May ...These actions would be in line with Chair Powell’s messaging at the semi-annual monetary policy testimony in early March, in which he explicitly stated that he would propose and support a 25bp hike and that he expects the Committee to set the pace of balance sheet runoff at the next meeting."
emphasis added
Projections will be released at this meeting. Here are the December projections. In December, most participants expected 3 rate hikes in 2022, and now many analysts expect 7 rate hikes this year. A huge change!
"We are raising our Fed forecast to include seven consecutive 25bp rate hikes at each of the remaining FOMC meetings in 2022 (vs. five hikes in 2022 previously).”And from Merrill:
"Inflation is here and it continues to make its presence known everywhere. We remain comfortable with our hawkish call for the Fed to hike seven times this year."Wall Street forecasts are for GDP to barely increase in Q1 2022, and to be in the 2% to 3% range for 2022. This is a sharp reduction in Wall Street growth forecasts, and the FOMC will probably lower their 2022 forecast down to 3% or so.
| GDP projections of Federal Reserve Governors and Reserve Bank presidents, Change in Real GDP1 | ||||
|---|---|---|---|---|
| Projection Date | 2022 | 2023 | 2024 | |
| Dec 2021 | 3.6 to 4.5 | 2.0 to 2.5 | 1.8 to 2.0 | |
The unemployment rate was at 3.8% in February. There will likely be a slight reduction in the unemployment rate forecast for Q4 2022.
| Unemployment projections of Federal Reserve Governors and Reserve Bank presidents, Unemployment Rate2 | ||||
|---|---|---|---|---|
| Projection Date | 2022 | 2023 | 2024 | |
| Dec 2021 | 3.4 to 3.7 | 3.2 to 3.6 | 3.2 to 3.7 | |
As of January 2022, PCE inflation was up 6.1% from January 2021. It seems like the FOMC will revise up their inflation projections for 2022.
From Greg Ip at the WSJ: War in Ukraine Fans the Flames of Global Inflation
PCE core inflation was up 5.2% in January year-over-year.
"From the Russian Revolution to Vietnam, war has been a reliable precursor to inflation. History may be about to repeat as Russia’s invasion of Ukraine tilts the balance of global political and economic forces toward higher inflation."
| Inflation projections of Federal Reserve Governors and Reserve Bank presidents, PCE Inflation1 | ||||
|---|---|---|---|---|
| Projection Date | 2022 | 2023 | 2024 | |
| Dec 2021 | 2.2 to 3.0 | 2.1 to 2.5 | 2.0 to 2.2 | |
PCE core inflation was up 5.2% in January year-over-year.
| Core Inflation projections of Federal Reserve Governors and Reserve Bank presidents, Core Inflation1 | ||||
|---|---|---|---|---|
| Projection Date | 2022 | 2023 | 2024 | |
| Dec 2021 | 2.5 to 3.0 | 2.1 to 2.4 | 2.0 to 2.2 | |
Saturday, March 12, 2022
Real Estate Newsletter Articles this Week
by Calculated Risk on 3/12/2022 02:11:00 PM
At the Calculated Risk Real Estate Newsletter this week:
• 2nd Look at Local Housing Markets in February
• The Home ATM Open in Q4 2021; Closing in 2022
• 1st Look at Local Housing Markets in February
• Homebuilder Comments in February: “Demand is still high"
• Black Knight Mortgage Monitor for January; "$275 billion in equity withdrawn" in 2021
This is usually published several times a week and provides more in-depth analysis of the housing market.
The blog will continue as always!
You can subscribe at https://calculatedrisk.substack.com/ Most content is available for free (and no Ads), but please subscribe!
You can subscribe at https://calculatedrisk.substack.com/ Most content is available for free (and no Ads), but please subscribe!


