 RSS Feed
 by Calculated Risk on 3/16/2022 08:55:00 PM
Wednesday, March 16, 2022
Thursday: Housing Starts, Unemployment Claims, Philly Fed Mfg, Industrial Production
Thursday:
• At 8:30 AM ET, Housing Starts for February. The consensus is for 1.695 million SAAR, up from 1.638 million SAAR.
• Also at 8:30 AM, The initial weekly unemployment claims report will be released. The consensus is for a decrease to 225 thousand from 227 thousand last week.
• Also at 8:30 AM, the Philly Fed manufacturing survey for March. The consensus is for a reading of 15.0, down from 16.0.
• At 9:15 AM, The Fed will release Industrial Production and Capacity Utilization for February. The consensus is for a 0.5% increase in Industrial Production, and for Capacity Utilization to increase to 77.9%.
On COVID (focus on hospitalizations and deaths):
| COVID Metrics | ||||
|---|---|---|---|---|
| Now | Week Ago | Goal | ||
| Percent fully Vaccinated | 65.3% | --- | ≥70.0%1 | |
| Fully Vaccinated (millions) | 216.8 | --- | ≥2321 | |
| New Cases per Day3 | 30,934 | 36,852 | ≤5,0002 | |
| Hospitalized3 | 20,780 | 29,017 | ≤3,0002 | |
| Deaths per Day3 | 1,107 | 1,153 | ≤502 | |
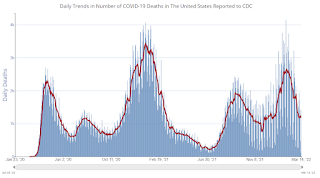
| 1 Minimum to achieve "herd immunity" (estimated between 70% and 85%). 2my goals to stop daily posts, 37-day average for Cases, Currently Hospitalized, and Deaths 🚩 Increasing 7-day average week-over-week for Cases, Hospitalized, and Deaths ✅ Goal met. | ||||
 Click on graph for larger image.
This graph shows the daily (columns) and 7-day average (line) of deaths reported.
Housing, the Fed, Interest Rates and Inflation
by Calculated Risk on 3/16/2022 04:43:00 PM
Today, in the Calculated Risk Real Estate Newsletter: Housing, the Fed, Interest Rates and Inflation
A brief excerpt:
It is important to understand that housing is a key transmission mechanism for Federal Open Market Committee (FOMC) policy. There are several channels according to economist Frederick Mishkin: Housing and the Monetary Transmission MechanismThere is much more in the article.By raising or lowering short-term interest rates, monetary policy affects the housing market, and in turn the overall economy, directly or indirectly through at least six channels: through the direct effects of interest rates on (1) the user cost of capital, (2) expectations of future house-price movements, and (3) housing supply; and indirectly through (4) standard wealth effects from house prices, (5) balance sheet, credit-channel effects on consumer spending, and (6) balance sheet, credit-channel effects on housing demand.So, when the FOMC raises rates, housing is a key target. For example, higher rates change the trade-off between buying and renting, and also changes the calculation for investors. Higher rates have already slowed down the “home ATM” (Mortgage Equity Withdrawal) and will likely impact demand (not yet!).
You can subscribe at https://calculatedrisk.substack.com/
FOMC Projections and Press Conference
by Calculated Risk on 3/16/2022 02:11:00 PM
Statement here.
Fed Chair Powell press conference video here starting at 2:30 PM ET.
Here are the projections. In December, most participants expected three rate hikes in 2022. Now, participants expect 7 rate hikes in 2022.
Wall Street forecasts are for GDP to barely increase in Q1 2022, and to be in the 2% to 3% range for 2022. This was a sharp reduction in Wall Street growth forecasts, and the FOMC lowered their 2022 forecast down significantly to similar growth rates.
| GDP projections of Federal Reserve Governors and Reserve Bank presidents, Change in Real GDP1 | ||||
|---|---|---|---|---|
| Projection Date | 2022 | 2023 | 2024 | |
| Mar 2022 | 2.5 to 3.0 | 2.1 to 2.5 | 1.8 to 2.0 | |
| Dec 2021 | 3.6 to 4.5 | 2.0 to 2.5 | 1.8 to 2.0 | |
The unemployment rate was at 3.8% in February. So, there was a slight reduction in the unemployment rate forecast for Q4 2022.
| Unemployment projections of Federal Reserve Governors and Reserve Bank presidents, Unemployment Rate2 | ||||
|---|---|---|---|---|
| Projection Date | 2022 | 2023 | 2024 | |
| Mar 2022 | 3.4 to 3.6 | 3.3 to 3.6 | 3.2 to 3.7 | |
| Dec 2021 | 3.4 to 3.7 | 3.2 to 3.6 | 3.2 to 3.7 | |
As of January 2022, PCE inflation was up 6.1% from January 2021. The FOMC revised up sharply their inflation projections for 2022.
| Inflation projections of Federal Reserve Governors and Reserve Bank presidents, PCE Inflation1 | ||||
|---|---|---|---|---|
| Projection Date | 2022 | 2023 | 2024 | |
| Mar 2022 | 4.1 to 4.7 | 2.3 to 3.0 | 2.1 to 2.4 | |
| Dec 2021 | 2.2 to 3.0 | 2.1 to 2.5 | 2.0 to 2.2 | |
PCE core inflation was up 5.2% in January year-over-year and the FOMC revised up their projections.
| Core Inflation projections of Federal Reserve Governors and Reserve Bank presidents, Core Inflation1 | ||||
|---|---|---|---|---|
| Projection Date | 2022 | 2023 | 2024 | |
| Mar 2022 | 3.9 to 4.4 | 2.4 to 3.0 | 2.1 to 2.4 | |
| Dec 2021 | 2.5 to 3.0 | 2.1 to 2.4 | 2.0 to 2.2 | |
FOMC Statement: Raise Rates 25bps
by Calculated Risk on 3/16/2022 02:03:00 PM
Fed Chair Powell press conference video here starting at 2:30 PM ET.
FOMC Statement:
Indicators of economic activity and employment have continued to strengthen. Job gains have been strong in recent months, and the unemployment rate has declined substantially. Inflation remains elevated, reflecting supply and demand imbalances related to the pandemic, higher energy prices, and broader price pressures.
The invasion of Ukraine by Russia is causing tremendous human and economic hardship. The implications for the U.S. economy are highly uncertain, but in the near term the invasion and related events are likely to create additional upward pressure on inflation and weigh on economic activity.
The Committee seeks to achieve maximum employment and inflation at the rate of 2 percent over the longer run. With appropriate firming in the stance of monetary policy, the Committee expects inflation to return to its 2 percent objective and the labor market to remain strong. In support of these goals, the Committee decided to raise the target range for the federal funds rate to 1/4 to 1/2 percent and anticipates that ongoing increases in the target range will be appropriate. In addition, the Committee expects to begin reducing its holdings of Treasury securities and agency debt and agency mortgage-backed securities at a coming meeting.
In assessing the appropriate stance of monetary policy, the Committee will continue to monitor the implications of incoming information for the economic outlook. The Committee would be prepared to adjust the stance of monetary policy as appropriate if risks emerge that could impede the attainment of the Committee's goals. The Committee's assessments will take into account a wide range of information, including readings on public health, labor market conditions, inflation pressures and inflation expectations, and financial and international developments.
Voting for the monetary policy action were Jerome H. Powell, Chair; John C. Williams, Vice Chair; Michelle W. Bowman; Lael Brainard; Esther L. George; Patrick Harker; Loretta J. Mester; and Christopher J. Waller. Voting against this action was James Bullard, who preferred at this meeting to raise the target range for the federal funds rate by 0.5 percentage point to 1/2 to 3/4 percent. Patrick Harker voted as an alternate member at this meeting.
emphasis added
NAHB: Builder Confidence Decreased to 79 in March
by Calculated Risk on 3/16/2022 10:08:00 AM
The National Association of Home Builders (NAHB) reported the housing market index (HMI) was at 79, down from 81 in February. Any number above 50 indicates that more builders view sales conditions as good than poor.
From the NAHB: Diminished Future Sales Expectations, Rising Costs Lower Builder Confidence
Ongoing lumber and building material supply-side constraints and rising construction costs and expectations of higher interest rates continue to negatively affect builder sentiment even as buyer demand remains relatively solid.
Builder confidence in the market for newly built single-family homes moved two points lower to 79 in March from a downwardly revised reading in February, according to the National Association of Home Builders (NAHB)/Wells Fargo Housing Market Index (HMI). This is the fourth straight month that builder sentiment has declined and the first time that the HMI has dipped below the 80-point mark since last September.
While builders continue to report solid buyer traffic numbers, helped by historically low existing home inventory and a persistent housing deficit, increasing development and construction costs have taken a toll on builder confidence.
The March HMI recorded the lowest future sales expectations in the survey since June 2020. Builders are reporting growing concerns that increasing construction costs (up 20% over the last 12 months) and expected higher interest rates connected to tightening monetary policy will price prospective home buyers out of the market. While low existing inventory and favorable demographics are supporting demand, the impact of elevated inflation and expected higher interest rates suggests caution for the second half of 2022.
...
The HMI index gauging current sales conditions fell three points to 86 and the gauge measuring sales expectations in the next six months dropped a whopping 10 points to 70. The component charting traffic of prospective buyers posted a two-point gain to 67.
Looking at the three-month moving averages for regional HMI scores, the Northeast fell seven points to 69, the Midwest dropped one point to 72 and the South fell three points to 83. The West moved up one point to 90.
emphasis added
 Click on graph for larger image.
This graph shows the NAHB index since Jan 1985.
This was below the consensus forecast, and still a strong reading.
Retail Sales Increased 0.3% in February
by Calculated Risk on 3/16/2022 08:42:00 AM
On a monthly basis, retail sales were increased 0.3% from January to February (seasonally adjusted), and sales were up 17.6 percent from February 2021.
From the Census Bureau report:
Advance estimates of U.S. retail and food services sales for February 2022, adjusted for seasonal variation and holiday and trading-day differences, but not for price changes, were $658.1 billion, an increase of 0.3 percent from the previous month, and 17.6 percent above February 2021. ... The December 2021 to January 2022 percent change was revised from up 3.8 percent to up 4.9 percent.
emphasis added
 Click on graph for larger image.
This graph shows retail sales since 1992. This is monthly retail sales and food service, seasonally adjusted (total and ex-gasoline).
Retail sales ex-gasoline were down 0.2% in February.
The second graph shows the year-over-year change in retail sales and food service (ex-gasoline) since 1993.
 Retail and Food service sales, ex-gasoline, increased by 16.1% on a YoY basis.
Sales in February were close to expectations, however, sales in December and January were revised up, combined.
MBA: Mortgage Applications Decrease in Latest Weekly Survey
by Calculated Risk on 3/16/2022 07:00:00 AM
From the MBA: Mortgage Applications Decrease in Latest MBA Weekly Survey
Mortgage applications decreased 1.2 percent from one week earlier, according to data from the Mortgage Bankers Association’s (MBA) Weekly Mortgage Applications Survey for the week ending March 11, 2022.
... The Refinance Index decreased 3 percent from the previous week and was 49 percent lower than the same week one year ago. The seasonally adjusted Purchase Index increased 1 percent from one week earlier. The unadjusted Purchase Index increased 2 percent compared with the previous week and was 8 percent lower than the same week one year ago.
“Mortgage rates continue to be volatile due to the significant uncertainty regarding Federal Reserve policy and the situation in Ukraine. Investors are weighing the impacts of rapidly increasing inflation in the U.S. and many other parts of the world against the potential for a slowdown in economic growth due to a renewed bout of supply-chain constraints,” said Joel Kan, MBA’s Associate Vice President of Economic and Industry Forecasting. “After declining two weeks ago, the 30-year fixed-rate mortgage increased last week to 4.27 percent – the highest since May 2019. Rates are now roughly a full percentage point higher than a year ago and continue to hamper refinance activity. Refinances declined for both conventional and government loans.”
Added Kan, “Purchase applications slightly increased, with both conventional and VA loan applications seeing gains. The average purchase application loan size remained elevated at $453,200 – the second highest amount in MBA’s survey.”
...
The average contract interest rate for 30-year fixed-rate mortgages with conforming loan balances ($647,200 or less) increased to 4.27 percent from 4.09 percent, with points increasing to 0.54 from 0.44 (including the origination fee) for 80 percent loan-to-value ratio (LTV) loans.
emphasis added
 Click on graph for larger image.
The first graph shows the refinance index since 1990.
With higher mortgage rates, the refinance index has declined sharply over the last several months.
Refinance activity will likely decline further in the survey next week since mortgage rates increased further this week.
The second graph shows the MBA mortgage purchase index
 According to the MBA, purchase activity is down 8% year-over-year unadjusted.
Note: Red is a four-week average (blue is weekly).
Tuesday, March 15, 2022
Wednesday: FOMC Statement, Retail Sales, Homebuilder Survey
by Calculated Risk on 3/15/2022 08:52:00 PM
Wednesday:
• At 7:00 AM ET, The Mortgage Bankers Association (MBA) will release the results for the mortgage purchase applications index.
• At 8:30 AM, Retail sales for February is scheduled to be released. The consensus is for a 0.4% increase in retail sales.
• At 10:00 AM, The March NAHB homebuilder survey. The consensus is for a reading of 81, down from 82. Any number above 50 indicates that more builders view sales conditions as good than poor.
• At 2:00 PM, FOMC Meeting Announcement. The FOMC is expected to raise the Fed Funds rate by 25bps at this meeting.
• At 2:00 PM, FOMC Forecasts This will include the Federal Open Market Committee (FOMC) participants' projections of the appropriate target federal funds rate along with the quarterly economic projections.
• At 2:30 PM, Fed Chair Jerome Powell holds a press briefing following the FOMC announcement.
On COVID (focus on hospitalizations and deaths):
| COVID Metrics | ||||
|---|---|---|---|---|
| Now | Week Ago | Goal | ||
| Percent fully Vaccinated | 65.3% | --- | ≥70.0%1 | |
| Fully Vaccinated (millions) | 216.8 | --- | ≥2321 | |
| New Cases per Day3 | 32,458 | 39,184 | ≤5,0002 | |
| Hospitalized3 | 21,260 | 30,474 | ≤3,0002 | |
| Deaths per Day3 | 1,186 | 1,211 | ≤502 | |
| 1 Minimum to achieve "herd immunity" (estimated between 70% and 85%). 2my goals to stop daily posts, 37-day average for Cases, Currently Hospitalized, and Deaths 🚩 Increasing 7-day average week-over-week for Cases, Hospitalized, and Deaths ✅ Goal met. | ||||
 Click on graph for larger image.
This graph shows the daily (columns) and 7-day average (line) of deaths reported.
3rd Look at Local Housing Markets in February
by Calculated Risk on 3/15/2022 01:38:00 PM
Today, in the Calculated Risk Real Estate Newsletter: 3rd Look at Local Housing Markets in February
A brief excerpt:
California doesn’t report monthly sales (not seasonally adjusted) or inventory, but here is the press release from the California Association of Realtors® (C.A.R.): California home sales edge higher in February amid geopolitical tensions and inflation uncertainty, C.A.R. reportsThere is much more in the article.February’s sales pace was down 4.5 percent on a monthly basis from 444,540 in January and was down 8.2 percent from a year ago ... California’s Unsold Inventory Index (UII) rose in February as active listings climbed from January to the highest level in three months. February’s UII was 2.0 months and 2.1 months in February 2021.Active Inventory in February
Here is a summary of active listings for these housing markets in February. Inventory was down 5.3% in February month-over-month (MoM) from January, and down 23.9% year-over-year (YoY).
It appears inventory has bottomed seasonally in some areas. Last month, these markets were down 26.5% YoY, so the YoY decline in February is smaller than in January. This isn’t indicating a slowing market, but maybe a few baby steps towards a more balanced market in some areas.
Notes for all tables:
1) New additions to table in BOLD.
2) Northwest (Seattle), North Texas (Dallas), and Santa Clara (San Jose), Jacksonville, Source: Northeast Florida Association of REALTORS®
3) otals do not include Atlanta, Denver, Minneapolis (included in state totals).
You can subscribe at https://calculatedrisk.substack.com/
Predicting the Next Recession
by Calculated Risk on 3/15/2022 09:51:00 AM
Way back in 2013, I wrote a post "Predicting the Next Recession. This post was in response to several recession forecasts (that were incorrect).
In that 2013 post, I wrote:
The next recession will probably be caused by one of the following (from least likely to most likely):Unfortunately, in 2020, one of these low probability events happened (pandemic, emphasis added), and that led to a recession in 2020.
3) An exogenous event such as a pandemic, significant military conflict, disruption of energy supplies for any reason, a major natural disaster (meteor strike, super volcano, etc), and a number of other low probability reasons. All of these events are possible, but they are unpredictable, and the probabilities are low that they will happen in the next few years or even decades.
2) Significant policy error. Two examples: not reaching a fiscal agreement and going off the "fiscal cliff" probably would have led to a recession, and Congress refusing to "pay the bills" would have been a policy error that would have taken the economy into recession.We've seen several policy errors over the last several years, mostly related to immigration and trade during the previous administration, but none that would lead the economy into a recession.
1) Most of the post-WWII recessions were caused by the Fed tightening monetary policy to slow inflation. I think this is the most likely cause of the next recession. Usually, when inflation starts to become a concern, the Fed tries to engineer a "soft landing", and frequently the result is a recession.And this most common cause of a recession is the current concern. With inflation picking up due to the pandemic (stimulus spending, supply constraints) and now due to the invasion of Ukraine, the Fed will embark this week on a tightening cycle to slow inflation.
The Fed cannot ease pandemic related supply constraints (except by curbing demand), and the Fed cannot stop the war. So, there is a possibility that the Fed will tighten too much and that will lead to a "hard landing" (aka recession).
The key will be to watch housing. Housing is the main transmission mechanism for Fed policy. We have already seen mortgage rates rise enough to sharply slow mortgage equity withdrawal, and further increases will likely slow housing.
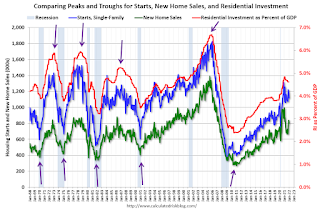
For the economy, what I focus on is single family starts and new home sales. For the bottoms and troughs for key housing activity, here is a graph of Single family housing starts, New Home Sales, and Residential Investment (RI) as a percent of GDP.
Note: The pandemic has distorted the economic data, and - as I've noted many times - we can't be a slave to any model.
 Click on graph for larger image.
The arrows point to some of the earlier peaks and troughs for these three measures.
The purpose of this graph is to show that these three indicators generally reach peaks and troughs together. Note that Residential Investment is quarterly and single-family starts and new home sales are monthly.
New home sales and single-family starts turned down last year, but this was because of the huge surge in sales and starts in the 2nd half of 2020.
 The second graph shows the YoY change in New Home Sales from the Census Bureau.
Note: the New Home Sales data is smoothed using a three month centered average before calculating the YoY change. The Census Bureau data starts in 1963.
Some observations:
1) When the YoY change in New Home Sales falls about 20%, usually a recession will follow. An exception for this data series was the mid '60s when the Vietnam buildup kept the economy out of recession. Another exception was the recent situation - we saw a YoY decline in new home sales related to the pandemic and the surge in new home sales in the second half of 2020.
Also note that the sharp decline in 2010 was related to the housing tax credit policy in 2009 - and was just a continuation of the housing bust.
2) It is also interesting to look at the '86/'87 and the mid '90s periods. New Home sales fell in both of these periods, although not quite 20%. As I noted in earlier posts, the mid '80s saw a surge in defense spending and MEW that more than offset the decline in New Home sales. In the mid '90s, nonresidential investment remained strong.
If the Fed tightening cycle will lead to a recession, we should see housing turn down first (new home sales, single family starts, residential investment). There are other indicators too - such as the yield curve and heavy truck sales - but mostly I'll be watching housing. (I'm not currently on recession watch)


