 RSS Feed
 by Calculated Risk on 3/18/2022 02:05:00 PM
Friday, March 18, 2022
Q1 GDP Forecasts: Around 1%
From BofA:
This week's data-retail sales, industrial production, and import & export prices- on balance lifted our 1Q GDP tracking estimate by 0.6ppt to 1.6% qoq saar. [March 18 estimate]From Goldman:
emphasis added
Following today’s data, we left our Q1 GDP tracking estimate unchanged at +0.5% (qoq ar). [March 18 estimate]And from the Altanta Fed: GDPNow
The GDPNow model estimate for real GDP growth (seasonally adjusted annual rate) in the first quarter of 2022 is 1.3 percent on March 17, up from 1.2 percent on March 16. After this morning’s releases from the US Census Bureau and the Federal Reserve Board of Governors, the nowcast of first-quarter real gross private domestic investment growth increased from -4.9 percent to -4.2 percent. [March 17 estimate]
More Analysis on February Existing Home Sales
by Calculated Risk on 3/18/2022 11:06:00 AM
Today, in the CalculatedRisk Real Estate Newsletter: NAR: Existing-Home Sales Decreased to 6.02 million SAAR in February
Excerpt:
The Impact of the February 2021 Texas FreezeThere is much more in the post. You can subscribe at https://calculatedrisk.substack.com/ (Most content is available for free, so please subscribe).
When the local data was released, I highlighted the sharp increase in sales in Houston (up 25.6% year-over-year). From the Houston Association of REALTORS® (HAR): February Is a Strong Month for Houston Home SalesHome sales scored double-digit gains in February, but part of the strong showing was because the statistics compared to last February, when that deadly Texas freeze halted real estate activity for days, and in some cases, even longer. Undistorted by the weather factor were the continued squeeze on inventory, which returned to its all-time low, and pricing, which due to limited supply and ongoing consumer demand, soared to record highs.In February 2022, the only region that showed a year-over-year increase was the South (an increase from the weak sales in 2021 due to the freeze). The other regions were down an average of 6.7% year-over-year compared to the 2.4% reported by the NAR for the entire country.
emphasis added
...
This graph shows existing home sales by month for 2021 and 2022.
Sales declined 2.3% year-over-year compared to January 2021. This was the seventh consecutive month with sales down year-over-year.
...
[and on inventory] According to the NAR, inventory increased to 0.87 million in February from 0.85 million in January. Inventory is now just above the record low.

NAR: Existing-Home Sales Decreased to 6.02 million SAAR in February
by Calculated Risk on 3/18/2022 10:12:00 AM
From the NAR: Existing-Home Sales Fade 7.2% in February
Existing-home sales dipped in February, continuing a seesawing pattern of gains and declines over the last few months, according to the National Association of Realtors®. Each of the four major U.S. regions saw sales fall on a month-over-month basis in February. Sales activity year-over-year was also down overall, though the South experienced an increase while the remaining three regions reported drops in transactions.
Total existing-home sales, completed transactions that include single-family homes, townhomes, condominiums and co-ops, sank 7.2% from January to a seasonally adjusted annual rate of 6.02 million in February. Year-over-year, sales decreased 2.4% (6.17 million in February 2021).
...
Total housing inventory at the end of February totaled 870,000 units, up 2.4% from January and down 15.5% from one year ago (1.03 million). Unsold inventory sits at a 1.7-month supply at the current sales pace, up from the record-low supply in January of 1.6 months and down from 2.0 months in February 2021.
emphasis added
 Click on graph for larger image.
This graph shows existing home sales, on a Seasonally Adjusted Annual Rate (SAAR) basis since 1993.
Sales in February (6.02 million SAAR) were down 7.2% from the previous month and were 2.4% below the February 2021 sales rate.
The second graph shows nationwide inventory for existing homes.
 According to the NAR, inventory increased to 0.87 million in February from 0.85 million in January.
Headline inventory is not seasonally adjusted, and inventory usually decreases to the seasonal lows in December and January, and peaks in mid-to-late summer.
The last graph shows the year-over-year (YoY) change in reported existing home inventory and months-of-supply. Since inventory is not seasonally adjusted, it really helps to look at the YoY change. Note: Months-of-supply is based on the seasonally adjusted sales and not seasonally adjusted inventory.
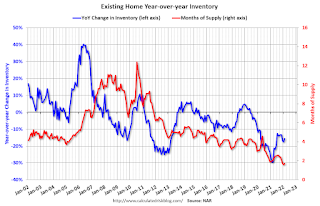 Inventory was down 15.5% year-over-year (blue) in February compared to February 2021.
Months of supply (red) increased to 1.7 months in February from 1.6 months in January.
This was below the consensus forecast. I'll have more later.
The last graph shows the year-over-year (YoY) change in reported existing home inventory and months-of-supply. Since inventory is not seasonally adjusted, it really helps to look at the YoY change. Note: Months-of-supply is based on the seasonally adjusted sales and not seasonally adjusted inventory.
 Inventory was down 15.5% year-over-year (blue) in February compared to February 2021.
 Months of supply (red) increased to 1.7 months in February from 1.6 months in January.
This was below the consensus forecast. I'll have more later.
Hotels: Occupancy Rate Down 10% Compared to Same Week in 2019
by Calculated Risk on 3/18/2022 08:30:00 AM
Overall U.S. hotel performance increased from the previous week, according to STR‘s latest data through March 12.The following graph shows the seasonal pattern for the hotel occupancy rate using the four-week average.
March 6-12, 2022 (percentage change from comparable week in 2019*):
• Occupancy: 63.2% (-9.8%)
• Average daily rate (ADR): $144.68 (+7.7%)
• Revenue per available room (RevPAR): $91.45 (-2.8%)
*Due to the pandemic impact, STR is measuring recovery against comparable time periods from 2019.
emphasis added
 Click on graph for larger image.
The red line is for 2022, black is 2020, blue is the median, and dashed light blue is for 2021.
The 4-week average of the occupancy rate is close to the median rate for the previous 20 years (Blue).
Note: Y-axis doesn't start at zero to better show the seasonal change.
The 4-week average of the occupancy rate will increase seasonally over the next few weeks.
Thursday, March 17, 2022
Friday: Existing Home Sales
by Calculated Risk on 3/17/2022 08:54:00 PM
Thursday:
• At 10:00 AM: Existing Home Sales for February from the National Association of Realtors (NAR). The consensus is for 6.16 million SAAR, down from 6.50 million. Housing economist Tom Lawler expects the NAR to report 5.97 million SAAR.
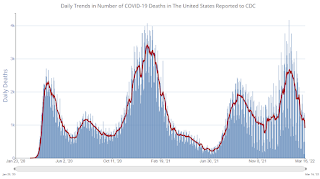
On COVID (focus on hospitalizations and deaths):
| COVID Metrics | ||||
|---|---|---|---|---|
| Now | Week Ago | Goal | ||
| Percent fully Vaccinated | 65.3% | --- | ≥70.0%1 | |
| Fully Vaccinated (millions) | 216.9 | --- | ≥2321 | |
| New Cases per Day3 | 30,040 | 36,009 | ≤5,0002 | |
| Hospitalized3 | 20,780 | 29,017 | ≤3,0002 | |
| Deaths per Day3 | 909 | 1,187 | ≤502 | |
| 1 Minimum to achieve "herd immunity" (estimated between 70% and 85%). 2my goals to stop daily posts, 37-day average for Cases, Currently Hospitalized, and Deaths 🚩 Increasing 7-day average week-over-week for Cases, Hospitalized, and Deaths ✅ Goal met. | ||||
 Click on graph for larger image.
This graph shows the daily (columns) and 7-day average (line) of deaths reported.
Lawler: Early Read on Existing Home Sales in February
by Calculated Risk on 3/17/2022 02:02:00 PM
From housing economist Tom Lawler:
Based on publicly-available local realtor/MLS reports released across the country through today, I project that existing home sales as estimated by the National Association of Realtors ran at a seasonally adjusted annual rate of 5.97 million in February, down 8.2% from January’s preliminary pace and down 3.2% from last February’s seasonally adjusted pace.
Local realtor reports, as well as reports from national inventory trackers, suggest that the YOY % decline in the inventory of existing homes for sale last month was lower than that in January.
Finally, local realtor/MLS reports suggest the median existing single-family home sales price last month was up by about 16.5% from last February.
CR Note: The National Association of Realtors (NAR) is scheduled to release February existing home sales tomorrow, Friday, March 18, 2022, at 10:00 AM ET. The consensus is for 6.16 million SAAR.
February Housing Starts: Most Housing Units Under Construction Since 1973
by Calculated Risk on 3/17/2022 10:03:00 AM
Today, in the CalculatedRisk Real Estate Newsletter: February Housing Starts: Most Housing Units Under Construction Since 1973
Excerpt:
The fourth graph shows housing starts under construction, Seasonally Adjusted (SA).There is much more in the post. You can subscribe at https://calculatedrisk.substack.com/ (Most content is available for free, so please subscribe).
Red is single family units. Currently there are 799 thousand single family units under construction (SA). This is the highest level since December 2006.
For single family, many of these homes are already sold (Census counts sales when contract is signed). The reason there are so many homes is probably due to construction delays. Since many of these are already sold, it is unlikely this is “overbuilding”, or that this will impact prices (although the buyers will be moving out of their current home or apartment once these homes are completed).
Blue is for 2+ units. Currently there are 784 thousand multi-family units under construction. This is the highest level since June 1974! For multi-family, construction delays are probably also a factor. The completion of these units should help with rent pressure.
Combined, there are 1.583 million units under construction. This is the most since August 1973.
Length of Time from Authorization to Start and from Start to Completion
Census released the annual data on the length of time from start to completion, and this showed construction delays in 2021.
In 2021, it took an average of 7.2 months from start to completion for single family homes, up from 6.8 months in 2020. For multi-family, it took 15.4 months for buildings with 2 or more units in 2021, the same as in 2020 (the long delays will likely show up in the 2022 data since it takes over a year to complete).
From Authorization to Start, it took 1.3 months in 2021 for single family homes, up from 1.0 months in 2020, and it took 2.1 months in 2021 for multi-family, up from 2.0 months.
Industrial Production Increased 0.5 Percent in February
by Calculated Risk on 3/17/2022 09:22:00 AM
From the Fed: Industrial Production and Capacity Utilization
Total industrial production rose 0.5 percent in February to a level that is 103.6 percent of its 2017 average. Manufacturing output increased 1.2 percent after having been little changed in each of the previous two months. In February, the index for utilities declined 2.7 percent, and the output of mines edged up 0.l percent.
Total industrial production in February was 7.5 percent higher than its year-earlier level, but severe winter weather in February 2021 significantly suppressed industrial activity that month. A more useful comparison shows that the index has advanced a still-strong 4.2 percent since January 2021. Capacity utilization for the industrial sector increased 0.3 percentage point in February to 77.6 percent, a rate that is 1.9 percentage points below its long-run (1972–2021) average.
emphasis added
 Click on graph for larger image.
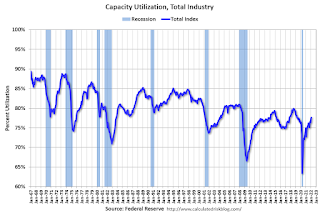
This graph shows Capacity Utilization. This series is up from the record low set in April 2020, and above the level in February 2020 (pre-pandemic).
Capacity utilization at 77.6% is 1.9% below the average from 1972 to 2020. This was below consensus expectations.
Note: y-axis doesn't start at zero to better show the change.
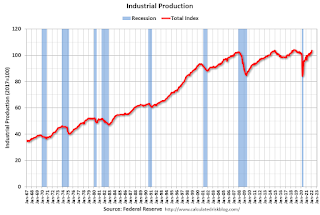 The second graph shows industrial production since 1967.
Industrial production increased in February to 103.6. This is above the February 2020 level.
The change in industrial production was at consensus expectations.
Housing Starts Increased to 1.769 million Annual Rate in February
by Calculated Risk on 3/17/2022 08:42:00 AM
From the Census Bureau: Permits, Starts and Completions
Housing Starts:
Privately‐owned housing starts in February were at a seasonally adjusted annual rate of 1,769,000. This is 6.8 percent above the revised January estimate of 1,657,000 and is 22.3 percent above the February 2021 rate of 1,447,000. Single‐family housing starts in February were at a rate of 1,215,000; this is 5.7 percent above the revised January figure of 1,150,000. The February rate for units in buildings with five units or more was 501,000.
Building Permits:
Privately‐owned housing units authorized by building permits in February were at a seasonally adjusted annual rate of 1,859,000. This is 1.9 percent below the revised January rate of 1,895,000, but is 7.7 percent above the February 2021 rate of 1,726,000. Single‐family authorizations in February were at a rate of 1,207,000; this is 0.5 percent below the revised January figure of 1,213,000. Authorizations of units in buildings with five units or more were at a rate of 597,000 in February.
emphasis added
 Click on graph for larger image.
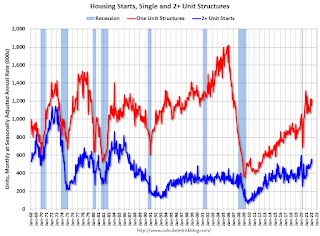
The first graph shows single and multi-family housing starts for the last several years.
Multi-family starts (blue, 2+ units) increased in February compared to January. Multi-family starts were up 46.5% year-over-year in February. Note: Last year, starts were impacted by the freeze in Texas.
Single-family starts (red) increased in February and were up 13.7% year-over-year.
 The second graph shows single and multi-family housing starts since 1968.
 This shows the huge collapse following the housing bubble, and then the eventual recovery (but still not historically high).
Total housing starts in February were above expectations, and starts in December and January were revised up, combined.
I'll have more later …
Weekly Initial Unemployment Claims Decrease to 214,000
by Calculated Risk on 3/17/2022 08:33:00 AM
The DOL reported:
In the week ending March 12, the advance figure for seasonally adjusted initial claims was 214,000, a decrease of 15,000 from the previous week's revised level. The previous week's level was revised up by 2,000 from 227,000 to 229,000. The 4-week moving average was 223,000, a decrease of 8,750 from the previous week's revised average. The previous week's average was revised up by 500 from 231,250 to 231,750.The following graph shows the 4-week moving average of weekly claims since 1971.
emphasis added
 Click on graph for larger image.
The dashed line on the graph is the current 4-week average. The four-week average of weekly unemployment claims decreased to 223,000.
The previous week was revised up.
Weekly claims were lower than the consensus forecast.


