 RSS Feed
 by Calculated Risk on 3/22/2022 09:29:00 AM
Tuesday, March 22, 2022
Goldman: Expecting Fed to hike 50bps in May and Start Balance Sheet Reduction
A few excerpt from a Goldman Sachs research note: Moving “Expeditiously” Implies a Faster Pace; Forecasting 50bp Hikes in May and June
In a speech [yesterday], Chair Powell said, “There is an obvious need to move expeditiously to return the stance of monetary policy to a more neutral level, and then to move to more restrictive levels if that is what is required to restore price stability.” He repeated the call “to move expeditiously” at the end of the speech. ... We now forecast 50bp hikes at both the May and June meetings, followed by 25bp hikes at the four remaining meetings in the back half of 2022 ... We continue to expect the FOMC to announce the start of balance sheet reduction at the May meeting.CNBC's Steve Liesman tweeted this morning:
emphasis added
"The Dec. Fed Funds contract trades with an implied yield of 2.13... that means 7 MORE hikes from here or 8 total this year. At least one of those meetings needs to be 50bp. The 50bp probability for May is 68%. There is also going to be balance sheet reduction."So a 50bps hike - and balance sheet reduction - are becoming the consensus view.
Monday, March 21, 2022
Tuesday: Richmond Fed Mfg
by Calculated Risk on 3/21/2022 09:00:00 PM
From Matthew Graham at Mortgage News Daily: From Bad to Worse as Powell Doubles Down on Policy Shift
Things were already fairly ugly this morning as the bond market opted to pay no attention to last Friday's consolidation potential. Fed Funds Futures showed the market pricing in at least one 50bp hike in addition to a 25bp hike at every remaining Fed meeting this year. Powell's scheduled speech added a significant amount of fuel to that fire at 12:30pm. He did nothing to try to calm the market down, but instead, essentially told traders they were correct in rushing to price in more rate hikes and faster policy normalization. This resulted in overnight losses more than doubling across the curve, and widespread negative reprices. [30 year fixed 4.66%]Tuesday:
emphasis added
• At 10:00 AM ET, Richmond Fed Survey of Manufacturing Activity for March.
On COVID (focus on hospitalizations and deaths):
| COVID Metrics | ||||
|---|---|---|---|---|
| Now | Week Ago | Goal | ||
| Percent fully Vaccinated | 65.4% | --- | ≥70.0%1 | |
| Fully Vaccinated (millions) | 217.1 | --- | ≥2321 | |
| New Cases per Day3 | 27,786 | 33,721 | ≤5,0002 | |
| Hospitalized3 | 18,203 | 25,105 | ≤3,0002 | |
| Deaths per Day3 | 901 | 1,187 | ≤502 | |
| 1 Minimum to achieve "herd immunity" (estimated between 70% and 85%). 2my goals to stop daily posts, 37-day average for Cases, Currently Hospitalized, and Deaths 🚩 Increasing 7-day average week-over-week for Cases, Hospitalized, and Deaths ✅ Goal met. | ||||
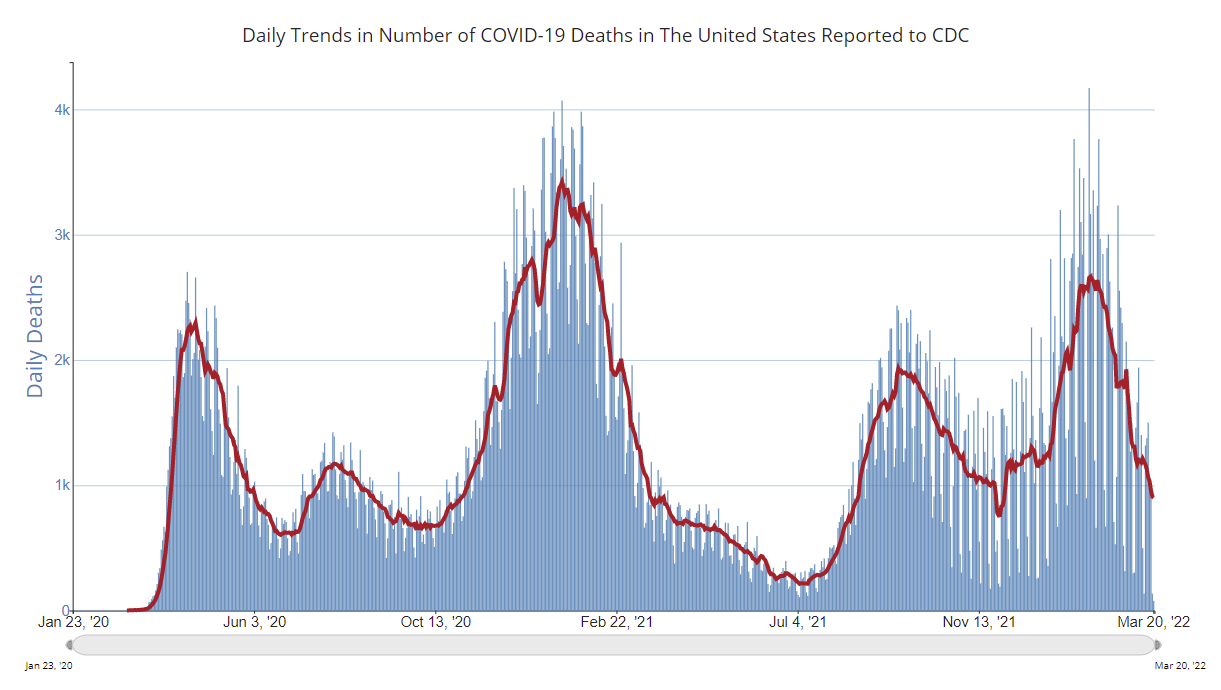 Click on graph for larger image.
This graph shows the daily (columns) and 7-day average (line) of deaths reported.
MBA Survey: "Share of Mortgage Loans in Forbearance Decreases to 1.18% in February"
by Calculated Risk on 3/21/2022 04:00:00 PM
Note: This is as of February 28th.
From the MBA: Share of Mortgage Loans in Forbearance Decreases to 1.18% in February
The Mortgage Bankers Association’s (MBA) monthly Loan Monitoring Survey revealed that the total number of loans now in forbearance decreased by 12 basis points from 1.30% of servicers’ portfolio volume in the prior month to 1.18% as of February 28, 2022. According to MBA’s estimate, 590,000 homeowners are in forbearance plans.
The share of Fannie Mae and Freddie Mac loans in forbearance decreased 8 basis points to 0.56%. Ginnie Mae loans in forbearance decreased 10 basis points to 1.50%, and the forbearance share for portfolio loans and private-label securities (PLS) declined 30 basis points to 2.72%
“There were many positive results in overall mortgage performance in February. The percentage of borrowers in forbearance declined for the 21st consecutive month, and the percentage of borrowers current on their mortgage payments increased to almost 95 percent – 350 basis points higher than one year ago. Finally, the percentage of borrowers with existing loan workouts who were current on their mortgage payments improved for the first time since June 2021,” said Marina Walsh, CMB, MBA’s Vice President of Industry Analysis. “These three results – the lower forbearance rates and higher performance rates for both total borrowers and borrowers in workouts – are especially favorable given that there is typically a dip in mortgage performance in February because of the shortened number of days to make a payment.”
Added Walsh, “We can credit several factors to the improved performance, including the availability of viable loss mitigation options, low unemployment that is now below 4.0 percent, strong wage growth, and rising home equity."
emphasis added
 Click on graph for larger image.
This graph shows the percent of portfolio in forbearance by investor type over time. The number of forbearance plans is decreasing.
Final Look at Local Housing Markets in February
by Calculated Risk on 3/21/2022 03:10:00 PM
Today, in the Calculated Risk Real Estate Newsletter: Final Look at Local Housing Markets in February
A brief excerpt:
This update adds Columbus, Illinois, Indiana, Maryland, Miami, New York, Pennsylvania, Phoenix, Rhode Island and Washington, D.C.There is much more in the article. You can subscribe at https://calculatedrisk.substack.com/
My view is that if the housing market starts slowing, it will show up in inventory first.
...
Here is a summary of active listings for these housing markets in February. Inventory was down 3.8% in February month-over-month (MoM) from January, and down 28.0% year-over-year (YoY).
It appears inventory has bottomed seasonally in some areas. Last month, these markets were down 30.5% YoY, so the YoY decline in February is smaller than in January. This isn’t indicating a slowing market, but maybe a few baby steps towards a more balanced market in some areas.
Notes for all tables:
1. New additions to table in BOLD.
2. Northwest (Seattle), North Texas (Dallas), and Santa Clara (San Jose), Jacksonville, Source: Northeast Florida Association of REALTORS®
3. Totals do not include Atlanta, Denver, Minneapolis (included in state totals).

Fed Chair Powell: FOMC "Not assuming significant near-term supply-side relief" on inflation
by Calculated Risk on 3/21/2022 12:34:00 PM
From Fed Chair Powell: Restoring Price Stability. Excerpt on inflation:
Turning to price stability, the inflation outlook had deteriorated significantly this year even before Russia's invasion of Ukraine.
The rise in inflation has been much greater and more persistent than forecasters generally expected. For example, at the time of our June 2021 meeting, every Federal Open Market Committee (FOMC) participant and all but one of 35 submissions in the Survey of Professional Forecasters predicted that 2021 inflation would be below 4 percent. Inflation came in at 5.5 percent.
For a time, moderate inflation forecasts looked plausible—the one-month headline and core inflation rates declined steadily from April through September. But inflation moved up sharply in the fall, and, just since our December meeting, the median FOMC projection for year-end 2022 jumped from 2.6 percent to 4.3 percent.
Why have forecasts been so far off? In my view, an important part of the explanation is that forecasters widely underestimated the severity and persistence of supply-side frictions, which, when combined with strong demand, especially for durable goods, produced surprisingly high inflation.
The pandemic and the associated shutdown and reopening of the economy caused a serious upheaval in many parts of the economy, snarling supply chains, constraining labor supply, and creating a major boom in demand for goods and a bust in services demand. The combination of the surge in goods demand with supply chain bottlenecks led to sharply rising goods prices (figure 4). The most notable example here is motor vehicles. Prices soared across the vehicles sector as booming demand was met by a sharp decline in global production during the summer of 2021, owing to shortages of computer chips. Production remains below pre-pandemic levels, and an expected sharp decline in prices has been repeatedly postponed.
Many forecasters, including FOMC participants, had been expecting inflation to cool in the second half of last year, as the economy started going back to normal after vaccines became widely available.3 Expectations were that the supply-side damage would begin to heal. Schools would reopen—freeing parents to return to work—and labor supply would begin bouncing back, kinks in supply chains would begin resolving, and consumption would start rotating back to services, all of which could reduce price pressures. While schools are open, none of the other expectations has been fully met. Part of the reason may be that, contrary to expectations, COVID has not gone away with the arrival of vaccines. In fact, we are now headed once again into more COVID-related supply disruptions from China. It continues to seem likely that hoped-for supply-side healing will come over time as the world ultimately settles into some new normal, but the timing and scope of that relief are highly uncertain. In the meantime, as we set policy, we will be looking to actual progress on these issues and not assuming significant near-term supply-side relief.
emphasis added
Housing Inventory March 21st Update: Inventory down slightly Week-over-week; Up 3% from 2 weeks Ago
by Calculated Risk on 3/21/2022 09:36:00 AM
Tracking existing home inventory is very important in 2022.
Inventory usually declines in the winter, and then increases in the spring. It appears that inventory bottomed seasonally at the beginning of March.
 Click on graph for larger image in graph gallery.
This inventory graph is courtesy of Altos Research.
As of March 18th, inventory was at 248 thousand (7-day average), compared to 316 thousand for the same week a year ago. That is a decline of 21.7%.
A week ago, inventory was at 249 thousand, and was also down 21.7% YoY.
Inventory was down 0.4% from the previous week, and UP 2.7% from the seasonal low at the beginning of March.
Compared to the same week in 2020, inventory is down 66.4% from 738 thousand.
Last year inventory bottomed seasonally in April 2021 - very late in the year. This year it appears inventory bottomed seasonally at the beginning of March (we need a few more weeks of increasing inventory to confirm this).
| Week Ending | YoY Change |
|---|---|
| 12/31/2021 | -30.0% |
| 1/7/2022 | -26.0% |
| 1/14/2022 | -28.6% |
| 1/21/2022 | -27.1% |
| 1/28/2022 | -25.9% |
| 2/4/2022 | -27.9% |
| 2/11/2022 | -27.5% |
| 2/18/2022 | -25.8% |
| 2/25/2022 | -24.9% |
| 3/4/2022 | -24.2% |
| 3/11/2022 | -21.7% |
| 3/18/2022 | -21.7% |
Mike Simonsen discusses this data regularly on Youtube.
Six High Frequency Indicators for the Economy
by Calculated Risk on 3/21/2022 08:38:00 AM
These indicators are mostly for travel and entertainment. It is interesting to watch these sectors recover as the pandemic subsides.
The TSA is providing daily travel numbers.
This data is as of March 20th.
 Click on graph for larger image.
This data shows the 7-day average of daily total traveler throughput from the TSA for 2019 (Light Blue), 2020 (Black), 2021 (Blue) and 2022 (Red).
The dashed line is the percent of 2019 for the seven-day average.
The 7-day average is down 10.5% from the same day in 2019 (89.5% of 2019). (Dashed line)
Air travel was picking up over the last few of weeks.
The second graph shows the 7-day average of the year-over-year change in diners as tabulated by OpenTable for the US and several selected cities.
IMPORTANT: OpenTable notes that all data is compared to 2019. Thanks!
 Thanks to OpenTable for providing this restaurant data:
This data is updated through March 19, 2022.
This data is "a sample of restaurants on the OpenTable network across all channels: online reservations, phone reservations, and walk-ins. For year-over-year comparisons by day, we compare to the same day of the week from the same week in the previous year."
Dining was mostly moving sideways but declined during the winter wave of COVID and is now increasing. The 7-day average for the US is unchanged compared to 2019.
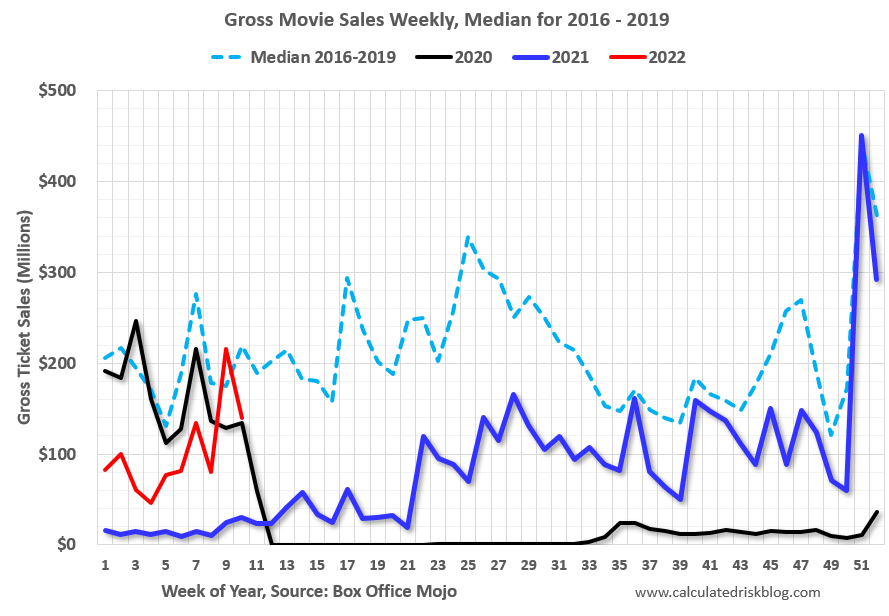 This data shows domestic box office for each week and the median for the years 2016 through 2019 (dashed light blue).
 Black is 2020, Blue is 2021 and Red is 2022.
The data is from BoxOfficeMojo through March 17th.
Note that the data is usually noisy week-to-week and depends on when blockbusters are released.
Movie ticket sales were at $140 million last week, down about 36% from the median for the week.
Note that the data is usually noisy week-to-week and depends on when blockbusters are released.
Movie ticket sales were at $140 million last week, down about 36% from the median for the week.
 This graph shows the seasonal pattern for the hotel occupancy rate using the four-week average.
 The red line is for 2022, black is 2020, blue is the median, and dashed light blue is for 2021.
This data is through March 12th. The occupancy rate was down 9.8% compared to the same week in 2019.
The 4-week average of the occupancy rate is close to the median rate for the previous 20 years (Blue).
Notes: Y-axis doesn't start at zero to better show the seasonal change.
Notes: Y-axis doesn't start at zero to better show the seasonal change.
The 4-week average of the occupancy rate will increase seasonally over the next few weeks.
This graph is from Apple mobility. From Apple: "This data is generated by counting the number of requests made to Apple Maps for directions in select countries/regions, sub-regions, and cities." This is just a general guide - people that regularly commute probably don't ask for directions.
 This data is through March 17th
 for the United States and several selected cities.
The graph is the running 7-day average to remove the impact of weekends.
IMPORTANT: All data is relative to January 13, 2020. This data is NOT Seasonally Adjusted. People walk and drive more when the weather is nice, so I'm just using the transit data.
According to the Apple data directions requests, public transit in the 7-day average for the US is at 123% of the January 2020 level.
Here is some interesting data on New York subway usage (HT BR).
 This graph is from Todd W Schneider.
 This graph shows how much MTA traffic has recovered in each borough (Graph starts at first week in January 2020 and 100 = 2019 average).
Manhattan is at about 37% of normal.
This data is through Friday, March 18th.
He notes: "Data updates weekly from the MTA’s public turnstile data, usually on Saturday mornings".
Sunday, March 20, 2022
Monday: Fed Chair Powell "Economic Outlook"
by Calculated Risk on 3/20/2022 07:14:00 PM
Weekend:
• Schedule for Week of March 20, 2022
Monday:
• At 8:30 AM ET, Chicago Fed National Activity Index for February. This is a composite index of other data.
• At 12:00 PM, Speech, Fed Chair Powell, Economic Outlook, At the National Association for Business Economics (NABE) Annual Economic Policy Conference, Washington, D.C
From CNBC: Pre-Market Data and Bloomberg futures S&P 500 and DOW futures are mostly unchanged fair value).
Oil prices were down over the last week with WTI futures at $106.00 per barrel and Brent at $109.01 per barrel. A year ago, WTI was at $61, and Brent was at $64 - so WTI oil prices are up 75% year-over-year.
Here is a graph from Gasbuddy.com for nationwide gasoline prices. Nationally prices are at $4.23 per gallon. A year ago prices were at $2.86 per gallon, so gasoline prices are up $1.37 per gallon year-over-year.
LA Area Port Traffic: Record February Inbound Traffic
by Calculated Risk on 3/20/2022 08:30:00 AM
Notes: The expansion to the Panama Canal was completed in 2016 (As I noted a few years ago), and some of the traffic that used the ports of Los Angeles and Long Beach is probably going through the canal. This might be impacting TEUs on the West Coast.
Container traffic gives us an idea about the volume of goods being exported and imported - and usually some hints about the trade report since LA area ports handle about 40% of the nation's container port traffic.
The following graphs are for inbound and outbound traffic at the ports of Los Angeles and Long Beach in TEUs (TEUs: 20-foot equivalent units or 20-foot-long cargo container).
To remove the strong seasonal component for inbound traffic, the first graph shows the rolling 12-month average.
 Click on graph for larger image.
On a rolling 12-month basis, inbound traffic was up 0.3% in February compared to the rolling 12 months ending in January. Outbound traffic was down 0.3% compared to the rolling 12 months ending the previous month.
The 2nd graph is the monthly data (with a strong seasonal pattern for imports).
 Usually imports peak in the July to October period as retailers import goods for the Christmas holiday, and then decline sharply and bottom in February or March depending on the timing of the Chinese New Year.
As expected, there wasn't a dip in February this year with ships still backed up waiting to unload.
Imports were up 4% YoY in February, and exports were down 3% YoY.
This was record inbound traffic for the month of February.
Saturday, March 19, 2022
Real Estate Newsletter Articles this Week
by Calculated Risk on 3/19/2022 02:11:00 PM
At the Calculated Risk Real Estate Newsletter this week:
• NAR: Existing-Home Sales Decreased to 6.02 million SAAR in February
• February Housing Starts: Most Housing Units Under Construction Since 1973
• Housing, the Fed, Interest Rates and Inflation Housing is a key transmission mechanism for the FOMC
• 3rd Look at Local Housing Markets in February California Sales Down 8.2% YoY, Inventory up from January
• Housing Inventory May Have Bottomed Seasonally
This is usually published several times a week and provides more in-depth analysis of the housing market.
The blog will continue as always!
You can subscribe at https://calculatedrisk.substack.com/ Most content is available for free (and no Ads), but please subscribe!
You can subscribe at https://calculatedrisk.substack.com/ Most content is available for free (and no Ads), but please subscribe!


