by Calculated Risk on 3/23/2022 11:36:00 AM
Wednesday, March 23, 2022
February New Home Sales: Few Completed Inventory, High Number of Homes Under Construction
Today, in the Calculated Risk Real Estate Newsletter: February New Home Sales: Few Completed Inventory, High Number of Homes Under Construction
Brief excerpt:
The next graph shows new home sales for 2021 and 2022 by month (Seasonally Adjusted Annual Rate). Sales in February 2022 were down 6.2% from February 2021.You can subscribe at https://calculatedrisk.substack.com/.
The year-over-year comparisons will be easier going forward.
...
The next graph shows the months of supply by stage of construction. “Months of supply” is inventory at each stage, divided by the sales rate.
The inventory of completed homes for sale was at 35 thousand in February, up from the record low of 33 thousand in several months in 2021. That is about 0.5 months of completed supply (red line). This is about half the normal level.
The inventory of new homes under construction is at 4.1 months (blue line) - well above the normal level. This elevated level of homes under construction is due to supply chain constraints.
And 106 thousand homes have not been started - about 1.7 months of supply (grey line) - almost double the normal level. Homebuilders are probably waiting to start some homes until they have a firmer grasp on prices.
New Home Sales decrease to 772,000 Annual Rate in February
by Calculated Risk on 3/23/2022 10:08:00 AM
The Census Bureau reports New Home Sales in February were at a seasonally adjusted annual rate (SAAR) of 772 thousand.
The previous three months were revised up slightly, combined.
Sales of new single‐family houses in February 2022 were at a seasonally adjusted annual rate of 772,000, according to estimates released jointly today by the U.S. Census Bureau and the Department of Housing and Urban Development. This is 2.0 percent below the revised January rate of 788,000 and is 6.2 percent below the February 2021 estimate of 823,000.
emphasis added
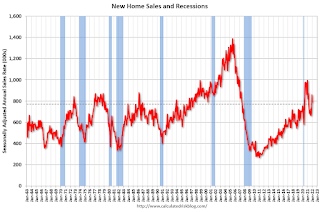 Click on graph for larger image.
The first graph shows New Home Sales vs. recessions since 1963. The dashed line is the current sales rate.
New home sales are now declining year-over-year since sales soared following the first few months of the pandemic.
The second graph shows New Home Months of Supply.
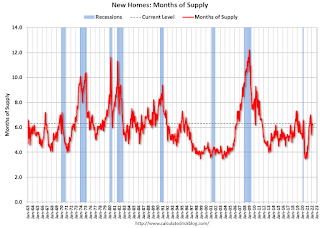 The months of supply increased in February to 6.3 months from 6.1 months in January.
 The all-time record high was 12.1 months of supply in January 2009. The all-time record low was 3.5 months, most recently in October 2020.
This is above the top of the normal range (about 4 to 6 months of supply is normal).
"The seasonally‐adjusted estimate of new houses for sale at the end of February was 407,000. This represents a supply of 6.3 months at the current sales rate."
 The last graph shows sales NSA (monthly sales, not seasonally adjusted annual rate).
In February 2022 (red column), 65 thousand new homes were sold (NSA). Last year, 70 thousand homes were sold in February
The all-time high for February was 109 thousand in 2005, and the all-time low for February was 22 thousand in 2011.
This was below expectations, however sales in the three previous months were revised up slightly, combined. I'll have more later today.
MBA: Mortgage Applications Decrease in Latest Weekly Survey
by Calculated Risk on 3/23/2022 07:00:00 AM
From the MBA: Mortgage Applications Decrease in Latest MBA Weekly Survey
Mortgage applications decreased 8.1 percent from one week earlier, according to data from the Mortgage Bankers Association’s (MBA) Weekly Mortgage Applications Survey for the week ending March 18, 2022.
... The Refinance Index decreased 14 percent from the previous week and was 54 percent lower than the same week one year ago. The seasonally adjusted Purchase Index decreased 2 percent from one week earlier. The unadjusted Purchase Index decreased 1 percent compared with the previous week and was 12 percent lower than the same week one year ago.
“Rates on 30-year conforming mortgages jumped by 23 basis points last week, the largest weekly increase since March 2020. The jump in rates comes as markets moved to price in a much faster pace of rate hikes, as well as expectations of fewer MBS purchases from the Federal Reserve. With mortgage rates now at 4.5 percent, compared to rates at or below 3 percent not that long ago, it is no surprise that refinance volume has dropped by more than 50 percent compared to this time last year. MBA’s new March forecast expects mortgage rates to continue to trend higher through the course of 2022,” said Mike Fratantoni, MBA’s Senior Vice President and Chief Economist. “Purchase application volume was down slightly for the week, with a larger drop in FHA and VA purchase volume, and a small decline in conventional purchase loans. First-time homebuyers, who rely on these government programs, are increasingly challenged by both the rapid increase in home prices and higher mortgage rates. Repeat homebuyers, who are more likely to use conventional loans, benefit from the gains in home equity realized on a sale which can be used to fuel their next purchase, even with rates moving higher.”
...
The average contract interest rate for 30-year fixed-rate mortgages with conforming loan balances ($647,200 or less) increased to 4.50 percent from 4.27 percent, with points increasing to 0.59 from 0.54 (including the origination fee) for 80 percent loan-to-value ratio (LTV) loans.
emphasis added
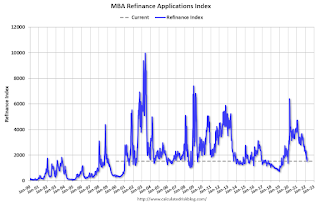 Click on graph for larger image.
The first graph shows the refinance index since 1990.
The second graph shows the MBA mortgage purchase index
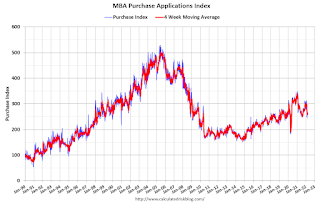 According to the MBA, purchase activity is down 12% year-over-year unadjusted.
Note: Red is a four-week average (blue is weekly).
Tuesday, March 22, 2022
Wednesday: New Home Sales
by Calculated Risk on 3/22/2022 09:27:00 PM
Wednesday:
• At 7:00 AM ET, The Mortgage Bankers Association (MBA) will release the results for the mortgage purchase applications index.
• At 8:00 AM, Discussion, Fed Chair Powell, Panel on Emerging Challenges for Central Bank Governors in a Digital World, At the Bank for International Settlements (BIS) Innovation Summit 2022 (Virtual)
• At 10:00 AM, New Home Sales for February from the Census Bureau. The consensus is for 815 thousand SAAR, up from 801 thousand in January.
• During the day, The AIA's Architecture Billings Index for February (a leading indicator for commercial real estate).
On COVID (focus on hospitalizations and deaths):
| COVID Metrics | ||||
|---|---|---|---|---|
| Now | Week Ago | Goal | ||
| Percent fully Vaccinated | 65.4% | --- | ≥70.0%1 | |
| Fully Vaccinated (millions) | 217.1 | --- | ≥2321 | |
| New Cases per Day3 | 28,657 | 31,558 | ≤5,0002 | |
| Hospitalized3 | 18,203 | 25,105 | ≤3,0002 | |
| Deaths per Day3 | 861 | 1,167 | ≤502 | |
| 1 Minimum to achieve "herd immunity" (estimated between 70% and 85%). 2my goals to stop daily posts, 37-day average for Cases, Currently Hospitalized, and Deaths 🚩 Increasing 7-day average week-over-week for Cases, Hospitalized, and Deaths ✅ Goal met. | ||||
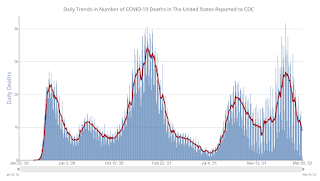
This graph shows the daily (columns) and 7-day average (line) of deaths reported.
March Vehicle Sales Forecast: Decrease to 13.4 million SAAR
by Calculated Risk on 3/22/2022 05:51:00 PM
From WardsAuto: Forecast March U.S. Light-Vehicle Sales: SAAR Down from February but First-Quarter Results Best Since Q2-2021 (pay content)
Supply issues continue to impact vehicle sales, but it appears the supply chain disruption bottom is in.

This graph shows actual sales from the BEA (Blue), and Wards forecast for March (Red).
The Wards forecast of 13.4 million SAAR, would be down about 5% from last month, and down 24% from a year ago (sales were solid in March 2021, as sales recovered from the depths of the pandemic, and weren't yet impacted by supply chain issues).
Distressing Gap: Existing and New Home Sales
by Calculated Risk on 3/22/2022 02:30:00 PM
By request, here is an update to the "distressing gap" graph that I first started posting following the housing bubble to show the emerging gap caused by distressed sales.
I haven't posted this in a couple of years since the pandemic distorted the numbers.
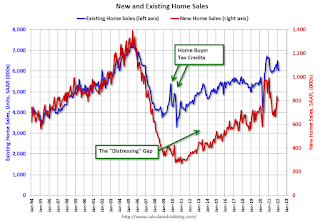
Following the housing bubble and bust, the "distressing gap" appeared mostly because of distressed sales.
In 2020, the gap was mostly closed with help from the pandemic.
 Another way to look at this is a ratio of existing to new home sales.
This ratio was fairly stable from 1994 through 2006, and then the flood of distressed sales kept the number of existing home sales elevated and depressed new home sales. (Note: This ratio was fairly stable back to the early '70s, but I only have annual data for the earlier years).
In general, the ratio has been trending down since the housing bust - and was close to the historical ratio before the pandemic.
Note: Existing home sales are counted when transactions are closed, and new home sales are counted when contracts are signed. So, the timing of sales is different.
Mortgage Rates Moving Closer to 5%
by Calculated Risk on 3/22/2022 11:21:00 AM
Today, in the Calculated Risk Real Estate Newsletter: Mortgage Rates Moving Closer to 5%
A brief excerpt:
Mortgage News Daily reports that the most prevalent 30-year fixed rate is now at 4.66% for top tier scenarios. Matthew Graham at Mortgage News Daily wrote yesterday: Bond Market Betrayal as Mortgage Rates Hit Another Long Term HighThere is much more in the article. You can subscribe at https://calculatedrisk.substack.com/The event in question was a speech (and subsequent comments) from Fed Chair Powell. Rather than do anything at all to push back against last week's Fed-driven rate spike, Powell forcefully doubled down on the Fed's urgent need to shift Fed policy to an even less rate-friendly stance.
Mortgage lenders were already roughly an eighth of a point higher in terms of 30yr fixed rates this morning. After Powell, rates nearly doubled that move (i.e. some lenders are a quarter of a point higher in rate versus Friday's latest levels). That makes today one of only 5 days with this big of a spike in more than a decade.
Lender rate offerings are widely stratified and many are still getting caught up with the market volatility, but it's safe to say the average lender is now over 4.5%, and much closer to 4.625% for top tier conventional 30yr fixed scenarios.Of course, rates are still historically low. But rates are up sharply from the recent lows, and my view is the change in rates is what will impact housing (see my post last week: Housing, the Fed, Interest Rates and Inflation; Housing is a key transmission mechanism for the FOMC). Here is a long-term graph of 30-year mortgage rates (Freddie Mac PMMS, February is today’s rate).
Goldman: Expecting Fed to hike 50bps in May and Start Balance Sheet Reduction
by Calculated Risk on 3/22/2022 09:29:00 AM
A few excerpt from a Goldman Sachs research note: Moving “Expeditiously” Implies a Faster Pace; Forecasting 50bp Hikes in May and June
In a speech [yesterday], Chair Powell said, “There is an obvious need to move expeditiously to return the stance of monetary policy to a more neutral level, and then to move to more restrictive levels if that is what is required to restore price stability.” He repeated the call “to move expeditiously” at the end of the speech. ... We now forecast 50bp hikes at both the May and June meetings, followed by 25bp hikes at the four remaining meetings in the back half of 2022 ... We continue to expect the FOMC to announce the start of balance sheet reduction at the May meeting.CNBC's Steve Liesman tweeted this morning:
emphasis added
"The Dec. Fed Funds contract trades with an implied yield of 2.13... that means 7 MORE hikes from here or 8 total this year. At least one of those meetings needs to be 50bp. The 50bp probability for May is 68%. There is also going to be balance sheet reduction."So a 50bps hike - and balance sheet reduction - are becoming the consensus view.
Monday, March 21, 2022
Tuesday: Richmond Fed Mfg
by Calculated Risk on 3/21/2022 09:00:00 PM
From Matthew Graham at Mortgage News Daily: From Bad to Worse as Powell Doubles Down on Policy Shift
Things were already fairly ugly this morning as the bond market opted to pay no attention to last Friday's consolidation potential. Fed Funds Futures showed the market pricing in at least one 50bp hike in addition to a 25bp hike at every remaining Fed meeting this year. Powell's scheduled speech added a significant amount of fuel to that fire at 12:30pm. He did nothing to try to calm the market down, but instead, essentially told traders they were correct in rushing to price in more rate hikes and faster policy normalization. This resulted in overnight losses more than doubling across the curve, and widespread negative reprices. [30 year fixed 4.66%]Tuesday:
emphasis added
• At 10:00 AM ET, Richmond Fed Survey of Manufacturing Activity for March.
On COVID (focus on hospitalizations and deaths):
| COVID Metrics | ||||
|---|---|---|---|---|
| Now | Week Ago | Goal | ||
| Percent fully Vaccinated | 65.4% | --- | ≥70.0%1 | |
| Fully Vaccinated (millions) | 217.1 | --- | ≥2321 | |
| New Cases per Day3 | 27,786 | 33,721 | ≤5,0002 | |
| Hospitalized3 | 18,203 | 25,105 | ≤3,0002 | |
| Deaths per Day3 | 901 | 1,187 | ≤502 | |
| 1 Minimum to achieve "herd immunity" (estimated between 70% and 85%). 2my goals to stop daily posts, 37-day average for Cases, Currently Hospitalized, and Deaths 🚩 Increasing 7-day average week-over-week for Cases, Hospitalized, and Deaths ✅ Goal met. | ||||
 Click on graph for larger image.
This graph shows the daily (columns) and 7-day average (line) of deaths reported.
MBA Survey: "Share of Mortgage Loans in Forbearance Decreases to 1.18% in February"
by Calculated Risk on 3/21/2022 04:00:00 PM
Note: This is as of February 28th.
From the MBA: Share of Mortgage Loans in Forbearance Decreases to 1.18% in February
The Mortgage Bankers Association’s (MBA) monthly Loan Monitoring Survey revealed that the total number of loans now in forbearance decreased by 12 basis points from 1.30% of servicers’ portfolio volume in the prior month to 1.18% as of February 28, 2022. According to MBA’s estimate, 590,000 homeowners are in forbearance plans.
The share of Fannie Mae and Freddie Mac loans in forbearance decreased 8 basis points to 0.56%. Ginnie Mae loans in forbearance decreased 10 basis points to 1.50%, and the forbearance share for portfolio loans and private-label securities (PLS) declined 30 basis points to 2.72%
“There were many positive results in overall mortgage performance in February. The percentage of borrowers in forbearance declined for the 21st consecutive month, and the percentage of borrowers current on their mortgage payments increased to almost 95 percent – 350 basis points higher than one year ago. Finally, the percentage of borrowers with existing loan workouts who were current on their mortgage payments improved for the first time since June 2021,” said Marina Walsh, CMB, MBA’s Vice President of Industry Analysis. “These three results – the lower forbearance rates and higher performance rates for both total borrowers and borrowers in workouts – are especially favorable given that there is typically a dip in mortgage performance in February because of the shortened number of days to make a payment.”
Added Walsh, “We can credit several factors to the improved performance, including the availability of viable loss mitigation options, low unemployment that is now below 4.0 percent, strong wage growth, and rising home equity."
emphasis added
 Click on graph for larger image.
This graph shows the percent of portfolio in forbearance by investor type over time. The number of forbearance plans is decreasing.


