 RSS Feed
 by Calculated Risk on 3/26/2022 08:11:00 AM
Saturday, March 26, 2022
Schedule for Week of March 27, 2022
The key report scheduled for this week is the March employment report on Friday.
Other key reports include the 3rd estimate of Q4 GDP, February Personal Income & Outlays, January Case-Shiller house prices and March Auto Sales.
For manufacturing, the March Dallas Fed survey and the ISM Manufacturing survey will be released.
10:30 AM: Dallas Fed Survey of Manufacturing Activity for March. This is the last of the regional surveys for March.
 9:00 AM: S&P/Case-Shiller House Price Index for January.
This graph shows the year-over-year change for the Case-Shiller National, Composite 10 and Composite 20 indexes, through the most recent report (the Composite 20 was started in January 2000).
The consensus is for a 18.3% year-over-year increase in the Comp 20 index.
9:00 AM: FHFA House Price Index for January 2021. This was originally a GSE only repeat sales, however there is also an expanded index.
 10:00 AM ET: Job Openings and Labor Turnover Survey for February from the BLS.
 This graph shows job openings (yellow line), hires (purple), Layoff, Discharges and other (red column), and Quits (light blue column) from the JOLTS.
Jobs openings decreased in January to 11.3 million from 11.4 million in December.
7:00 AM ET: The Mortgage Bankers Association (MBA) will release the results for the mortgage purchase applications index.
8:15 AM: The ADP Employment Report for March. This report is for private payrolls only (no government). The consensus is for 438,000 payroll jobs added in March, down from 475,000 added in February.
8:30 AM, Gross Domestic Product, 4th quarter 2021 (Third estimate). The consensus is that real GDP increased 7.1% annualized in Q4.
8:30 AM: The initial weekly unemployment claims report will be released. The consensus is for an increase to 195 thousand from 187 thousand last week.
8:30 AM: Personal Income and Outlays for February. The consensus is for a 0.5% increase in personal income, and for a 0.5% increase in personal spending. And for the Core PCE price index to increase 0.4%.
9:45 AM: Chicago Purchasing Managers Index for March. The consensus is for a reading of 56.6, up from 56.3 in February.
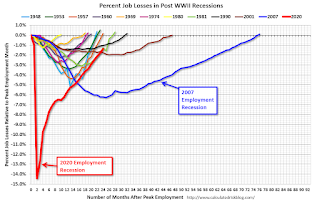 8:30 AM: Employment Report for March. The consensus is for 475,000 jobs added, and for the unemployment rate to decrease to 3.7%.
There were 678,000 jobs added in February, and the unemployment rate was at 3.8%.
This graph shows the job losses from the start of the employment recession, in percentage terms.
The current employment recession was by far the worst recession since WWII in percentage terms. However, the current employment recession, 24 months after the onset, is now significantly better than the worst of the "Great Recession".
10:00 AM: ISM Manufacturing Index for March. The consensus is for the ISM to be at 58.6, unchanged from 58.6 in February.
10:00 AM: Construction Spending for February. The consensus is for a 0.9% increase in construction spending.
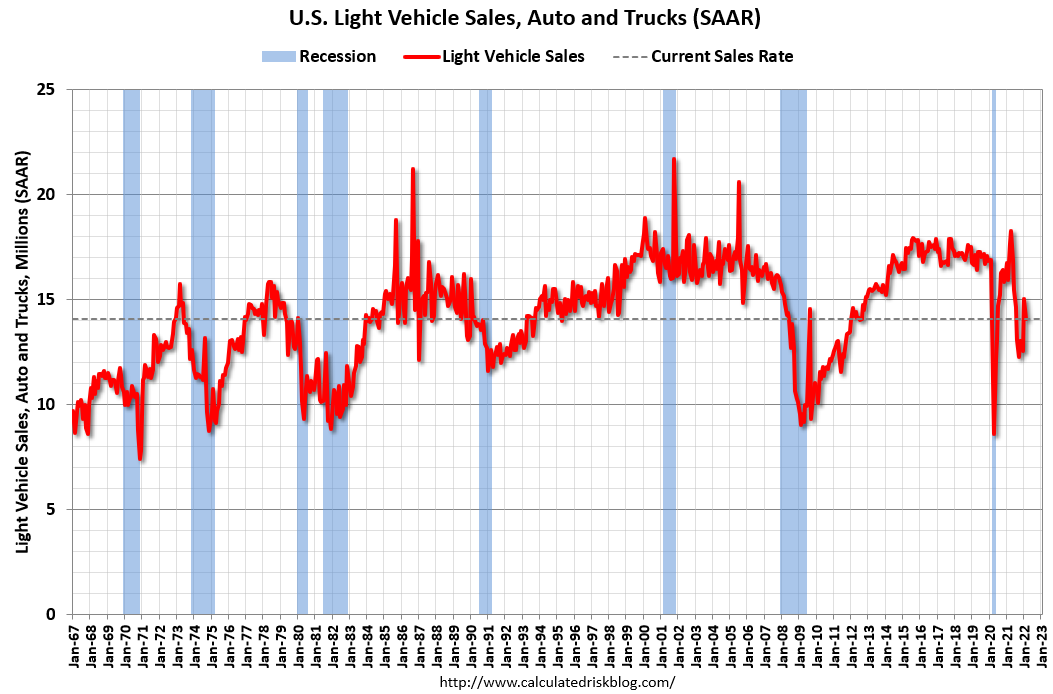 All Day: Light vehicle sales for March. The consensus is for light vehicle sales to be 14.1 million SAAR in March, unchanged from 14.1 million in February (Seasonally Adjusted Annual Rate).
This graph shows light vehicle sales since the BEA started keeping data in 1967. The dashed line is the February sales rate.
Friday, March 25, 2022
COVID Update: March 25, 2022; Deaths at 732 per Day, Lowest Since August 2021
by Calculated Risk on 3/25/2022 09:29:00 PM
Last June, new cases per day dropped to 8,000, hospitalizations fell to 12,000, and deaths were at 250 per day. Hospitalizations are approaching the June levels.
On COVID (focus on hospitalizations and deaths):
| COVID Metrics | ||||
|---|---|---|---|---|
| Now | Week Ago | Goal | ||
| Percent fully Vaccinated | 65.5% | --- | ≥70.0%1 | |
| Fully Vaccinated (millions) | 217.3 | --- | ≥2321 | |
| New Cases per Day3 | 27,784 | 28,007 | ≤5,0002 | |
| Hospitalized3 | 14,768 | 19,249 | ≤3,0002 | |
| Deaths per Day3 | 732 | 1,042 | ≤502 | |
| 1 Minimum to achieve "herd immunity" (estimated between 70% and 85%). 2my goals to stop daily posts, 37-day average for Cases, Currently Hospitalized, and Deaths 🚩 Increasing 7-day average week-over-week for Cases, Hospitalized, and Deaths ✅ Goal met. | ||||
 Click on graph for larger image.
This graph shows the daily (columns) and 7-day average (line) of deaths reported.
Freddie Mac: Mortgage Serious Delinquency Rate decreased in February
by Calculated Risk on 3/25/2022 12:33:00 PM
Freddie Mac reported that the Single-Family serious delinquency rate in February was 0.99%, down from 1.06% in January. Freddie's rate is down year-over-year from 2.52% in January 2021.
Freddie's serious delinquency rate peaked in February 2010 at 4.20% following the housing bubble and peaked at 3.17% in August 2020 during the pandemic.
These are mortgage loans that are "three monthly payments or more past due or in foreclosure".
 Click on graph for larger image
Mortgages in forbearance are being counted as delinquent in this monthly report but are not reported to the credit bureaus.
This is very different from the increase in delinquencies following the housing bubble. Lending standards have been fairly solid over the last decade, and most of these homeowners have equity in their homes - and they will be able to restructure their loans once (if) they are employed.
Also - for multifamily - delinquencies were at 0.08%, down from the peak of 0.20% in April 2021.
Q1 GDP Forecasts: Under 1%
by Calculated Risk on 3/25/2022 12:00:00 PM
From BofA:
Our 1Q GDP tracking estimate moved down to 1.0% qoq saar from 1.6% previously, reflecting recent weaker-than-expected housing and inventory data. 4Q 2021 GDP is likely to get revised up modestly to 7.2% qoq saar from 7.0% qoq saar in the third and final release next week. [March 25 estimate]From Goldman:
emphasis added
Following today’s data,we left our Q1 GDP tracking estimate unchanged on a rounded basis at +0.5% (qoq ar). [March 24 estimate]And from the Altanta Fed: GDPNow
The GDPNow model estimate for real GDP growth (seasonally adjusted annual rate) in the first quarter of 2022 is 0.9 percent on March 24, down from 1.3 percent on March 17. After recent releases from the US Census Bureau and the National Association of Realtors, the nowcast of first-quarter real gross private domestic investment growth decreased from -4.2 percent to -5.8 percent. [March 24 estimate]
NAR: Pending Home Sales Decreased 4.1% in February
by Calculated Risk on 3/25/2022 10:09:00 AM
From CNBC: Pending home sales sink in February, setting a grim tone as housing market enters key spring season
In a grim sign for the housing market’s busiest season, pending home sales, which measure signed contracts on existing homes, fell 4.1% in February compared with January, according to the National Association of Realtors.This was well below expectations of a 1.5% increase for this index. Note: Contract signings usually lead sales by about 45 to 60 days, so this would usually be for closed sales in March and April.
Sales were down 5.4% compared with February 2021. Analysts were expecting a slight gain. This is the fourth straight month of declines in pending sales, which are an indicator of future closings, one to two months out.
...
Regionally, pending sales rose 1.9% month-to-month in the Northeast but were down 9.2% from a year ago. In the Midwest, sales decreased 6.0% for the month and were down 5.2% from February 2021. In the South, sales fell 4.4% monthly and 4.3% annually, and in the West they were down 5.4% for the month and 5.3% from a year ago.
emphasis added
Thursday, March 24, 2022
Friday: Pending Home Sales
by Calculated Risk on 3/24/2022 08:41:00 PM
Friday:
• At 10:00 AM ET, Pending Home Sales Index for February. The consensus is for a 1.5% increase in the index.
• Also, at 10:00 AM, University of Michigan's Consumer sentiment index (Final for March). The consensus is for a reading of 59.7.
• Also, at 10:00 AM, State Employment and Unemployment (Monthly), February 2022
On COVID (focus on hospitalizations and deaths):
| COVID Metrics | ||||
|---|---|---|---|---|
| Now | Week Ago | Goal | ||
| Percent fully Vaccinated | 65.4% | --- | ≥70.0%1 | |
| Fully Vaccinated (millions) | 217.3 | --- | ≥2321 | |
| New Cases per Day3 | 27,134 | 28,695 | ≤5,0002 | |
| Hospitalized3 | 15,227 | 20,978 | ≤3,0002 | |
| Deaths per Day3 | 749 | 1,063 | ≤502 | |
| 1 Minimum to achieve "herd immunity" (estimated between 70% and 85%). 2my goals to stop daily posts, 37-day average for Cases, Currently Hospitalized, and Deaths 🚩 Increasing 7-day average week-over-week for Cases, Hospitalized, and Deaths ✅ Goal met. | ||||
Hotels: Occupancy Rate Down 4% Compared to Same Week in 2019
by Calculated Risk on 3/24/2022 04:42:00 PM
Lifted by spring break travel, U.S. hotel performance rose from the previous week and showed improved comparisons against 2019, according to STR‘s latest data through March 19.The following graph shows the seasonal pattern for the hotel occupancy rate using the four-week average.
March 13-19, 2022 (percentage change from comparable week in 2019*):
• Occupancy: 66.9% (-3.7%)
• Average daily rate (ADR): $151.63 (+13.6%)
• Revenue per available room (RevPAR): $101.44 (+9.5%)
*Due to the pandemic impact, STR is measuring recovery against comparable time periods from 2019.
emphasis added
 Click on graph for larger image.
The red line is for 2022, black is 2020, blue is the median, and dashed light blue is for 2021.
The 4-week average of the occupancy rate is close to the median rate for the previous 20 years (Blue).
Note: Y-axis doesn't start at zero to better show the seasonal change.
The 4-week average of the occupancy rate will now mostly move sideways seasonally until the summer.
New Home Sales and Cancellations
by Calculated Risk on 3/24/2022 02:23:00 PM
Today, in the Calculated Risk Real Estate Newsletter: New Home Sales and Cancellations
Brief excerpt:
At first glance, we might think that new home sales, as reported by the Census Bureau, would be impacted by rising mortgage rates sooner than existing home sales. This is because new home sales are reported when the contract is signed, but existing home sales are reported when the transaction closes.There is much more in the newsletter.
However, with the sharp increase in mortgage rates, we might see more cancellations for the homebuilders, and cancellations confuse the timing issue.When looking at new home sales, we are interested in net sales, but the Census Bureau reports gross new sales. A simple equation would be:
Sales (net) = Sales (gross) – Cancellations + Sales of earlier cancellations.
In the long run, the cancellation terms balance out, and the Census Bureau numbers are what we want. In other words, Sales(net) = sales(gross). But in the short run, when cancellations increase, the Census Bureau overestimates sales; and when cancellations decrease, the Census Bureau underestimates sales.
...
Currently cancellation rates are below normal for the home builders. Here is a table of selected public builders and the currently reported cancellation rate (I’m still gathering data).
As an example, Toll Brothers just announced a cancellation rate of 4.3%, up from 3.3%, but well below their historical rate of 7%. During the housing bust, Toll Brothers cancellation rates peaked close to 40%.

You can subscribe at https://calculatedrisk.substack.com/.
Black Knight: National Mortgage Delinquency Rate Increased in February
by Calculated Risk on 3/24/2022 11:19:00 AM
Note: At the beginning of the pandemic, the delinquency rate increased sharply. Loans in forbearance are counted as delinquent in this survey, but those loans are not reported as delinquent to the credit bureaus. Foreclosures are starting to increase following the end of the moratorium, but are at very low levels (see: Delinquencies, Foreclosures and REO) for a discussion of rising foreclosures, and why this isn't a concern)
From Black Knight: February Uptick in Early-Stage Delinquencies Drives First Increase in Past- Due Mortgages in Nine Months; Foreclosure Starts Fall 24% Following January Spike
• Though past-due loans edged higher (+1.8%) in February, the national delinquency rate remains near pre-pandemic levels heading into March, a month known for strong seasonal performance improvementsAccording to Black Knight's First Look report, the percent of loans delinquent increased 1.8% in February compared to January and decreased 44% year-over-year.
• February’s increase was driven by a rise of 97,000 in early-stage delinquencies – which nevertheless remain well below pre-pandemic levels
• At the same time, the number of seriously delinquent mortgages (those 90 or more days past due) fell by 72,000 as borrowers leaving forbearance plans continue to return to making payments
• After seeing a sizable spike in January, foreclosure starts pulled back by 24%, with the month’s 25,000 starts 25% below February 2020 levels, prior to the onset of pandemic-related economic stress
• Likewise, despite a 39,000 increase in the number of loans in active foreclosure, the population remains 32% below February 2020 levels
• Prepayment activity – as reflected in single-month mortality – dropped another 11% in February, hitting a nearly three-year low as rising rates continue to impact refinance volumes
emphasis added
The percent of loans in the foreclosure process increased 9% in February and were down 3% over the last year.
Black Knight reported the U.S. mortgage delinquency rate (loans 30 or more days past due, but not in foreclosure) was 3.36% in February, down from 3.30% in January.
The percent of loans in the foreclosure process increased in February to 0.31%, from 0.28% in January.
The number of delinquent properties, but not in foreclosure, is down 1,403,000 properties year-over-year, and the number of properties in the foreclosure process is down 6,000 properties year-over-year.
| Black Knight: Percent Loans Delinquent and in Foreclosure Process | ||||
|---|---|---|---|---|
| Feb 2022 | Jan 2022 | Feb 2021 | Feb 2020 | |
| Delinquent | 3.36% | 3.30% | 6.00% | 3.28% |
| In Foreclosure | 0.31% | 0.28% | 0.32% | 0.45% |
| Number of properties: | ||||
| Number of properties that are delinquent, but not in foreclosure: | 1,783,000 | 1,758,000 | 3,186,000 | 1,737,000 |
| Number of properties in foreclosure pre-sale inventory: | 162,000 | 149,000 | 168,000 | 239,000 |
| Total Properties | 1,946,000 | 1,907,000 | 3,354,000 | 1,976,000 |
Weekly Initial Unemployment Claims Decrease to 187,000; Lowest Since 1969
by Calculated Risk on 3/24/2022 08:34:00 AM
The DOL reported:
In the week ending March 19, the advance figure for seasonally adjusted initial claims was 187,000, a decrease of 28,000 from the previous week's revised level. This is the lowest level for initial claims since September 6, 1969 when it was 182,000. The previous week's level was revised up by 1,000 from 214,000 to 215,000. The 4-week moving average was 211,750, a decrease of 11,500 from the previous week's revised average. The previous week's average was revised up by 250 from 223,000 to 223,250.The following graph shows the 4-week moving average of weekly claims since 1971.
emphasis added
 Click on graph for larger image.
The dashed line on the graph is the current 4-week average. The four-week average of weekly unemployment claims decreased to 211,750.
The previous week was revised up.
Weekly claims were lower than the consensus forecast.


