by Calculated Risk on 4/03/2022 10:31:00 AM
Sunday, April 03, 2022
Zillow Case-Shiller House Price Forecast: February similar to January Year-over-year
The Case-Shiller house price indexes for January were released this week. Zillow forecasts Case-Shiller a month early, and I like to check the Zillow forecasts since they have been pretty close.
From Zillow Research: January 2022 Case-Shiller Results & Forecast: Competitive Conditions
Though home sales have remained at elevated levels, rising mortgage rates, rapidly increasing home values, and fierce competition for listings may have some potential buyers rethinking whether they’re going to take the plunge into the market. Looking to the months ahead, competition between buyers will be intense. Homes that went pending this winter typically did so in less than two weeks, an unseasonably fast pace. For those hoping there would be a big enough wave of sellers listing their homes this spring to ease some of the most competitive conditions we’ve ever seen, there’s no sign yet of that being the case. New listings are coming onto the market below levels we’ve seen in the weeks leading up to the shopping season of years past. In the short term, it all adds up to what is looking to be another few months of a history-making for-sale market.
Annual growth in February as reported by Case-Shiller is expected to accelerate slightly in the 10-city index and remain unchanged in the national and 20-city indices. Monthly growth in February is expected to decelerate from January in the national and 10-city indices, and hold steady in the 20-city index. S&P Dow Jones Indices is expected to release data for the February S&P CoreLogic Case-Shiller Indices on Tuesday, April 26.
emphasis added
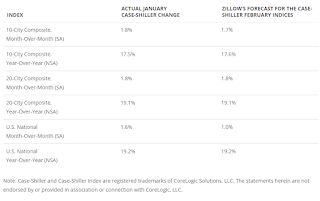 The Zillow forecast is for the year-over-year change for the Case-Shiller National index to be at 19.2% in February, unchanged from 19.2% in January.
Saturday, April 02, 2022
Real Estate Newsletter Articles this Week
by Calculated Risk on 4/02/2022 02:11:00 PM
At the Calculated Risk Real Estate Newsletter this week:
• It is the Change in Monthly Payment that Matters
• Housing: Don't Compare the Current Housing Boom to the Bubble and Bust
• Real House Prices, Price-to-Rent Ratio and Price-to-Median Income in January
• Case-Shiller National Index up 19.2% Year-over-year in January
• Housing Inventory Has Bottomed
This is usually published several times a week and provides more in-depth analysis of the housing market.
The blog will continue as always!
You can subscribe at https://calculatedrisk.substack.com/
Schedule for Week of April 3, 2022
by Calculated Risk on 4/02/2022 08:11:00 AM
This will be a light week for economic data.
The key report this week is the Trade Deficit.
No major economic releases scheduled.
8:00 AM: Corelogic House Price index for February.
 8:30 AM: Trade Balance report for February from the Census Bureau.
 This graph shows the U.S. trade deficit, with and without petroleum, through the most recent report. The blue line is the total deficit, and the black line is the petroleum deficit, and the red line is the trade deficit ex-petroleum products.
The consensus is the trade deficit to be $88.7 billion. The U.S. trade deficit was at $89.7 billion in January.
10:00 AM: the ISM Services Index for March.
7:00 AM ET: The Mortgage Bankers Association (MBA) will release the results for the mortgage purchase applications index.
2:00 PM: FOMC Minutes, Minutes Meeting of March 15-16, 2022
8:30 AM: The initial weekly unemployment claims report will be released. The consensus is for a decrease to 200 thousand from 202 thousand last week.
No major economic releases scheduled.
Friday, April 01, 2022
March Vehicles Sales decreased to 13.33 million SAAR
by Calculated Risk on 4/01/2022 07:04:00 PM
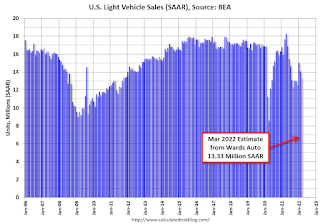
Wards Auto released their estimate of light vehicle sales for March. Wards Auto estimates sales of 13.33 million SAAR in March 2022 (Seasonally Adjusted Annual Rate), down 5.3% from the February sales rate, and down 24.4% from March 2021.
 Click on graph for larger image.
This graph shows light vehicle sales since 2006 from the BEA (blue) and Wards Auto's estimate for March (red).
The impact of COVID-19 was significant, and April 2020 was the worst month. After April 2020, sales increased, and were close to sales in 2019 (the year before the pandemic).
It is the Change in Monthly Payment that Matters
by Calculated Risk on 4/01/2022 03:02:00 PM
Today, in the Calculated Risk Real Estate Newsletter: It is the Change in Monthly Payment that Matters
Excerpt:
Yesterday I pointed that we shouldn’t compare the current situation to the housing bubble and bust, but instead we should look to the 1978 to 1982 period for lessons.
See: Housing: Don't Compare the Current Housing Boom to the Bubble and Bust
In that post, I argued it wasn’t the level of mortgage rates that impacted housing, but the change in rates (this was a shortcut).
More precisely, it is the change in monthly payments that impacts housing. Monthly payments include principal, interest, taxes, insurance (PITI), and sometimes HOA fees (Homeowners Association). We could also include maintenance, utilities and other costs.
The following graph shows the year-over-year change in principal & interest (P&I) assuming a fixed loan amount since 1977. Currently P&I is up about 21% year-over-year for a fixed amount (this doesn’t take into account the change in house prices).
So, this is less of an increase than in 1979.
Construction Spending Increased 0.5% in February
by Calculated Risk on 4/01/2022 11:25:00 AM
From the Census Bureau reported that overall construction spending increased 1.3%:
Construction spending during February 2022 was estimated at a seasonally adjusted annual rate of $1,704.4 billion, 0.5 percent above the revised January estimate of $1,695.5 billion. The February figure is 11.2 percent above the February 2021 estimate of $1,533.3 billion.Private spending increased and public spending decreased:
emphasis added
Spending on private construction was at a seasonally adjusted annual rate of $1,353.7 billion, 0.8 percent above the revised January estimate of $1,343.4 billion. ...
In February, the estimated seasonally adjusted annual rate of public construction spending was $350.7 billion, 0.4 percent below the revised January estimate of $352.2 billion.
 Click on graph for larger image.
This graph shows private residential and nonresidential construction spending, and public spending, since 1993. Note: nominal dollars, not inflation adjusted.
Residential (red) spending is 25% above the bubble peak (in nominal terms - not adjusted for inflation).
Non-residential (blue) spending is 21% above the bubble era peak in January 2008 (nominal dollars).
Public construction spending is 8% above the peak in March 2009.
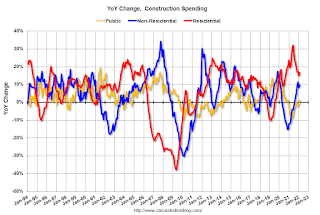 The second graph shows the year-over-year change in construction spending.
On a year-over-year basis, private residential construction spending is up 16.6%. Non-residential spending is up 9.7% year-over-year. Public spending is up 1.4% year-over-year.
Q1 GDP Forecasts: Barely Positive
by Calculated Risk on 4/01/2022 11:11:00 AM
From BofA:
Our 1Q GDP tracking estimate fell by 0.6ppt to 0.4% qoq SAAR as real personal spending was weaker than we expected. [April 1 estimate]From Goldman:
emphasis added
Following today’s data,we left our Q1 GDP tracking estimate unchanged at +0.5% (qoq ar). [March 31 estimate]And from the Altanta Fed: GDPNow
The GDPNow model estimate for real GDP growth (seasonally adjusted annual rate) in the first quarter of 2022 is 1.3 percent on March 31, up from 0.9 percent on March 24. [March 31 estimate]
Comments on March Employment Report
by Calculated Risk on 4/01/2022 09:18:00 AM
This was another solid report.
The headline jobs number in the March employment report was slightly below expectations, however employment for the previous two months was revised up by 95,000. The participation rate and the employment-population ratio both increased, and the unemployment rate decreased to 3.6%.
In March, the year-over-year employment change was 6.5 million jobs.
Permanent Job Losers
 Click on graph for larger image.
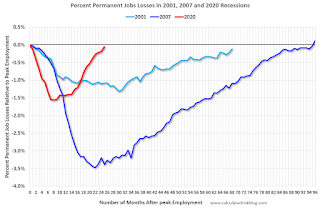
This graph shows permanent job losers as a percent of the pre-recession peak in employment through the report today.
In March, the number of permanent job losers decreased to 1.392 million from 1.583 million in the previous month.
Prime (25 to 54 Years Old) Participation
 Since the overall participation rate has declined due to cyclical (recession) and demographic (aging population, younger people staying in school) reasons, here is the employment-population ratio for the key working age group: 25 to 54 years old.
The 25 to 54 participation rate increased in March to 82.5% from 82.2% in February, and the 25 to 54 employment population ratio increased to 80.0% from 79.5% the previous month.
Part Time for Economic Reasons
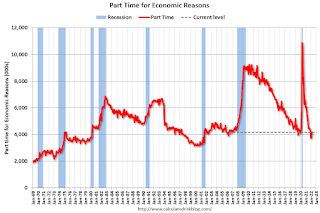 From the BLS report:
"The number of persons employed part time for economic reasons was about unchanged at 4.2 million in March and is little different from its February 2020 level. These individuals, who would have preferred full-time employment, were working part time because their hours had been reduced or they were unable to find full-time jobs."The number of persons working part time for economic reasons increased in March to 4.170 million from 4.135 million in February. This is at pre-recession levels.
These workers are included in the alternate measure of labor underutilization (U-6) that decreased to 6.9% from 7.2% in the previous month. This is down from the record high in April 22.9% for this measure since 1994. This measure is below the 7.0% in February 2020 (pre-pandemic).
Unemployed over 26 Weeks
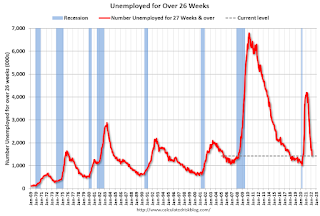 This graph shows the number of workers unemployed for 27 weeks or more.
 According to the BLS, there are 1.702 million workers who have been unemployed for more than 26 weeks and still want a job, up from 1.691 million the previous month.
This does not include all the people that left the labor force.
Summary:
The headline monthly jobs number was slightly below expectations; however, the previous two months were revised up by 95,000 combined.
March Employment Report: 431 thousand Jobs, 3.6% Unemployment Rate
by Calculated Risk on 4/01/2022 08:44:00 AM
From the BLS:
Total nonfarm payroll employment rose by 431,000 in March, and the unemployment rate declined to 3.6 percent, the U.S. Bureau of Labor Statistics reported today. Notable job gains continued in leisure and hospitality, professional and business services, retail trade, and manufacturing.
The change in total nonfarm payroll employment for January was revised up by 23,000, from +481,000 to +504,000, and the change for February was revised up by 72,000, from +678,000 to +750,000. With these revisions, employment in January and February combined is 95,000 higher than previously reported.
emphasis added
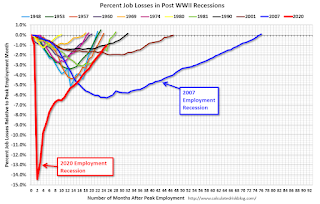 Click on graph for larger image.
The first graph shows the job losses from the start of the employment recession, in percentage terms.
The current employment recession was by far the worst recession since WWII in percentage terms.
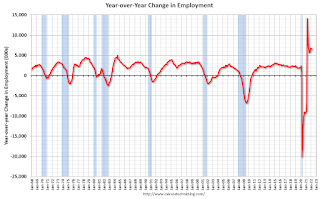 The second graph shows the year-over-year change in total non-farm employment since 1968.
In March, the year-over-year change was 6.5 million jobs. This was up significantly year-over-year.
Total payrolls increased by 431 thousand in March. Private payrolls increased by 426 thousand, and public payrolls increased 5 thousand.
Payrolls for January and February were revised up 95 thousand, combined.
The third graph shows the employment population ratio and the participation rate.
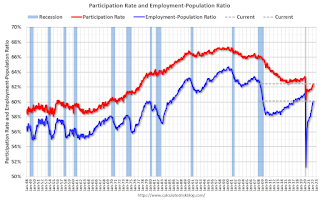 The Labor Force Participation Rate increased to 62.4% in March, from 62.3% in February. This is the percentage of the working age population in the labor force.
 The Employment-Population ratio increased to 60.1% from 59.9% (blue line).
I'll post the 25 to 54 age group employment-population ratio graph later.
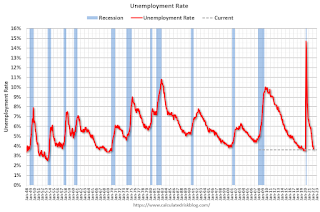 The fourth graph shows the unemployment rate.
 The unemployment rate decreased in March to 3.6% from 3.8% in February.
This was slightly below consensus expectations; however, January and February payrolls were revised up by 95,000 combined.
Thursday, March 31, 2022
Friday: Employment Report, ISM Mfg, Construction Spending, Vehicle Sales
by Calculated Risk on 3/31/2022 09:07:00 PM
My March Employment Preview
A few brief excerpts from a note by Goldman Sachs economist Spencer Hill:
We estimate nonfarm payrolls rose by 575k in March (mom sa) ... we believe fierce competition for workers incentivized firms to pull forward recruiting activities earlier in the spring hiring season. We also note that short-term unemployment only partially reversed its Omicron spike with the February report, implying scope for additional rehiring in March. ... We estimate a one-tenth drop in the unemployment rate to 3.7%Friday:
emphasis added
• At 8:30 AM ET, Employment Report for March. The consensus is for 475,000 jobs added, and for the unemployment rate to decrease to 3.7%.
• At 10:00 AM, ISM Manufacturing Index for March. The consensus is for the ISM to be at 58.6, unchanged from 58.6 in February.
• At 10:00 AM, Construction Spending for February. The consensus is for a 0.9% increase in construction spending.
• All Day, Light vehicle sales for March. The consensus is for light vehicle sales to be 14.1 million SAAR in March, unchanged from 14.1 million in February (Seasonally Adjusted Annual Rate).
On COVID (focus on hospitalizations and deaths):
| COVID Metrics | ||||
|---|---|---|---|---|
| Now | Week Ago | Goal | ||
| Percent fully Vaccinated | 65.6% | --- | ≥70.0%1 | |
| Fully Vaccinated (millions) | 217.6 | --- | ≥2321 | |
| New Cases per Day3 | 25,732 | 26,518 | ≤5,0002 | |
| Hospitalized3 | 12,243 | 15,482 | ≤3,0002 | |
| Deaths per Day3 | 626 | 732 | ≤502 | |
| 1 Minimum to achieve "herd immunity" (estimated between 70% and 85%). 2my goals to stop daily posts, 37-day average for Cases, Currently Hospitalized, and Deaths 🚩 Increasing 7-day average week-over-week for Cases, Hospitalized, and Deaths ✅ Goal met. | ||||
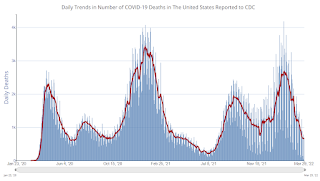 Click on graph for larger image.
This graph shows the daily (columns) and 7-day average (line) of deaths reported.


