by Calculated Risk on 4/05/2022 10:03:00 AM
Tuesday, April 05, 2022
ISM® Services Index Increased to 58.3% in March
(Posted with permission). The ISM® Services index was at 58.3%, up from 56.5% last month. The employment index increased to 54.0%, from 48.5%. Note: Above 50 indicates expansion, below 50 in contraction.
From the Institute for Supply Management: Services PMI® at 56.5% February 2022 Services ISM® Report On Business®
Economic activity in the services sector grew in March for the 22nd month in a row — with the Services PMI® registering 58.3 percent — say the nation's purchasing and supply executives in the latest Services ISM® Report On Business®.The employment index increased to 54.0%, from 48.5% the previous month.
The report was issued today by Anthony Nieves, CPSM, C.P.M., A.P.P., CFPM, Chair of the Institute for Supply Management® (ISM®) Services Business Survey Committee: “In March, the Services PMI® registered 58.3 percent, 1.8 percentage points higher than February’s reading of 56.5 percent. The Business Activity Index registered 55.5 percent, an increase of 0.4 percentage point compared to the reading of 55.1 percent in February, and the New Orders Index figure of 60.1 percent is 4 percentage points higher than the February reading of 56.1 percent.
emphasis added
Trade Deficit Mostly Unchanged at $89.2 Billion in February
by Calculated Risk on 4/05/2022 08:40:00 AM
From the Department of Commerce reported:
The U.S. Census Bureau and the U.S. Bureau of Economic Analysis announced today that the goods and services deficit was $89.2 billion in February, down less than $0.1 billion from $89.2 billion in January, revised.
February exports were $228.6 billion, $4.1 billion more than January exports. February imports were $317.8 billion, $4.1 billion more than January imports.
emphasis added
 Click on graph for larger image.
Exports decreased and imports increased in January.
Exports are up 20% compared to January 2021; imports are up 23% year-over-year.
Both imports and exports decreased sharply due to COVID-19, and have now bounced back (imports more than exports),
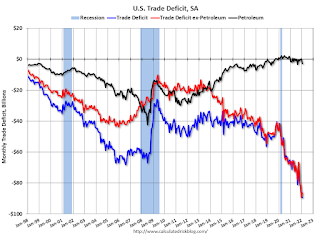
The second graph shows the U.S. trade deficit, with and without petroleum.
 The blue line is the total deficit, and the black line is the petroleum deficit, and the red line is the trade deficit ex-petroleum products.
Note that net, imports and exports of petroleum products are close to zero.
The trade deficit with China increased to $30.7 billion in February, from $24.6 billion in February 2021.
CoreLogic: House Prices up 20% YoY in February
by Calculated Risk on 4/05/2022 08:00:00 AM
Notes: This CoreLogic House Price Index report is for February. The recent Case-Shiller index release was for January. The CoreLogic HPI is a three-month weighted average and is not seasonally adjusted (NSA).
From CoreLogic: Annual Home Price Growth Again Hits New High in February, CoreLogic Reports
CoreLogic® ... today released the CoreLogic Home Price Index (HPI™) and HPI Forecast™ for February 2022.
U.S. home price growth registered a year-over-year increase of 20% in February, another series high and marking 12 months of consecutive double-digit gains. Annual price growth has been recorded every month for the past decade. While prospective buyers outnumber sellers, a record-low number of homes for sale remains the primary culprit for the rapid price gains. The CoreLogic HPI Forecast shows national year-over-year appreciation slowing to 5% by February 2023, as rising interest rates are expected to sideline even more buyers.
"New listings have not kept up with the large number of families looking to buy, leading to homes selling quickly and often above list price,” said Dr. Frank Nothaft, chief economist at CoreLogic. “This imbalance between an insufficient number of owners looking to sell relative to buyers searching for a home has led to the record appreciation of the past 12 months. Higher prices and mortgage rates erode buyer affordability and should dampen demand in coming months, leading to the moderation in price growth in our forecast.”
...
Nationally, home prices increased 20% in February 2022, compared to February 2021. On a month-over-month basis, home prices increased by 2.2% compared to January 2022.
...
Home price gains are projected to slow to 5% by February 2023.
At the state level, warmer regions of the U.S. continued to show the largest increases, with Florida showing the country’s strongest price growth at 29.1%. Arizona ranked a close second with 28.6% growth, while Nevada was third, at 25.8% annual appreciation.
emphasis added
Monday, April 04, 2022
Tuesday: Trade Deficit, CoreLogic House Prices, ISM Services
by Calculated Risk on 4/04/2022 09:11:00 PM
From Matthew Graham at Mortgage News Daily: Mortgage Rates Slightly Lower to Begin New Week
Mortgage rates are fresh off their best week since early March in terms of outright improvement. The catch is that they were at the highest levels since late 2018 immediately before that. ... As for today, we can enjoy a very modest improvement in rates and continue to wait for bigger news to cast a bigger vote on whether the next move is higher or lower. [30 year fixed 4.84%]Tuesday:
emphasis added
• At 8:00 AM ET, Corelogic House Price index for February.
• At 8:30 AM, Trade Balance report for February from the Census Bureau. The consensus is the trade deficit to be $88.7 billion. The U.S. trade deficit was at $89.7 billion in January.
• At 10:00 AM, the ISM Services Index for March.
On COVID (focus on hospitalizations and deaths):
| COVID Metrics | ||||
|---|---|---|---|---|
| Now | Week Ago | Goal | ||
| Percent fully Vaccinated | 65.6% | --- | ≥70.0%1 | |
| Fully Vaccinated (millions) | 217.9 | --- | ≥2321 | |
| New Cases per Day3 | 25,074 | 26,185 | ≤5,0002 | |
| Hospitalized3 | 10,348 | 13,574 | ≤3,0002 | |
| Deaths per Day3 | 572 | 680 | ≤502 | |
| 1 Minimum to achieve "herd immunity" (estimated between 70% and 85%). 2my goals to stop daily posts, 37-day average for Cases, Currently Hospitalized, and Deaths 🚩 Increasing 7-day average week-over-week for Cases, Hospitalized, and Deaths ✅ Goal met. | ||||
 Click on graph for larger image.
This graph shows the daily (columns) and 7-day average (line) of deaths reported.
Average daily deaths are the lowest since early August 2021.
Lawler: What is the Yield Curve Signaling?
by Calculated Risk on 4/04/2022 06:04:00 PM
From housing economist Tom Lawler: What is the Yield Curve Signaling?
Before addressing the above question, here is a little quiz:
The current Treasury yield is by historical standards:
(a) Unusually steep
(b) A bit flatter than normal
(c) Very unusually inverted
(d) All of the above
The current answer is, of course, (d), as the current Treasury yield curve is historically very steep from 3-months to 2-years, a bit flatter than normal from 2- to 3-years, and inverted from 3- to 10-years. (And spreads between the 3-year Treasury and the Fed funds rate is at its widest level since 1994).
Below is a chart comparing average yields curves during the previous three decades compared to today’s (mid-afternoon) yield curve.
 Such “humped” yield curves as the current curve are unusual, and the degree of “humpiest” in the current curve is virtually unprecedented.
Many analysts, economists, and financial news reporters have expressed significant “angst” recently because the spread between the 10-year Treasury yield and the 2-year Treasury yields has turned slightly negative, and such “inversions” have been leading indicators of recessions (though lag times vary considerably.)
However, there is nothing “magical” about the “10/2” spread: other yield curve measures have been comparable or some have argued even better indicators of recessions/growth slowdowns. For example, in a March “reprise” of their 2018 paper, Fed economists Engstrom and Sharpe (https://www.federalreserve.gov/econres/notes/feds-notes/dont-fear-the-yield-curve-reprise-20220325.htm) argue that a much shorter term yield curve measure (the implied forward 3-month Treasury rate 6 months out compared to the current 3-month Treasury rate) is a better forward indicator than the 10/2 spread.
While I’m not a fan of their particular “curve” indicator because (1) it requires quotes on 21 month and 18 month Treasuries, which are not readily available on screens or historically, and (2) the short part of the Treasury curve has at times been much steeper than private money market yield curves for reasons other than “expectations” (see Rowe, Lawler, and Cook https://citeseerx.ist.psu.edu/viewdoc/download?doi=10.1.1.1009.2682&rep=rep1&type=pdf , 1986), there are other yield curve measures that have had the same or better “indicator” value as the 10/2 spread but which today are sending much different signals than the 10/2 spread.
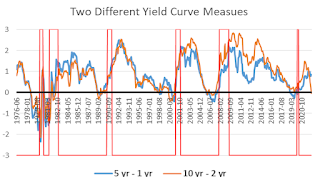
 E.g., [here] is a chart comparing the historical behavior of the spread between the 10-year and the 2-year Treasury with the spread between the 5-year and the 1-year Treasury. (Recessions are shown poorly in the chart.)
 As the chart shows, both of these yield curves meaasures have normally moved together, and both have typically inverted at about the same time – until recently. While the 10/2 spread went from an average of 79 bp in December of last year to negative 4 bp today, the 5/1 spread today is about 85 bp, down only slightly from the 93 bp average last December. And the spread between the 5-year Treasury and the Fed funds rate (not show here) has WIDENED to about 223 bp today from an 87 bp average last December.
 [Here] is another yield curve chart comparing spreads between 3-year Treasuries and Fed Funds as well as 3-year Treasuries and 6-month Treasuries from 1990 through today. This chart highlights have these yield curve measures have widened substantially this year. (The chart only goes back to 1990).
While the current “inversion” of the Treasury yield curve from 3-year to 10 years may reflect “the market’s” view that there may be a slowdown in the economy 3+year out in part because of substanial increases in the Fed’s target Fed funds rate over the next several years (though so far the Fed has only increased the funds rate by 25 bp current steepness of the the curve from the very short end to 3 years suggest that the yield curve is not giving any signals of a slowdown in economic growth over the next several years.
Update: Framing Lumber Prices: Down from Recent Peak, Up Triple from 2 Years Ago
by Calculated Risk on 4/04/2022 02:12:00 PM
Here is another monthly update on framing lumber prices.
This graph shows CME random length framing futures through April 4th.
 Click on graph for larger image.
A combination of strong demand and various supply constraints have kept lumber prices high and volatile.
Black Knight Mortgage Monitor for February: "Tightest affordability in 15 years"
by Calculated Risk on 4/04/2022 11:22:00 AM
Today, in the Calculated Risk Real Estate Newsletter: Black Knight Mortgage Monitor for February: "Tightest affordability in 15 years"
A brief excerpt:
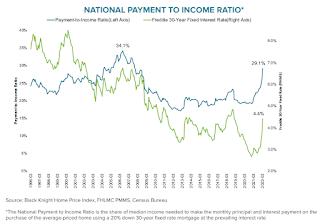
And on the payment to income ratio (this is high):There is much more in the article. You can subscribe at https://calculatedrisk.substack.com/
• It now takes 29.1% of the median household income to make that P&I payment, up from 19.3% just 15 months agoAs Black Knight noted, there were “affordability products” with low teaser rates available during the housing bubble. Excluding the bubble years, this is the worst affordability since the early ‘90s.
• That is a full 4 percentage points more than the 1995-2003 long-term average, though still below the 2006 high of 34%
• In recent years, a payment-to-income ratio above 21% has worked to cool the housing market, but record-low inventory continues to fuel growth even in the face of the tightest affordability in 15 years
• At current home prices and interest rates, it would take a 16% rise in incomes to bring the P&I ratio back down to benchmark affordability levels
Housing Inventory April 4th Update: Inventory up 0.7% Week-over-week; Up 5.9% from Seasonal Bottom
by Calculated Risk on 4/04/2022 09:13:00 AM
Tracking existing home inventory is very important in 2022.
Inventory usually declines in the winter, and then increases in the spring. Inventory bottomed seasonally at the beginning of March 2022 and is now up 5.9% since then.

This inventory graph is courtesy of Altos Research.
Last year inventory bottomed seasonally in April 2021 - very late in the year. This year, by this measure, inventory bottomed seasonally at the beginning of March.
Inventory is still very low. Compared to the same week in 2021, inventory is down 17.6% from 310 thousand, and compared to the same week in 2020, and inventory is down 66.0% from 751 thousand.
One of the keys will be to watch the year-over-year change each week to see if the declines are decreasing. Here is a table of the year-over-year change by week since the beginning of the year.
| Week Ending | YoY Change |
|---|---|
| 12/31/2021 | -30.0% |
| 1/7/2022 | -26.0% |
| 1/14/2022 | -28.6% |
| 1/21/2022 | -27.1% |
| 1/28/2022 | -25.9% |
| 2/4/2022 | -27.9% |
| 2/11/2022 | -27.5% |
| 2/18/2022 | -25.8% |
| 2/25/2022 | -24.9% |
| 3/4/2022 | -24.2% |
| 3/11/2022 | -21.7% |
| 3/18/2022 | -21.7% |
| 3/25/2022 | -19.0% |
| 4/4/2022 | -17.6% |
Six High Frequency Indicators for the Economy
by Calculated Risk on 4/04/2022 08:48:00 AM
These indicators are mostly for travel and entertainment. It is interesting to watch these sectors recover as the pandemic subsides.
The TSA is providing daily travel numbers.
This data is as of April 3rd.
 Click on graph for larger image.
This data shows the 7-day average of daily total traveler throughput from the TSA for 2019 (Light Blue), 2020 (Black), 2021 (Blue) and 2022 (Red).
The dashed line is the percent of 2019 for the seven-day average.
The 7-day average is down 9.8% from the same day in 2019 (09.2% of 2019). (Dashed line)
The second graph shows the 7-day average of the year-over-year change in diners as tabulated by OpenTable for the US and several selected cities.
 Thanks to OpenTable for providing this restaurant data:
This data is updated through April 2, 2022.
This data is "a sample of restaurants on the OpenTable network across all channels: online reservations, phone reservations, and walk-ins. For year-over-year comparisons by day, we compare to the same day of the week from the same week in the previous year."
Dining was mostly moving sideways but declined during the winter wave of COVID and is now increasing. The 7-day average for the US is down 1% compared to 2019.
 This data shows domestic box office for each week and the median for the years 2016 through 2019 (dashed light blue).
 Note that the data is usually noisy week-to-week and depends on when blockbusters are released.
Movie ticket sales were at $109 million last week, down about 46% from the median for the week.
 This graph shows the seasonal pattern for the hotel occupancy rate using the four-week average.
 The red line is for 2022, black is 2020, blue is the median, and dashed light blue is for 2021.
This data is through March 26th. The occupancy rate was down 5.5% compared to the same week in 2019.
Notes: Y-axis doesn't start at zero to better show the seasonal change.
NOTE: Apple will stop providing this data on April 14th.
 This data is through April 2nd
 The graph is the running 7-day average to remove the impact of weekends.
IMPORTANT: All data is relative to January 13, 2020. This data is NOT Seasonally Adjusted. People walk and drive more when the weather is nice, so I'm just using the transit data.
According to the Apple data directions requests, public transit in the 7-day average for the US is at 122% of the January 2020 level.
Here is some interesting data on New York subway usage (HT BR).
 This graph is from Todd W Schneider.
 This data is through Friday, April 1st.
He notes: "Data updates weekly from the MTA’s public turnstile data, usually on Saturday mornings".
Sunday, April 03, 2022
Sunday Night Futures
by Calculated Risk on 4/03/2022 07:29:00 PM
Weekend:
• Schedule for Week of April 3, 2022
Monday:
• No major economic releases scheduled.
From CNBC: Pre-Market Data and Bloomberg futures S&P 500 are down 4 and DOW futures are down 18 (fair value).
Oil prices were down over the last week with WTI futures at $99.27 per barrel and Brent at $104.39 per barrel. A year ago, WTI was at $61, and Brent was at $64 - so WTI oil prices are up 60% year-over-year.
Here is a graph from Gasbuddy.com for nationwide gasoline prices. Nationally prices are at $4.18 per gallon. A year ago prices were at $2.87 per gallon, so gasoline prices are up $1.31 per gallon year-over-year.


