 RSS Feed
 by Calculated Risk on 4/11/2022 01:23:00 PM
Monday, April 11, 2022
Apartment Vacancy Rate Declined in Q1
Today, in the Calculated Risk Real Estate Newsletter: Apartment Vacancy Rate Declined in Q1
A brief excerpt:
Reis reported that the apartment vacancy rate was at 4.7% in Q1 2022, down from 4.8% in Q4, and down from a pandemic peak of 5.4% in both Q1 and Q2 2021.There is more in the article. You can subscribe at https://calculatedrisk.substack.com/
This graph shows the apartment vacancy rate starting in 1980. (Annual rate before 1999, quarterly starting in 1999). Note: Reis is just for large cities.Reis also reported the effective rents were up 2.5% in Q1 compared to Q4, and up 15.6% year-over-year. ...
Click on graph for larger image.
Effective rents declined significantly in the early stages of the pandemic, and even with the recent surge in rents, rents are only up 5.9% annualized over the last 2 years. So, a large portion of the rent increase over the last year was just making up for the previous declines.
For some cities, effective rents were up significantly more, especially in some cities like Albuquerque, Jacksonville and Phoenix. Other sunbelt areas like Las Vegas, Florida, and Southern California also saw huge rent increases.

Housing Inventory April 11th Update: Inventory up 2.3% Week-over-week; Up 8.3% from Seasonal Bottom
by Calculated Risk on 4/11/2022 09:32:00 AM
Tracking existing home inventory is very important in 2022.
Inventory usually declines in the winter, and then increases in the spring. Inventory bottomed seasonally at the beginning of March 2022 and is now up 8.3% since then.
 Click on graph for larger image in graph gallery.
This inventory graph is courtesy of Altos Research.
As of April 8th, inventory was at 261 thousand (7-day average), compared to 255 thousand the prior week. Inventory was UP 2.3% from the previous week.
Last year inventory bottomed seasonally in April 2021 - very late in the year. This year, by this measure, inventory bottomed seasonally at the beginning of March.
Inventory is still very low. Compared to the same week in 2021, inventory is down 14.8% from 307 thousand, and compared to the same week in 2020, and inventory is down 65.1% from 749 thousand.
One of the keys will be to watch the year-over-year change each week to see if the declines are decreasing. Here is a table of the year-over-year change by week since the beginning of the year.
| Week Ending | YoY Change |
|---|---|
| 12/31/2021 | -30.0% |
| 1/7/2022 | -26.0% |
| 1/14/2022 | -28.6% |
| 1/21/2022 | -27.1% |
| 1/28/2022 | -25.9% |
| 2/4/2022 | -27.9% |
| 2/11/2022 | -27.5% |
| 2/18/2022 | -25.8% |
| 2/25/2022 | -24.9% |
| 3/4/2022 | -24.2% |
| 3/11/2022 | -21.7% |
| 3/18/2022 | -21.7% |
| 3/25/2022 | -19.0% |
| 4/1/2022 | -17.6% |
| 4/8/2022 | -14.8% |

Here is a graph of the year-over-year change in the Altos data.
The blue trend line is from the beginning of the year, and the red trend line is over the last 8 weeks.
Currently it appears inventory will be up year-over-year sometime in the 3rd quarter of 2022.
Mike Simonsen discusses this data regularly on Youtube.
Six High Frequency Indicators for the Economy
by Calculated Risk on 4/11/2022 09:03:00 AM
These indicators are mostly for travel and entertainment. It is interesting to watch these sectors recover as the pandemic subsides.
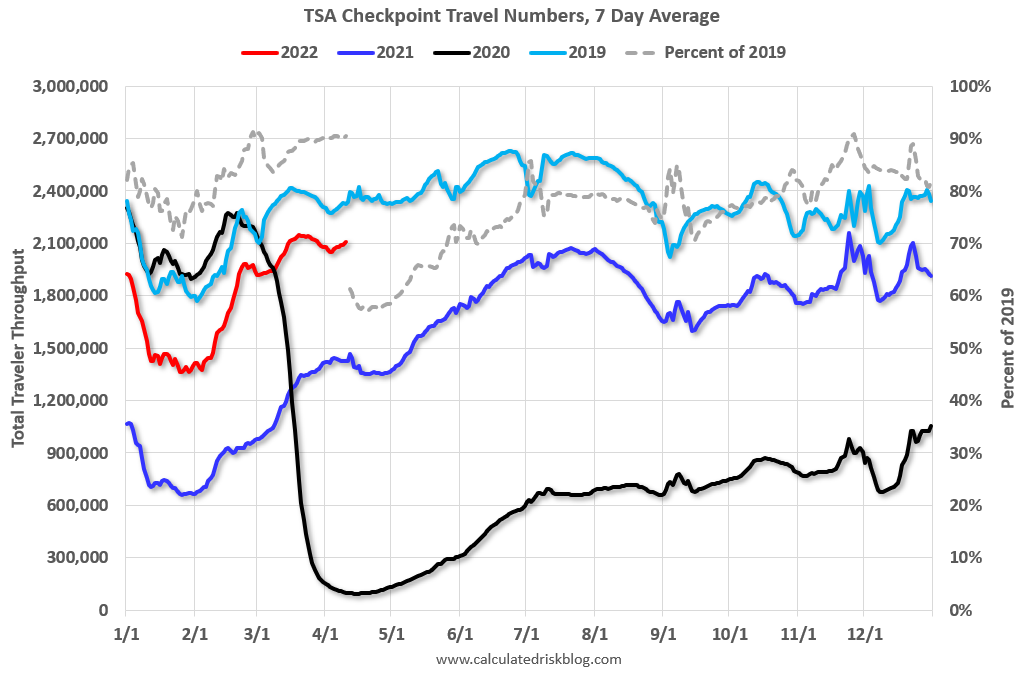
The TSA is providing daily travel numbers.
This data is as of April 10th.
 Click on graph for larger image.
This data shows the 7-day average of daily total traveler throughput from the TSA for 2019 (Light Blue), 2020 (Black), 2021 (Blue) and 2022 (Red).
The dashed line is the percent of 2019 for the seven-day average.
The 7-day average is down 9.5% from the same day in 2019 (90.5% of 2019). (Dashed line)
Air travel has been moving sideways over the last month, off about 10% from 2019.
The second graph shows the 7-day average of the year-over-year change in diners as tabulated by OpenTable for the US and several selected cities.
IMPORTANT: OpenTable notes that all data is compared to 2019. Thanks!
 Thanks to OpenTable for providing this restaurant data:
This data is updated through April 9, 2022.
This data is "a sample of restaurants on the OpenTable network across all channels: online reservations, phone reservations, and walk-ins. For year-over-year comparisons by day, we compare to the same day of the week from the same week in the previous year."
Dining was mostly moving sideways but declined during the winter wave of COVID and is now increasing. The 7-day average for the US is down 1% compared to 2019.
 This data shows domestic box office for each week and the median for the years 2016 through 2019 (dashed light blue).
 Black is 2020, Blue is 2021 and Red is 2022.
The data is from BoxOfficeMojo through April 7th.
Note that the data is usually noisy week-to-week and depends on when blockbusters are released.
Movie ticket sales were at $101 million last week, down about 52% from the median for the week.
Note that the data is usually noisy week-to-week and depends on when blockbusters are released.
Movie ticket sales were at $101 million last week, down about 52% from the median for the week.
 This graph shows the seasonal pattern for the hotel occupancy rate using the four-week average.
 The red line is for 2022, black is 2020, blue is the median, and dashed light blue is for 2021.
This data is through April 2nd. The occupancy rate was down 6.4% compared to the same week in 2019.
The 4-week average of the occupancy rate is just below the median rate for the previous 20 years (Blue).
Notes: Y-axis doesn't start at zero to better show the seasonal change.
Notes: Y-axis doesn't start at zero to better show the seasonal change.
The 4-week average of the occupancy rate will now mostly move sideways seasonally until the summer.
NOTE: This is the last Apple update. Apple will stop providing this data on April 14th.
This graph is from Apple mobility. From Apple: "This data is generated by counting the number of requests made to Apple Maps for directions in select countries/regions, sub-regions, and cities." This is just a general guide - people that regularly commute probably don't ask for directions.
 This data is through April 9th
 This data is through April 9th
 for the United States and several selected cities.
The graph is the running 7-day average to remove the impact of weekends.
IMPORTANT: All data is relative to January 13, 2020. This data is NOT Seasonally Adjusted. People walk and drive more when the weather is nice, so I'm just using the transit data.
According to the Apple data directions requests, public transit in the 7-day average for the US is at 125% of the January 2020 level.
Here is some interesting data on New York subway usage (HT BR).
 This graph is from Todd W Schneider.
 This graph shows how much MTA traffic has recovered in each borough (Graph starts at first week in January 2020 and 100 = 2019 average).
Manhattan is at about 39% of normal.
This data is through Friday, April 8th.
He notes: "Data updates weekly from the MTA’s public turnstile data, usually on Saturday mornings".
Sunday, April 10, 2022
Sunday Night Futures
by Calculated Risk on 4/10/2022 08:12:00 PM
Weekend:
• Schedule for Week of April 10, 2022
Monday:
• No major economic releases scheduled.
From CNBC: Pre-Market Data and Bloomberg futures S&P 500 are down 7 and DOW futures are down 55 (fair value).
Oil prices were down over the last week with WTI futures at $96.82 per barrel and Brent at $101.30 per barrel. A year ago, WTI was at $60 and Brent was at $62 - so WTI oil prices are up 60% year-over-year.
Here is a graph from Gasbuddy.com for nationwide gasoline prices. Nationally prices are at $4.10 per gallon. A year ago prices were at $2.86 per gallon, so gasoline prices are up $1.24 per gallon year-over-year.
Second Home Markets and FHFA Changes as of April 1st
by Calculated Risk on 4/10/2022 12:03:00 PM
Today, in the Calculated Risk Real Estate Newsletter: Second Home Markets and FHFA Changes as of April 1st
A brief excerpt:
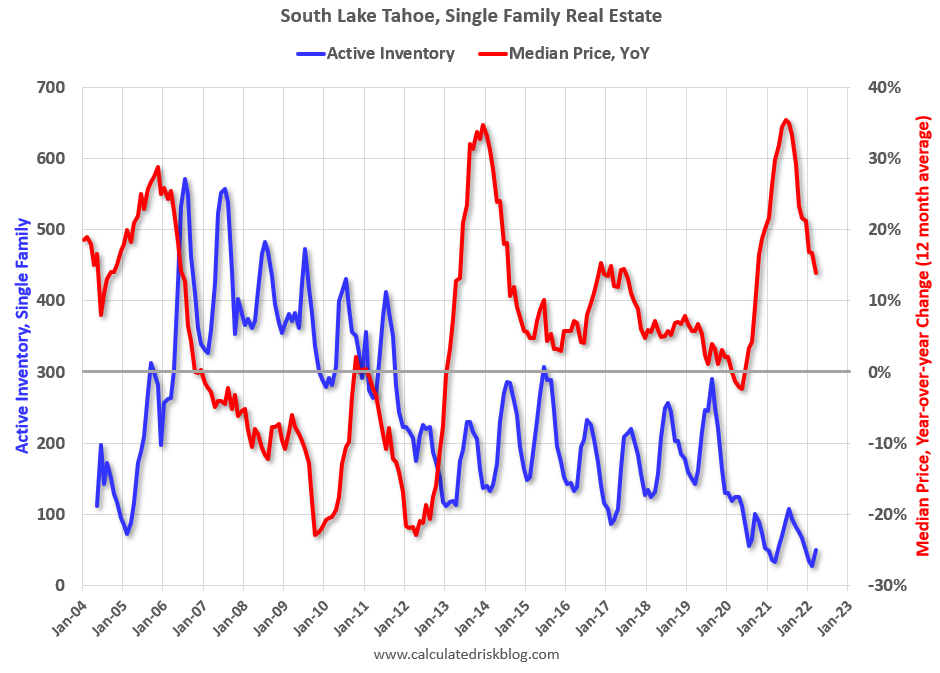
Earlier this year the FHFA announced “Targeted Increases to Enterprise Pricing Framework”. Effective April 1st (just over a week ago), these higher fees applied to certain high balance loans, and to second home loans (for Fannie and Freddie). Excerpt:There is more in the article. You can subscribe at https://calculatedrisk.substack.com/... In April, upfront fees for high balance loans will increase between 0.25 percent and 0.75 percent, tiered by loan-to-value ratio. Fannie Mae and Freddie Mac refer to these mortgages as high balance loans and super conforming loans, respectively. For second home loans, upfront fees will increase between 1.125 percent and 3.875 percent, tiered by loan-to-value ratio.South Lake Tahoe: Second Home Market
emphasis added
...
Click on graph for larger image.
With the pandemic, there was a surge in second home buying. One of the second home markets I’ve been tracking is South Lake Tahoe.The following graph is for single family homes in South Lake Tahoe since 2004 through March 2022, and shows inventory (blue), and the year-over-year (YoY) change in the median price (12-month average).Note: The median price is distorted by the mix, but this is the available data.
...
This will be interesting to watch over the next several months, but so far there isn't any evidence of a second home slowdown in these numbers.
Saturday, April 09, 2022
Real Estate Newsletter Articles this Week
by Calculated Risk on 4/09/2022 02:11:00 PM
At the Calculated Risk Real Estate Newsletter this week:
• "Unpacking builders’ market sentiment with Rick Palacios"
• 1st Look at Local Housing Markets in March
• Rents Still Increasing Sharply Year-over-year
• Denver Real Estate: Active Inventory up Sharply in March
• Black Knight Mortgage Monitor for February; "Tightest affordability in 15 years"
This is usually published several times a week and provides more in-depth analysis of the housing market.
The blog will continue as always!
You can subscribe at https://calculatedrisk.substack.com/
Most content is available for free (and no Ads), but please subscribe!
Schedule for Week of April 10, 2022
by Calculated Risk on 4/09/2022 08:11:00 AM
The key reports this week are March CPI and retail sales.
For manufacturing, the March Industrial Production report and the April NY Fed manufacturing survey will be released this week.
No major economic releases scheduled.
6:00 AM ET: NFIB Small Business Optimism Index for March.
8:30 AM: The Consumer Price Index for March from the BLS. The consensus is for 1.2% increase in CPI (up 8.5% YoY) and a 0.5% increase in core CPI (up 6.6% YoY).
7:00 AM ET: The Mortgage Bankers Association (MBA) will release the results for the mortgage purchase applications index.
8:30 AM: The Producer Price Index for March from the BLS. The consensus is for a 1.1% increase in PPI, and a 0.5% increase in core PPI.
8:30 AM: The initial weekly unemployment claims report will be released. The consensus is for a increase to 175 thousand from 166 thousand last week.
 8:30 AM: Retail sales for March is scheduled to be released. The consensus is for a 0.6% increase in retail sales.
 This graph shows the year-over-year change in retail sales and food service (ex-gasoline) since 1993. Retail and Food service sales, ex-gasoline, increased by 16.1% on a YoY basis in February.
10:00 AM: University of Michigan's Consumer sentiment index (Preliminary for April).
8:30 AM: The New York Fed Empire State manufacturing survey for April. The consensus is for a reading of 2.0, up from -11.8.
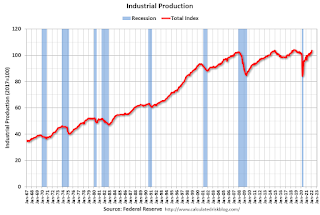 9:15 AM: The Fed will release Industrial Production and Capacity Utilization for March.
This graph shows industrial production since 1967.
The consensus is for a 0.4% increase in Industrial Production, and for Capacity Utilization to increase to 77.8%.
10:00 AM: State Employment and Unemployment (Monthly) for March 2022
Friday, April 08, 2022
COVID Update: Deaths Under 500 per day, Lowest since August 2021
by Calculated Risk on 4/08/2022 10:02:00 PM
On COVID (focus on hospitalizations and deaths):
| COVID Metrics | ||||
|---|---|---|---|---|
| Now | Week Ago | Goal | ||
| Percent fully Vaccinated | 65.7% | --- | ≥70.0%1 | |
| Fully Vaccinated (millions) | 218.1 | --- | ≥2321 | |
| New Cases per Day3🚩 | 26,595 | 25,362 | ≤5,0002 | |
| Hospitalized3 | 10,164 | 11,990 | ≤3,0002 | |
| Deaths per Day3 | 496 | 637 | ≤502 | |
| 1 Minimum to achieve "herd immunity" (estimated between 70% and 85%). 2my goals to stop daily posts, 37-day average for Cases, Currently Hospitalized, and Deaths 🚩 Increasing 7-day average week-over-week for Cases, Hospitalized, and Deaths ✅ Goal met. | ||||
 Click on graph for larger image.
This graph shows the daily (columns) and 7-day average (line) of deaths reported.
Average daily deaths are the lowest since August 1st, 2021. The pandemic low (after initial surge) was just over 200 in July 2021.
Reis: Regional Mall Vacancy Rate Decreased in Q1
by Calculated Risk on 4/08/2022 03:08:00 PM
Reis reported that the vacancy rate for regional malls was 11.0% in Q1 2022, down from 11.2% in Q4 2021, and down from 11.4% in Q1 2021. The regional mall vacancy rate peaked at 11.5% in Q2 2021.
For Neighborhood and Community malls (strip malls), the vacancy rate was 10.3% in Q1, unchanged from 10.3% in Q4, and down from 10.6% in Q1 2021. For strip malls, the vacancy rate peaked during the pandemic at 10.6% in both Q1 and Q2 2021.
 Click on graph for larger image.
This graph shows the strip mall vacancy rate starting in 1980 (prior to 2000 the data is annual). The regional mall data starts in 2000. Back in the '80s, there was overbuilding in the mall sector even as the vacancy rate was rising. This was due to the very loose commercial lending that led to the S&L crisis.
In the mid-'00s, mall investment picked up as mall builders followed the "roof tops" of the residential boom (more loose lending). This led to the vacancy rate moving higher even before the recession started. Then there was a sharp increase in the vacancy rate during the recession and financial crisis.
In the last several years, even prior to the pandemic, the regional mall vacancy rates increased significantly from an already elevated level.
Effective rents have been mostly unchanged for regional malls over the last 3 years, and flat for strip malls for 5+ years.
Mall vacancy data courtesy of Reis
Mall vacancy data courtesy of Reis
Reis: Office Vacancy Rates Unchanged in Q1
by Calculated Risk on 4/08/2022 01:40:00 PM
Reis reported the office vacancy rate was at 18.1% in Q1 2022, unchanged from 18.1% in Q4, and down from 18.2% in Q1 2021.
Q2 2021 saw the highest vacancy rate for offices since the early '90s (following the S&L crisis)
NOTE: This says nothing about how many people are in the offices (related to the increase in work-from-home), just whether or not the office space is leased.
 Click on graph for larger image.
This graph shows the office vacancy rate starting in 1980 (prior to 1999 the data is annual).
The office vacancy rate was elevated prior to the pandemic and moved up during the pandemic.
Reis also reported that office effective rents were essentially unchanged in Q1; rents are about at the same rate as early 2019.
All vacancy data courtesy of Reis


