 RSS Feed
 by Calculated Risk on 4/14/2022 03:56:00 PM
Thursday, April 14, 2022
LA Area Port Traffic: Record March Inbound Traffic
Notes: The expansion to the Panama Canal was completed in 2016 (As I noted a few years ago), and some of the traffic that used the ports of Los Angeles and Long Beach is probably going through the canal. This might be impacting TEUs on the West Coast.
Container traffic gives us an idea about the volume of goods being exported and imported - and usually some hints about the trade report since LA area ports handle about 40% of the nation's container port traffic.
The following graphs are for inbound and outbound traffic at the ports of Los Angeles and Long Beach in TEUs (TEUs: 20-foot equivalent units or 20-foot-long cargo container).
To remove the strong seasonal component for inbound traffic, the first graph shows the rolling 12-month average.
 Click on graph for larger image.
On a rolling 12-month basis, inbound traffic was up 0.2% in March compared to the rolling 12 months ending in February. Outbound traffic was down 1.4% compared to the rolling 12 months ending the previous month.
The 2nd graph is the monthly data (with a strong seasonal pattern for imports).
 Usually imports peak in the July to October period as retailers import goods for the Christmas holiday, and then decline sharply and bottom in February or March depending on the timing of the Chinese New Year.
Imports were up 3% YoY in March, and exports were down 14% YoY.
This was record inbound traffic for the month of March.
3rd Look at Local Housing Markets in March
by Calculated Risk on 4/14/2022 02:21:00 PM
Today, in the Calculated Risk Real Estate Newsletter: 3rd Look at Local Housing Markets in March
A brief excerpt:
Adding Austin, Charlotte, Houston, Maryland, North Texas, Pennsylvania, South Carolina, and Washington, D.C.There is much more in the article. You can subscribe at Calculated Risk Real Estate Newsletter
...
The next milestone will be when inventory is up year-over-year (YoY). My current guess is inventory will be YoY near mid-year or in Q3.
...
Inventory was up 9.8% in March MoM from February, and down 15.8% YoY. Inventory in about 40% of these markets was already up YoY.
It appears inventory bottomed in February. Last month, these markets were down 25.2% YoY, so this is a significant change from February. This is the first step towards a more balanced market, but inventory levels are still very low.
Notes for all tables:
1) New additions to table in BOLD.
2) Northwest (Seattle), North Texas (Dallas) and Santa Clara (San Jose), Jacksonville, Source: Northeast Florida Association of REALTORS®
3) Totals do not include Atlanta or Denver (included in state totals).

Retail Sales Increased 0.5% in March
by Calculated Risk on 4/14/2022 08:45:00 AM
On a monthly basis, retail sales were increased 0.5% from February to March (seasonally adjusted), and sales were up 6.9 percent from March 2021.
From the Census Bureau report:
Advance estimates of U.S. retail and food services sales for March 2022, adjusted for seasonal variation and holiday and trading-day differences, but not for price changes, were $665.7 billion, an increase of 0.5 percent from the previous month, and 6.9 percent above March 2021. ... The January 2022 to February 2022 percent change was revised from up 0.3 percent to up 0.8 percent.
emphasis added
 Click on graph for larger image.
This graph shows retail sales since 1992. This is monthly retail sales and food service, seasonally adjusted (total and ex-gasoline).
Retail sales ex-gasoline were down 0.3% in March.
The second graph shows the year-over-year change in retail sales and food service (ex-gasoline) since 1993.
 Retail and Food service sales, ex-gasoline, increased by 4.4% on a YoY basis.
Sales growth in March was slightly below expectations, however, sales in January and February were revised up, combined.
Weekly Initial Unemployment Claims Increase to 185,000
by Calculated Risk on 4/14/2022 08:34:00 AM
The DOL reported:
In the week ending April 9, the advance figure for seasonally adjusted initial claims was 185,000, an increase of 18,000 from the previous week's revised level. The previous week's level was revised up by 1,000 from 166,000 to 167,000. The 4-week moving average was 172,250, an increase of 2,000 from the previous week's revised average. The previous week's average was revised up by 250 from 170,000 to 170,250.The following graph shows the 4-week moving average of weekly claims since 1971.
emphasis added
 Click on graph for larger image.
The dashed line on the graph is the current 4-week average. The four-week average of weekly unemployment claims decreased to 170,000.
The previous week was revised up.
Weekly claims were well above the consensus forecast.
Wednesday, April 13, 2022
Thursday: Retail Sales, Unemployment Claims
by Calculated Risk on 4/13/2022 09:46:00 PM
Thursday:
• At 8:30 AM ET, The initial weekly unemployment claims report will be released. The consensus is for a increase to 175 thousand from 166 thousand last week.
• At 8:30 AM, Retail sales for March is scheduled to be released. The consensus is for a 0.6% increase in retail sales.
• At 10:00 AM, University of Michigan's Consumer sentiment index (Preliminary for April).
On COVID (focus on hospitalizations and deaths):
| COVID Metrics | ||||
|---|---|---|---|---|
| Now | Week Ago | Goal | ||
| Percent fully Vaccinated | 65.8% | --- | ≥70.0%1 | |
| Fully Vaccinated (millions) | 218.5 | --- | ≥2321 | |
| New Cases per Day3🚩 | 29,401 | 26,563 | ≤5,0002 | |
| Hospitalized3 | 9,674 | 10,590 | ≤3,0002 | |
| Deaths per Day3 | 452 | 517 | ≤502 | |
| 1 Minimum to achieve "herd immunity" (estimated between 70% and 85%). 2my goals to stop daily posts, 37-day average for Cases, Currently Hospitalized, and Deaths 🚩 Increasing 7-day average week-over-week for Cases, Hospitalized, and Deaths ✅ Goal met. | ||||
 Click on graph for larger image.
This graph shows the daily (columns) and 7-day average (line) of deaths reported.
New cases are increasing.
Office Vacancy Rates for Two SoCal Counties
by Calculated Risk on 4/13/2022 02:05:00 PM
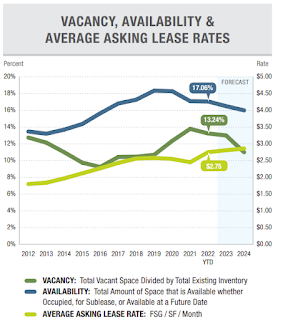
Voit released their Q1 CRE reports today. These reports are for several cities in the west (these are for several categories of CRE - offices, retail, industrial). There is plenty of detail for those interested in Commercial Real Estate.
Overall vacancy rates are not that much higher than prior to the pandemic and asking lease rates have continued to increase.
The following graphs show vacancy rate and lease rates for offices in Orange County and San Diego.
 Click on graph for larger image.
The first graph is from Voit for Orange County (not labeled). From Voit: The 2nd graph is for San Diego.
From Voit:
The following graphs show vacancy rate and lease rates for offices in Orange County and San Diego.
 Click on graph for larger image.
The first graph is from Voit for Orange County (not labeled). From Voit:
The office market really suffered during the worst of the pandemic, as the initial lockdown essentially shut it down in Q2 of 2020 and the majority of office workers scrambled to adapt to technologies that allowed them to work from home. Ongoing safety protocols made it is especially difficult for building owners and office-centric business owners to get people back in the office. Even today, with the worst of the health crisis behind us, less than half of office workers are back at their desks on a regular basis. High-rise and mid-rise buildings are facing the biggest challenge because of employee density and dependence on elevators for access to individual spaces. Add the fact that many businesses are considering long-term adoption of a work-from-home or hybrid model for their workforces, and it is easy to see that the office market still has some major challenges to overcome.
...
After two years of consistent upward pressure on vacancy, the overall rate in Q1 actually declined by a substantial margin, shedding 55 basis points to end the period at 13.24%. That’s just 9 basis points higher than it was in Q1 of 2021, further evidence that the market is stabilizing.
 The 2nd graph is for San Diego.
From Voit:
The office market started 2022 on a bright note with leasing in line with historical norms for the first time since the onset of COVID. Fundamental metrics point towards a healthy office market in 1Q with positive net absorption, rising rental rates, and a decrease in the availability rate. The current health of the office market is being buoyed by the rapid expansion of San Diego’s biotech industry.
How High will Mortgage Rates Rise?
by Calculated Risk on 4/13/2022 11:05:00 AM
Today, in the Calculated Risk Real Estate Newsletter: How High will Mortgage Rates Rise?
A brief excerpt:
Currently most forecasts are for the Fed Funds rate to rise to around 3.25%. Goldman Sach’s chief economist Jan Hatzius recently said he thinks the Fed may have to raise rates above 4%, although their baseline forecast is just about 3%.There is much more in the article. You can subscribe at Calculated Risk Real Estate Newsletter
When the Fed Funds rate peaks in this cycle, the yield curve will likely be fairly flat - meaning the 10-year treasury yield will be at about the same level as the Fed Funds rate. Based on the current estimate for the peak Fed Funds rate (3.25% to 4.0%), the 30-year fixed mortgage will likely peak at between 5.0% and 5.7%. There is some variability in the relationship, so we might see rates as high as the low 6% range. (This all depends on inflation and the Fed Funds rate - but I don’t expect rates to move much higher than the current rate - although 6% is possible).
MBA: Mortgage Applications Decrease in Latest Weekly Survey
by Calculated Risk on 4/13/2022 07:00:00 AM
Mortgage applications decreased 1.3 percent from one week earlier, according to data from the Mortgage Bankers Association’s (MBA) Weekly Mortgage Applications Survey for the week ending April 8, 2022.
... The Refinance Index decreased 5 percent from the previous week and was 62 percent lower than the same week one year ago. The seasonally adjusted Purchase Index increased 1 percent from one week earlier. The unadjusted Purchase Index increased 2 percent compared with the previous week and was 6 percent lower than the same week one year ago.
“Mortgage rates across all loan types continued to move higher, with the 30-year fixed rate exceeding the 5-percent mark to 5.13 percent – the highest since November 2018. Refinance activity as a result declined to the slowest weekly pace since 2019,” said Joel Kan, MBA’s Associate Vice President of Economic and Industry Forecasting. “Higher rates are increasing borrower interest in ARMs. Their share of applications last week was at 7.4 percent, which was the highest share since June 2019. In a promising sign of strong purchase demand amidst affordability challenges, both conventional and government purchase applications increased.”
Given the faster than expected increase in mortgage rates, and the likelihood of more aggressive actions from the Federal Reserve to curb inflation, MBA’s April 2022 forecast now calls for mortgage originations to total $2.58 trillion in 2022 – a 35.5 percent decline from 2021. Purchase originations are still forecasted to reach a record $1.72 trillion this year – a 4 percent increase from 2021. Refinance originations are now expected to fall 64 percent to $841 billion.
...
The average contract interest rate for 30-year fixed-rate mortgages with conforming loan balances ($647,200 or less) increased to 5.13 percent from 4.90 percent, with points increasing to 0.63 from 0.53 (including the origination fee) for 80 percent loan-to-value ratio (LTV) loans.
emphasis added
 Click on graph for larger image.
The first graph shows the refinance index since 1990.
With higher mortgage rates, the refinance index has declined sharply over the last several months.
The refinance index is at the lowest level since March 2019.
The second graph shows the MBA mortgage purchase index
 According to the MBA, purchase activity is down 6% year-over-year unadjusted.
Note: Red is a four-week average (blue is weekly).
Tuesday, April 12, 2022
Wednesday: PPI
by Calculated Risk on 4/12/2022 09:41:00 PM
Wednesday:
• At 7:00 AM ET, The Mortgage Bankers Association (MBA) will release the results for the mortgage purchase applications index.
• At 8:30 AM, The Producer Price Index for March from the BLS. The consensus is for a 1.1% increase in PPI, and a 0.5% increase in core PPI.
On COVID (focus on hospitalizations and deaths):
| COVID Metrics | ||||
|---|---|---|---|---|
| Now | Week Ago | Goal | ||
| Percent fully Vaccinated | 65.8% | --- | ≥70.0%1 | |
| Fully Vaccinated (millions) | 218.5 | --- | ≥2321 | |
| New Cases per Day3🚩 | 30,496 | 25,208 | ≤5,0002 | |
| Hospitalized3 | 9,704 | 10,807 | ≤3,0002 | |
| Deaths per Day3 | 507 | 540 | ≤502 | |
| 1 Minimum to achieve "herd immunity" (estimated between 70% and 85%). 2my goals to stop daily posts, 37-day average for Cases, Currently Hospitalized, and Deaths 🚩 Increasing 7-day average week-over-week for Cases, Hospitalized, and Deaths ✅ Goal met. | ||||
 Click on graph for larger image.
This graph shows the daily (columns) and 7-day average (line) of deaths reported.
New cases are increasing again.
2nd Look at Local Housing Markets in March
by Calculated Risk on 4/12/2022 03:02:00 PM
Today, in the Calculated Risk Real Estate Newsletter: 2nd Look at Local Housing Markets in March
A brief excerpt:
Here is a summary of active listings for these housing markets in March. Note: Inventory usually increases seasonally in March, so the month-over-month (MoM) increase is not surprising.There is much more in the article. You can subscribe at Calculated Risk Real Estate Newsletter
Inventory was up 9.3% in March MoM from February, and down 13.4% year-over-year (YoY). Inventory in about half of these markets was up YoY.
It appears inventory bottomed in February. Last month, these markets were down 23.3% YoY, so this is a significant change from February. This is the first step towards a more balanced market, but inventory levels are still very low.
Notes for all tables:
1) New additions to table in BOLD.
2) Northwest (Seattle) and Santa Clara (San Jose), Jacksonville, Source: Northeast Florida Association of REALTORS®
3) Totals do not include Atlanta or Denver (included in state totals).


