 RSS Feed
 by Calculated Risk on 4/18/2022 08:33:00 AM
Monday, April 18, 2022
Housing Inventory April 18th Update: Inventory up 3.7% Week-over-week; Up 12.3% from Seasonal Bottom
Tracking existing home inventory is very important in 2022.
Inventory usually declines in the winter, and then increases in the spring. Inventory bottomed seasonally at the beginning of March 2022 and is now up 12.3% since then.
 Click on graph for larger image in graph gallery.
This inventory graph is courtesy of Altos Research.
As of April 15th, inventory was at 271 thousand (7-day average), compared to 261 thousand the prior week. Inventory was UP 3.7% from the previous week.
Last year inventory bottomed seasonally in April 2021 - very late in the year. This year, by this measure, inventory bottomed seasonally at the beginning of March.
Inventory is still very low. Compared to the same week in 2021, inventory is down 13.1% from 312 thousand, and compared to the same week in 2020, and inventory is down 63.9% from 749 thousand.
One of the keys will be to watch the year-over-year change each week to see if the declines are decreasing. Here is a table of the year-over-year change by week since the beginning of the year.
| Week Ending | YoY Change |
|---|---|
| 12/31/2021 | -30.0% |
| 1/7/2022 | -26.0% |
| 1/14/2022 | -28.6% |
| 1/21/2022 | -27.1% |
| 1/28/2022 | -25.9% |
| 2/4/2022 | -27.9% |
| 2/11/2022 | -27.5% |
| 2/18/2022 | -25.8% |
| 2/25/2022 | -24.9% |
| 3/4/2022 | -24.2% |
| 3/11/2022 | -21.7% |
| 3/18/2022 | -21.7% |
| 3/25/2022 | -19.0% |
| 4/1/2022 | -17.6% |
| 4/8/2022 | -14.8% |
| 4/15/2022 | -13.1% |

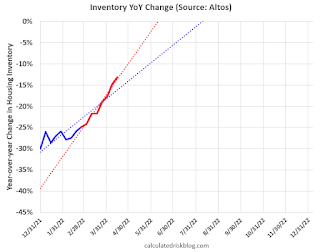
Here is a graph of the year-over-year change in the Altos data.
The blue trend line is from the beginning of the year, and the red trend line is over the last 8 weeks.
Currently it appears inventory will be up year-over-year sometime mid-year 2022.
Mike Simonsen discusses this data regularly on Youtube.
Sunday, April 17, 2022
Monday: Homebuilder Suvery
by Calculated Risk on 4/17/2022 07:06:00 PM
Weekend:
• Schedule for Week of April 17, 2022
Monday:
• At 10:00 AM ET, The April NAHB homebuilder survey. The consensus is for a reading of 77, down from 79. Any number above 50 indicates that more builders view sales conditions as good than poor.
From CNBC: Pre-Market Data and Bloomberg futures S&P 500 are down 15 and DOW futures are down 80 (fair value).
Oil prices were up over the last week with WTI futures at $106.95 per barrel and Brent at $111.70 per barrel. A year ago, WTI was at $63 and Brent was at $66 - so WTI oil prices are up 70% year-over-year.
Here is a graph from Gasbuddy.com for nationwide gasoline prices. Nationally prices are at $4.06 per gallon. A year ago prices were at $2.85 per gallon, so gasoline prices are up $1.21 per gallon year-over-year.
BLS: 12 States Set New Record Series Low Unemployment rates in March
by Calculated Risk on 4/17/2022 01:08:00 PM
On Friday, from the BLS: Regional and State Employment and Unemployment Summary
Unemployment rates were lower in March in 37 states and stable in 13 states and the District of Columbia, the U.S. Bureau of Labor Statistics reported today. All 50 states and the District had jobless rate decreases from a year earlier.
...
Nebraska and Utah had the lowest jobless rates in March, 2.0 percent each. The next lowest rates were in Indiana, 2.2 percent, and Montana, 2.3 percent. The rates in these four states set new series lows, as did the rates in the following eight states (all state series begin in 1976): Alaska (5.0 percent), Arizona (3.3 percent), Georgia (3.1 percent), Idaho (2.7 percent), Mississippi (4.2 percent), Tennessee (3.2 percent), West Virginia (3.7 percent), and Wisconsin (2.8 percent). The District of Columbia had the highest unemployment rate, 6.0 percent, followed by New Mexico, 5.3 percent.
emphasis added
 Click on graph for larger image.
This graph shows the number of states (and D.C.) with unemployment rates at or above certain levels since January 2006.
Twelve states set new series record low unemployment rates in March, and currently 17 states are at series record low unemployment rates.
Saturday, April 16, 2022
Real Estate Newsletter Articles this Week
by Calculated Risk on 4/16/2022 02:11:00 PM
At the Calculated Risk Real Estate Newsletter this week:
• Second Home Markets and FHFA Changes as of April 1st
• Apartment Vacancy Rate Declined in Q1 Effective Rents up 15.6% Year-over-year
• 2nd Look at Local Housing Markets in March
• How High will Mortgage Rates Rise?
• 3rd Look at Local Housing Markets in March
• Twin Cities: No Slowdown in Showings
This is usually published several times a week and provides more in-depth analysis of the housing market.
The blog will continue as always!
You can subscribe at https://calculatedrisk.substack.com/
Most content is available for free (and no Ads), but please subscribe!
Schedule for Week of April 17, 2022
by Calculated Risk on 4/16/2022 08:11:00 AM
The key reports this week are March Housing Starts and Existing Home Sales.
10:00 AM: The April NAHB homebuilder survey. The consensus is for a reading of 77, down from 79. Any number above 50 indicates that more builders view sales conditions as good than poor.
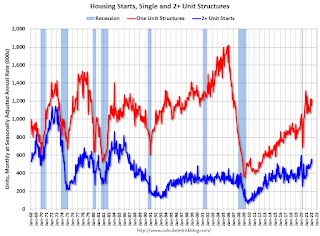 8:30 AM ET: Housing Starts for March.
 This graph shows single and multi-family housing starts since 1968.
The consensus is for 1.750 million SAAR, down from 1.769 million SAAR in February.
7:00 AM ET: The Mortgage Bankers Association (MBA) will release the results for the mortgage purchase applications index.
 10:00 AM: Existing Home Sales for March from the National Association of Realtors (NAR). The consensus is for 5.80 million SAAR, down from 6.02 million.
The graph shows existing home sales from 1994 through the report last month.
During the day: The AIA's Architecture Billings Index for March (a leading indicator for commercial real estate).
2:00 PM: the Federal Reserve Beige Book, an informal review by the Federal Reserve Banks of current economic conditions in their Districts.
8:30 AM: The initial weekly unemployment claims report will be released. The consensus is for 185 thousand from 185 thousand last week.
8:30 AM: the Philly Fed manufacturing survey for April. The consensus is for a reading of 20.0, down from 27.4.
1:00 PM: Discussion, Fed Chair Pro Tempore Jerome Powell, The Global Economy, At the International Monetary Fund Debate on the Global Economy
No major economic releases scheduled.
Friday, April 15, 2022
Twin Cities: No Slowdown in Showings
by Calculated Risk on 4/15/2022 07:43:00 PM
Today, in the Calculated Risk Real Estate Newsletter: Twin Cities: No Slowdown in Showings
A brief excerpt:
The first graph shows the 7-day average showings for the Twin Cities area for 2019, 2020, 2021, and 2022.There is much more in the article. You can subscribe at Calculated Risk Real Estate Newsletter
There was a huge dip in showings in 2020 (black) at the start of the pandemic, and then showing were well above 2019 (blue) levels for the rest of the year. And showings in 2021 (gold) were very strong in the first half of the year, and then were closer to 2019 in the 2nd half.
Note that there were dips in showings during holidays (July 4th, Memorial Day, Thanksgiving and Christmas), and also dips related to protests and curfews related to the deaths of George Floyd and Daunte Wright.
So far, 2022 (red) has started off somewhat above 2019.

Hotels: Occupancy Rate Down 4.7% Compared to Same Week in 2019
by Calculated Risk on 4/15/2022 12:25:00 PM
U.S. hotel performance increased from the previous week, according to STR‘s latest data through April 9.The following graph shows the seasonal pattern for the hotel occupancy rate using the four-week average.
April 3-9, 2022 (percentage change from comparable week in 2019*):
• Occupancy: 66.4% (-4.7%)
• Average daily rate (ADR): $150.45 (+10.6%)
• Revenue per available room (RevPAR): $99.93 (+5.4%)
*Due to the pandemic impact, STR is measuring recovery against comparable time periods from 2019.
emphasis added
 Click on graph for larger image.
The red line is for 2022, black is 2020, blue is the median, and dashed light blue is for 2021.
The 4-week average of the occupancy rate is just above the median rate for the previous 20 years (Blue).
Note: Y-axis doesn't start at zero to better show the seasonal change.
The 4-week average of the occupancy rate will now mostly move sideways seasonally until the summer.
Q1 GDP Forecasts: Around 1%
by Calculated Risk on 4/15/2022 10:42:00 AM
From Goldman:
Following [yesterday]’s upward revisions to retail sales, we boosted our Q1 GDP tracking estimate by 0.5pp to +1.5% (qoq ar). [April 14 estimate]And from the Altanta Fed: GDPNow
emphasis added
The GDPNow model estimate for real GDP growth (seasonally adjusted annual rate) in the first quarter of 2022 is 1.1 percent on April 14, unchanged from April 8 after rounding. After recent releases from the US Census Bureau, the US Bureau of Labor Statistics, and the US Department of the Treasury’s Bureau of the Fiscal Service, modest increases in the nowcasts of real personal consumption expenditures growth and real net exports were offset by declines in the nowcasts of real government spending growth and real residential investment growth. [April 14 estimate]
Industrial Production Increased 0.9 Percent in March
by Calculated Risk on 4/15/2022 09:21:00 AM
From the Fed: Industrial Production and Capacity Utilization
Total industrial production advanced 0.9 percent in March and rose at an annual rate of 8.1 percent for the first quarter. Manufacturing output gained 0.9 percent in March; the output of motor vehicles and parts jumped 7.8 percent, while factory output elsewhere moved up 0.4 percent. The index for utilities increased 0.4 percent, and the index for mining advanced 1.7 percent. At 104.6 percent of its 2017 average, total industrial production in March was 5.5 percent above its year-earlier level. Capacity utilization climbed to 78.3 percent, a rate that is 1.2 percentage points below its long-run (1972–2021) average.
emphasis added
 Click on graph for larger image.
This graph shows Capacity Utilization. This series is up from the record low set in April 2020, and above the level in February 2020 (pre-pandemic).
Capacity utilization at 78.3% is 1.1% below the average from 1972 to 2020. This was above consensus expectations.
Note: y-axis doesn't start at zero to better show the change.
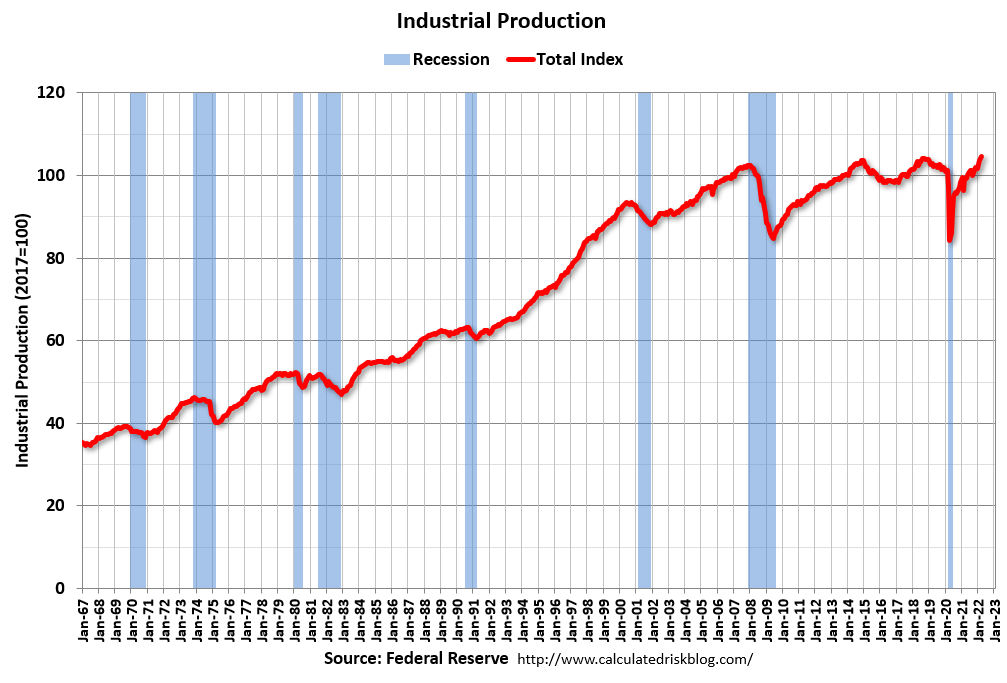 The second graph shows industrial production since 1967.
Industrial production increased in March to 104.6. This is above the February 2020 level.
The change in industrial production was above consensus expectations.
Thursday, April 14, 2022
Friday: NY Fed Mfg, Industrial Production
by Calculated Risk on 4/14/2022 09:12:00 PM
Friday:
• At 8:30 AM ET, The New York Fed Empire State manufacturing survey for April. The consensus is for a reading of 2.0, up from -11.8.
• At 9:15 AM, The Fed will release Industrial Production and Capacity Utilization for March. The consensus is for a 0.4% increase in Industrial Production, and for Capacity Utilization to increase to 77.8%.
• At 10:00 AM, State Employment and Unemployment (Monthly) for March 2022
On COVID (focus on hospitalizations and deaths):
| COVID Metrics | ||||
|---|---|---|---|---|
| Now | Week Ago | Goal | ||
| Percent fully Vaccinated | 65.9% | --- | ≥70.0%1 | |
| Fully Vaccinated (millions) | 218.7 | --- | ≥2321 | |
| New Cases per Day3🚩 | 31,391 | 26,357 | ≤5,0002 | |
| Hospitalized3 | 9,594 | 10,411 | ≤3,0002 | |
| Deaths per Day3 | 409 | 485 | ≤502 | |
| 1 Minimum to achieve "herd immunity" (estimated between 70% and 85%). 2my goals to stop daily posts, 37-day average for Cases, Currently Hospitalized, and Deaths 🚩 Increasing 7-day average week-over-week for Cases, Hospitalized, and Deaths ✅ Goal met. | ||||
 Click on graph for larger image.
This graph shows the daily (columns) and 7-day average (line) of deaths reported.
New cases are increasing.


