 RSS Feed
 by Calculated Risk on 4/19/2022 08:36:00 AM
Tuesday, April 19, 2022
Housing Starts Increased to 1.793 million Annual Rate in March
From the Census Bureau: Permits, Starts and Completions
Housing Starts:
Privately‐owned housing starts in March were at a seasonally adjusted annual rate of 1,793,000. This is 0.3 percent above the revised February estimate of 1,788,000 and is 3.9 percent above the March 2021 rate of 1,725,000. Single‐family housing starts in March were at a rate of 1,200,000; this is 1.7 percent below the revised February figure of 1,221,000. The March rate for units in buildings with five units or more was 574,000.
Building Permits:
Privately‐owned housing units authorized by building permits in March were at a seasonally adjusted annual rate of 1,873,000. This is 0.4 percent above the revised February rate of 1,865,000 and is 6.7 percent above the March 2021 rate of 1,755,000. Single‐family authorizations in March were at a rate of 1,147,000; this is 4.8 percent below the revised February figure of 1,205,000. Authorizations of units in buildings with five units or more were at a rate of 672,000 in March.
emphasis added
 Click on graph for larger image.
The first graph shows single and multi-family housing starts for the last several years.
Multi-family starts (blue, 2+ units) increased in March compared to February. Multi-family starts were up 26.2% year-over-year in March.
Single-family starts (red) decreased in March and were down 4.4% year-over-year.
 The second graph shows single and multi-family housing starts since 1968.
 This shows the huge collapse following the housing bubble, and then the eventual recovery (but still not historically high).
Total housing starts in March were above expectations, and starts in January and February were revised up, combined.
I'll have more later …
Monday, April 18, 2022
Tuesday: Housing Starts
by Calculated Risk on 4/18/2022 09:02:00 PM
From Matthew Graham at Mortgage News Daily: Rates Jump Back Up to Match Multi-Year Highs
The average mortgage lender was quoting conventional 30yr fixed rates of 5.25% last Monday for top tier scenarios--the highest since late 2018. [30 year fixed 5.25%]Tuesday:
emphasis added
• 8:30 AM ET, Housing Starts for March. The consensus is for 1.750 million SAAR, down from 1.769 million SAAR in February.
On COVID (focus on hospitalizations and deaths):
| COVID Metrics | ||||
|---|---|---|---|---|
| Now | Week Ago | Goal | ||
| Percent fully Vaccinated | 65.9% | --- | ≥70.0%1 | |
| Fully Vaccinated (millions) | 218.9 | --- | ≥2321 | |
| New Cases per Day3🚩 | 35,212 | 29,246 | ≤5,0002 | |
| Hospitalized3 | 8,885 | 9,947 | ≤3,0002 | |
| Deaths per Day3 | 373 | 494 | ≤502 | |
| 1 Minimum to achieve "herd immunity" (estimated between 70% and 85%). 2my goals to stop daily posts, 37-day average for Cases, Currently Hospitalized, and Deaths 🚩 Increasing 7-day average week-over-week for Cases, Hospitalized, and Deaths ✅ Goal met. | ||||
 Click on graph for larger image.
This graph shows the daily (columns) and 7-day average (line) of deaths reported.
Average daily deaths are the lowest since early July 2021. Average daily deaths bottomed in July 2021 at 214 per day.
Lawler: Early Read on Existing Home Sales in March
by Calculated Risk on 4/18/2022 05:06:00 PM
From housing economist Tom Lawler:
Based on publicly-available local realtor/MLS reports released across the country through today, I project that existing home sales as estimated by the National Association of Realtors ran at a seasonally adjusted annual rate of 5.74 million in March, down 4.7% from February’s preliminary pace and down 5.0% from last March’s seasonally adjusted pace.
Local realtor reports, as well as reports from national inventory trackers, suggest that the YOY % decline in the inventory of existing homes for sale last month was significantly lower than that in February.
Finally, local realtor/MLS reports suggest the median existing single-family home sales price last month was up by about 16.3% from last March.
CR Note: The National Association of Realtors (NAR) is scheduled to release March existing home sales on Wednesday, April 20, 2022, at 10:00 AM ET. The consensus is for 5.80 million SAAR.
MBA Survey: "Share of Mortgage Loans in Forbearance Decreases to 1.05% in March"
by Calculated Risk on 4/18/2022 04:00:00 PM
Note: This is as of March 31st.
From the MBA: Share of Mortgage Loans in Forbearance Decreases to 1.05% in March
The Mortgage Bankers Association’s (MBA) monthly Loan Monitoring Survey revealed that the total number of loans now in forbearance decreased by 13 basis points from 1.18% of servicers’ portfolio volume in the prior month to 1.05% as of March 31, 2022. According to MBA’s estimate, 525,000 homeowners are in forbearance plans.
The share of Fannie Mae and Freddie Mac loans in forbearance decreased 7 basis points to 0.49%. Ginnie Mae loans in forbearance decreased 12 basis points to 1.38%, and the forbearance share for portfolio loans and private-label securities (PLS) declined 28 basis points to 2.44%.
“March was another month of lower forbearance rates, and a higher share of overall loans and forbearance-related workout loans that are current,” said Marina Walsh, CMB, MBA’s Vice President of Industry Analysis. “The share of loans in forbearance continues to dwindle and is just 5 basis points shy of hitting 1 percent - or 500,000 homeowners - after peaking at 4.3 million borrowers in June 2020. It has been a remarkable recovery for many homeowners in less than two years.”
emphasis added
 Click on graph for larger image.
This graph shows the percent of portfolio in forbearance by investor type over time.
The share of forbearance plans is decreasing, and, at the end of March, there were about 525,000 homeowners in forbearance plans.
Goldman Sachs "Will Higher Rates Put Out the Housing Fire?"
by Calculated Risk on 4/18/2022 11:06:00 AM
Today, in the Calculated Risk Real Estate Newsletter: Goldman Sachs "Will Higher Rates Put Out the Housing Fire?"
A brief excerpt:
Goldman Sachs economist Ronnie Walker put out a research note this morning titled: “Will Higher Rates Put Out the Housing Fire?"There is much more in the article. You can subscribe at Calculated Risk Real Estate Newsletter
Walker discusses the recent sharp increase in mortgage rates and writes:“Standard economic models suggest that an increase of that magnitude should weigh substantially on housing, the most interest rate-sensitive segment of the economy and the textbook channel of monetary policy transmission.”Last month, in Housing, the Fed, Interest Rates and Inflation, I noted that housing is a key transmission mechanism for Fed policy. However, Walker argues that“the extreme supply-demand imbalance in today’s housing market will likely dampen the hit to activity from higher rates”.This is critical, and if correct, may suggest the Fed will have to hike rates more than expected.
Along these lines, over the weekend, Nick Timiraos at the WSJ tweeted:High levels of all-cash sales and investor purchases may make housing markets more resilient to a big run-up in mortgage rates that is depriving shocked buyers of purchasing powerAnd I responded:The new conundrum: The Fed’s primary channel of policy transmission is housing. The more resilient housing is to rates, the more the Fed will have to hike to cool embedded inflation.Interesting times!
NAHB: Builder Confidence Decreased to 77 in April, "Housing Market at Inflection Point"
by Calculated Risk on 4/18/2022 10:06:00 AM
The National Association of Home Builders (NAHB) reported the housing market index (HMI) was at 77, down from 79 in March. Any number above 50 indicates that more builders view sales conditions as good than poor.
From the NAHB: Housing Market at Inflection Point as Builder Confidence Continues to Fall
Rapidly rising interest rates combined with ongoing home price increases and higher construction costs continue to take a toll on builder confidence and housing affordability.
Builder confidence in the market for newly built single-family homes moved two points lower to 77 in April, according to the National Association of Home Builders (NAHB)/Wells Fargo Housing Market Index (HMI) released today. This is the fourth straight month that builder sentiment has declined.
“Despite low existing inventory, builders report sales traffic and current sales conditions have declined to their lowest points since last summer as a sharp jump in mortgage rates and persistent supply chain disruptions continue to unsettle the housing market,” said NAHB Chairman Jerry Konter, a builder and developer from Savannah, Ga. “Policymakers must take proactive steps to fix supply chain issues that will reduce the cost of development, stem the rise in home prices and allow builders to increase production.”
“The housing market faces an inflection point as an unexpectedly quick rise in interest rates, rising home prices and escalating material costs have significantly decreased housing affordability conditions, particularly in the crucial entry-level market,” said NAHB Chief Economist Robert Dietz.
...
The HMI index gauging current sales conditions fell two points to 85 and the component charting traffic of prospective buyers posted a six-point decline to 60. The gauge measuring sales expectations in the next six months increased three points to 73 following a 10-point drop in March.
Looking at the three-month moving averages for regional HMI scores, the Northeast posted a one-point gain to 72 while the Midwest dropped three points to 69, the South fell two points to 82 and the West edged one-point lower to 89.
emphasis added
 Click on graph for larger image.
This graph shows the NAHB index since Jan 1985.
This was at the consensus forecast, and still a solid reading.
Four High Frequency Indicators for the Economy
by Calculated Risk on 4/18/2022 09:17:00 AM
These indicators are mostly for travel and entertainment. It is interesting to watch these sectors recover as the pandemic subsides. Note: Apple has discontinued "Apple mobility", and restaurant traffic is mostly back to normal.
The TSA is providing daily travel numbers.
This data is as of April 16th.
 Click on graph for larger image.
This data shows the 7-day average of daily total traveler throughput from the TSA since 2019 (Blue).
The red line is the percent of 2019 for the seven-day average.
The 7-day average is down 9.5% from the same day in 2019 (90.5% of 2019). (Red line)
Air travel has been moving sideways over the last month, off about 10% from 2019.
 This data shows domestic box office for each week and the median for the years 2016 through 2019 (dashed light blue).
 Black is 2020, Blue is 2021 and Red is 2022.
The data is from BoxOfficeMojo through April 14th.
Note that the data is usually noisy week-to-week and depends on when blockbusters are released.
Movie ticket sales were at $154 million last week, down about 15% from the median for the week.
Note that the data is usually noisy week-to-week and depends on when blockbusters are released.
Movie ticket sales were at $154 million last week, down about 15% from the median for the week.
 This graph shows the seasonal pattern for the hotel occupancy rate using the four-week average.
 The red line is for 2022, black is 2020, blue is the median, and dashed light blue is for 2021.
This data is through April 9th. The occupancy rate was down 4.7% compared to the same week in 2019.
The 4-week average of the occupancy rate is just above the median rate for the previous 20 years (Blue).
Notes: Y-axis doesn't start at zero to better show the seasonal change.
Notes: Y-axis doesn't start at zero to better show the seasonal change.
The 4-week average of the occupancy rate will now mostly move sideways seasonally until the summer.
Here is some interesting data on New York subway usage (HT BR).
 This graph is from Todd W Schneider.
 This graph shows how much MTA traffic has recovered in each borough (Graph starts at first week in January 2020 and 100 = 2019 average).
Manhattan is at about 39% of normal.
This data is through Friday, April 15th.
He notes: "Data updates weekly from the MTA’s public turnstile data, usually on Saturday mornings".
Housing Inventory April 18th Update: Inventory up 3.7% Week-over-week; Up 12.3% from Seasonal Bottom
by Calculated Risk on 4/18/2022 08:33:00 AM
Tracking existing home inventory is very important in 2022.
Inventory usually declines in the winter, and then increases in the spring. Inventory bottomed seasonally at the beginning of March 2022 and is now up 12.3% since then.
 Click on graph for larger image in graph gallery.
This inventory graph is courtesy of Altos Research.
As of April 15th, inventory was at 271 thousand (7-day average), compared to 261 thousand the prior week. Inventory was UP 3.7% from the previous week.
Last year inventory bottomed seasonally in April 2021 - very late in the year. This year, by this measure, inventory bottomed seasonally at the beginning of March.
Inventory is still very low. Compared to the same week in 2021, inventory is down 13.1% from 312 thousand, and compared to the same week in 2020, and inventory is down 63.9% from 749 thousand.
One of the keys will be to watch the year-over-year change each week to see if the declines are decreasing. Here is a table of the year-over-year change by week since the beginning of the year.
| Week Ending | YoY Change |
|---|---|
| 12/31/2021 | -30.0% |
| 1/7/2022 | -26.0% |
| 1/14/2022 | -28.6% |
| 1/21/2022 | -27.1% |
| 1/28/2022 | -25.9% |
| 2/4/2022 | -27.9% |
| 2/11/2022 | -27.5% |
| 2/18/2022 | -25.8% |
| 2/25/2022 | -24.9% |
| 3/4/2022 | -24.2% |
| 3/11/2022 | -21.7% |
| 3/18/2022 | -21.7% |
| 3/25/2022 | -19.0% |
| 4/1/2022 | -17.6% |
| 4/8/2022 | -14.8% |
| 4/15/2022 | -13.1% |

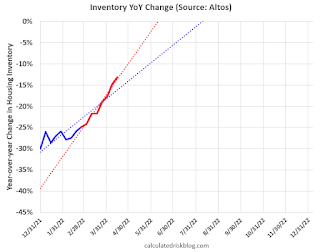
Here is a graph of the year-over-year change in the Altos data.
The blue trend line is from the beginning of the year, and the red trend line is over the last 8 weeks.
Currently it appears inventory will be up year-over-year sometime mid-year 2022.
Mike Simonsen discusses this data regularly on Youtube.
Sunday, April 17, 2022
Monday: Homebuilder Suvery
by Calculated Risk on 4/17/2022 07:06:00 PM
Weekend:
• Schedule for Week of April 17, 2022
Monday:
• At 10:00 AM ET, The April NAHB homebuilder survey. The consensus is for a reading of 77, down from 79. Any number above 50 indicates that more builders view sales conditions as good than poor.
From CNBC: Pre-Market Data and Bloomberg futures S&P 500 are down 15 and DOW futures are down 80 (fair value).
Oil prices were up over the last week with WTI futures at $106.95 per barrel and Brent at $111.70 per barrel. A year ago, WTI was at $63 and Brent was at $66 - so WTI oil prices are up 70% year-over-year.
Here is a graph from Gasbuddy.com for nationwide gasoline prices. Nationally prices are at $4.06 per gallon. A year ago prices were at $2.85 per gallon, so gasoline prices are up $1.21 per gallon year-over-year.
BLS: 12 States Set New Record Series Low Unemployment rates in March
by Calculated Risk on 4/17/2022 01:08:00 PM
On Friday, from the BLS: Regional and State Employment and Unemployment Summary
Unemployment rates were lower in March in 37 states and stable in 13 states and the District of Columbia, the U.S. Bureau of Labor Statistics reported today. All 50 states and the District had jobless rate decreases from a year earlier.
...
Nebraska and Utah had the lowest jobless rates in March, 2.0 percent each. The next lowest rates were in Indiana, 2.2 percent, and Montana, 2.3 percent. The rates in these four states set new series lows, as did the rates in the following eight states (all state series begin in 1976): Alaska (5.0 percent), Arizona (3.3 percent), Georgia (3.1 percent), Idaho (2.7 percent), Mississippi (4.2 percent), Tennessee (3.2 percent), West Virginia (3.7 percent), and Wisconsin (2.8 percent). The District of Columbia had the highest unemployment rate, 6.0 percent, followed by New Mexico, 5.3 percent.
emphasis added
 Click on graph for larger image.
This graph shows the number of states (and D.C.) with unemployment rates at or above certain levels since January 2006.
Twelve states set new series record low unemployment rates in March, and currently 17 states are at series record low unemployment rates.


