 RSS Feed
 by Calculated Risk on 4/21/2022 12:04:00 PM
Thursday, April 21, 2022
Final Look at Local Housing Markets in March and Housing Inventory Milestones to Watch
Today, in the Calculated Risk Real Estate Newsletter: Final Look at Local Housing Markets in March
A brief excerpt:
This final update for March adds Alabama, Columbus, Des Moines, Illinois, Indiana, Miami and New York.There is much more in the article.
...
Housing Inventory Milestones to Watch
1. The seasonal bottom.
2. Inventory up year-over-year (currently down 9.5% according to NAR)
3. Inventory up compared to two years ago (currently down 36%)
4. Inventory back to median for last decade (currently down 43%)
So far #1 has happened, and #2 will probably happen mid-year 2022. The following graph (using NAR inventory data) shows the above changes since January 2020. Even when inventory is up YoY (that will happen soon), we will still be a long way from normal levels of inventory.
I will discuss house prices vs. inventory next week after the Case-Shiller house price index is released.
...
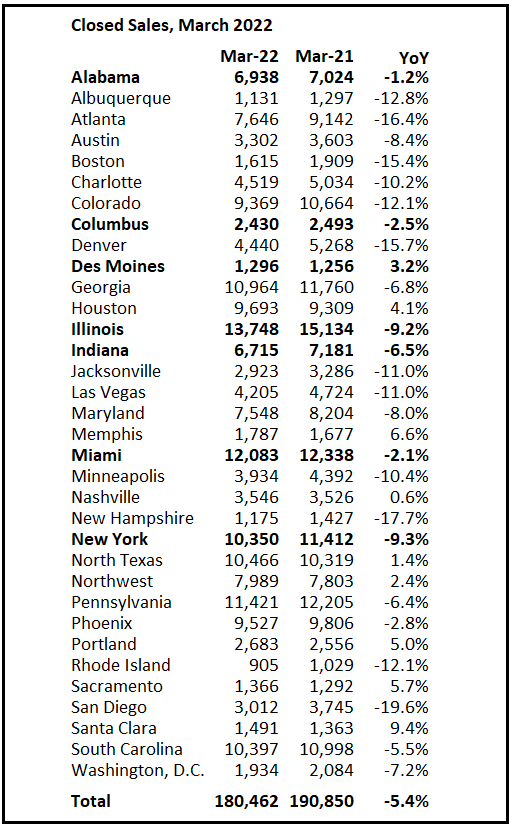
Closed Sales in March
And a table of March sales. Sales in these areas were down 5.4% YoY, Not Seasonally Adjusted (NSA). Sales were up YoY in about 30% of these markets. The NAR reported sales NSA in March (456,000) were 5.8% below sales in March 2021 (484,000). So, this sample of local markets is similar to the NAR report.
The table doesn’t include California where sales were down 4.4% year-over-year.
Notes for all tables:
1) New additions to table in BOLD.
2) Northwest (Seattle), North Texas (Dallas) and Santa Clara (San Jose), Jacksonville, Source: Northeast Florida Association of REALTORS®
3) Totals do not include Atlanta or Denver (included in state totals).

You can subscribe at Calculated Risk Real Estate Newsletter (most content is free without ads).
Hotels: Occupancy Rate Down 5.6% Compared to Same Week in 2019
by Calculated Risk on 4/21/2022 11:10:00 AM
From CoStar: STR: US Hotels See Easter Week Performance Drop
Aligned with historical patterns, U.S. hotel performance came in lower during the week of Easter, according to STR‘s latest data through April 16.The following graph shows the seasonal pattern for the hotel occupancy rate using the four-week average.
April 10-16, 2022 (percentage change from comparable week in 2019*):
• Occupancy: 62.0% (-5.6%)
• Average daily rate (ADR): US$147.25 (+14.4%)
• Revenue per available room (RevPAR): US$91.25 (+8.0%)
*Due to the pandemic impact, STR is measuring recovery against comparable time periods from 2019.
emphasis added
 Click on graph for larger image.
The red line is for 2022, black is 2020, blue is the median, and dashed light blue is for 2021.
The 4-week average of the occupancy rate is at the median rate for the previous 20 years (Blue).
Note: Y-axis doesn't start at zero to better show the seasonal change.
The 4-week average of the occupancy rate will now mostly move sideways seasonally until the summer.
Weekly Initial Unemployment Claims Decrease to 184,000
by Calculated Risk on 4/21/2022 08:34:00 AM
The DOL reported:
In the week ending April 16, the advance figure for seasonally adjusted initial claims was 184,000, a decrease of 2,000 from the previous week's revised level. The previous week's level was revised up by 1,000 from 185,000 to 186,000. The 4-week moving average was 177,250, an increase of 4,500 from the previous week's revised average. The previous week's average was revised up by 500 from 172,250 to 172,750.The following graph shows the 4-week moving average of weekly claims since 1971.
emphasis added
 Click on graph for larger image.
The dashed line on the graph is the current 4-week average. The four-week average of weekly unemployment claims increased to 177,250.
The previous week was revised up.
Weekly claims were close to the consensus forecast.
Wednesday, April 20, 2022
Thursday: Unemployment Claims, Philly Fed Mfg, Fed Chair Powell on Global Economy
by Calculated Risk on 4/20/2022 08:53:00 PM
Thursday:
• At 8:30 AM ET, The initial weekly unemployment claims report will be released. The consensus is for 185 thousand from 185 thousand last week.
• Also at 8:30 AM, the Philly Fed manufacturing survey for April. The consensus is for a reading of 20.0, down from 27.4.
• At 1:00 PM, Discussion, Fed Chair Pro Tempore Jerome Powell, The Global Economy, At the International Monetary Fund Debate on the Global Economy
On COVID (focus on hospitalizations and deaths):
| COVID Metrics | ||||
|---|---|---|---|---|
| Now | Week Ago | Goal | ||
| Percent fully Vaccinated | 66.0% | --- | ≥70.0%1 | |
| Fully Vaccinated (millions) | 219.0 | --- | ≥2321 | |
| New Cases per Day3🚩 | 40,985 | 30,926 | ≤5,0002 | |
| Hospitalized3 | 9,643 | 9,835 | ≤3,0002 | |
| Deaths per Day3 | 385 | 459 | ≤502 | |
| 1 Minimum to achieve "herd immunity" (estimated between 70% and 85%). 2my goals to stop daily posts, 37-day average for Cases, Currently Hospitalized, and Deaths 🚩 Increasing 7-day average week-over-week for Cases, Hospitalized, and Deaths ✅ Goal met. | ||||
 Click on graph for larger image.
This graph shows the daily (columns) and 7-day average (line) of deaths reported.
Average daily deaths bottomed in July 2021 at 214 per day.
AIA: "Pace of demand for design services rapidly accelerates" in March
by Calculated Risk on 4/20/2022 02:48:00 PM
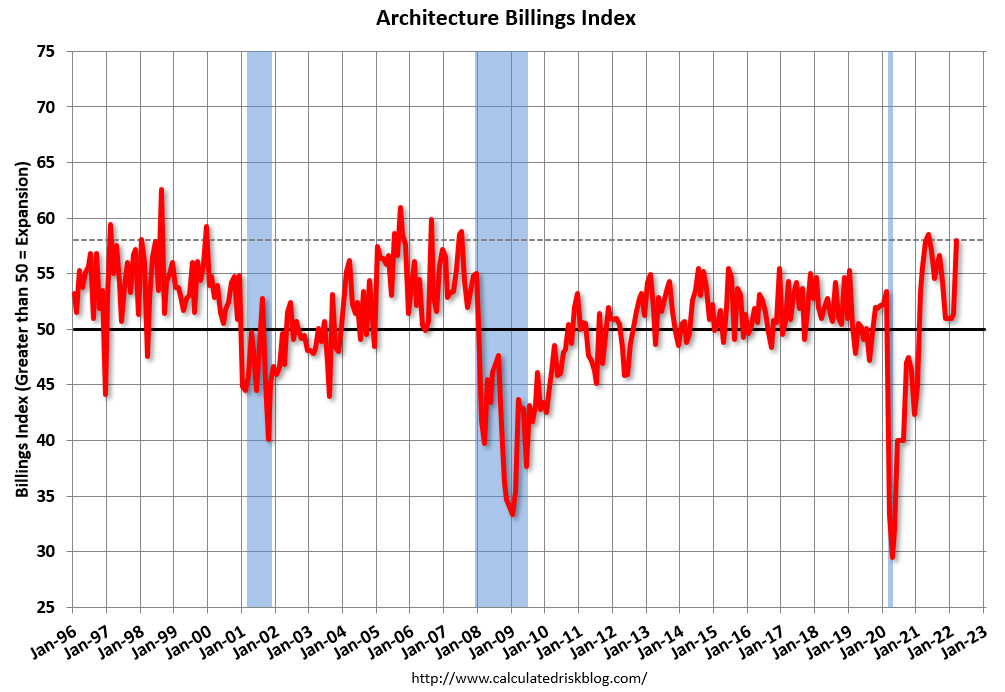
Note: This index is a leading indicator primarily for new Commercial Real Estate (CRE) investment.
From the AIA: Pace of demand for design services rapidly accelerates
Demand for design services in March expanded sharply from February according to a new report today from The American Institute of Architects (AIA).
AIA’s Architecture Billings Index (ABI) score for March was 58.0, up from a score of 51.3 in February. Any score above 50 indicates an increase in billings. During March, scoring for both new project inquiries and design contracts expanded, posting scores of 63.9 and 60.5, respectively.
“The spike in firm billings in March may reflect a desire to beat the continued interest rate hikes expected in the coming months,” said AIA Chief Economist, Kermit Baker, Hon. AIA, PhD. “However, since project backlogs at architecture firms have reached seven months, a new all-time high, it appears that firms are having a difficult time keeping up with this uptick in demand for design services.”
...
• Regional averages: South (57.2); Midwest (56.2); West (54.0); Northeast (46.3)
• Sector index breakdown: mixed practice (58.2); multi-family residential (57.2); commercial/industrial (55.3); institutional (50.5)
emphasis added
 Click on graph for larger image.
This graph shows the Architecture Billings Index since 1996. The index was at 58.0 in March, up from 51.3 in February. Anything above 50 indicates expansion in demand for architects' services.
Note: This includes commercial and industrial facilities like hotels and office buildings, multi-family residential, as well as schools, hospitals and other institutions.
This index has been positive for fourteen consecutive months. This index usually leads CRE investment by 9 to 12 months, so this index suggests a pickup in CRE investment in 2022.
Fed's Beige Book: "Strong demand for residential real estate but limited supply"
by Calculated Risk on 4/20/2022 02:13:00 PM
Fed's Beige Book "This report was prepared at the Federal Reserve Bank of Minneapolis based on information collected on or before April 11, 2022. "
Economic activity expanded at a moderate pace since mid-February. Several Districts reported moderate employment gains despite hiring and retention challenges in the labor market. Consumer spending accelerated among retail and non-financial service firms, as COVID-19 cases tapered across the country. Manufacturing activity was solid overall across most Districts, but supply chain backlogs, labor market tightness, and elevated input costs continued to pose challenges on firms' abilities to meet demand. Vehicle sales remained largely constrained by low inventories. Commercial real estate activity accelerated modestly as office occupancy and retail activity increased. Districts' contacts reported continued strong demand for residential real estate but limited supply. Agricultural conditions were mixed across regions. Farmers were supported by surging crop prices, but drought conditions were a challenge in some Districts and increasing input costs were squeezing producer margins across the nation. Outlooks for future growth were clouded by the uncertainty created by recent geopolitical developments and rising prices.On Residential Real Estate:
...
Employment increased at a moderate pace. Demand for workers continued to be strong across most Districts and industry sectors. But hiring was held back by the overall lack of available workers, though several Districts reported signs of modest improvement in worker availability. Many firms reported significant turnover as workers left for higher wages and more flexible job schedules. Persistent labor demand continued to fuel strong wage growth, particularly for footloose workers willing to change jobs. Firms reported that inflationary pressures were also contributing to higher wages, and that higher wages were doing little to alleviate widespread job vacancies. But some contacts reported early signs that the strong pace of wage growth had begun to slow.
emphasis added
• Boston: "Residential real estate sales slowed moderately in February, as the market was dogged by historically low inventories."
• Chicago: "Multifamily construction strengthened as demand remained robust. Residential real estate activity was little changed."
• St Louis: "The residential real estate market has remained strong since our previous report."
• Minneapolis: "Residential construction was flat and residential real estate slowed."
• San Francisco: "Residential real estate demand remained strong despite historically high prices and rising mortgage rates. Nonetheless, some contacts mentioned that they expect a slowdown in demand due to increasing mortgage rates. "
More Analysis on March Existing Home Sales
by Calculated Risk on 4/20/2022 10:44:00 AM
Today, in the CalculatedRisk Real Estate Newsletter: NAR: Existing-Home Sales Decreased to 5.77 million SAAR in February
Excerpt:
Sales in March (5.77 million SAAR) were down 2.7% from the previous month and were 4.5% below the March 2021 sales rate. Note: Sales for February 2022 were revised down from 6.02 million to 5.93 million.There is much more in the article. You can subscribe at https://calculatedrisk.substack.com/ (Most content is available for free, so please subscribe).
The second graph shows existing home sales by month for 2021 and 2022.
Sales declined 4.5% year-over-year compared to March 2021. This was the eighth consecutive month with sales down year-over-year.
...
A key milestone will be when inventory is up year-over-year (YoY). My current guess is inventory will be up YoY near mid-year. Inventory will still be historically very low.
Also note that 30-year mortgage rates averaged 4.2% in March according to Freddie Mac. Now rates are around 5.35%. Sometimes people rush to buy as rates rise - anticipating further rate increases. However, eventually, higher rates will suppress demand. It seems likely we will see further negative impact on sales from higher rates, and more inventory in the coming months.

NAR: Existing-Home Sales Decreased to 5.77 million SAAR in March
by Calculated Risk on 4/20/2022 10:12:00 AM
From the NAR: Existing-Home Sales Slip 2.7% in March
Existing-home sales decreased in March, marking two consecutive months of declines, according to the National Association of Realtors®. Month-over-month, sales in March waned in three of the four major U.S. regions while holding steady in the West. Sales were down across each region year-over-year.
Total existing-home sales, completed transactions that include single-family homes, townhomes, condominiums and co-ops, dipped 2.7% from February to a seasonally adjusted annual rate of 5.77 million in March. Year-over-year, sales fell 4.5% (6.04 million in March 2021).
...
Total housing inventory at the end of March totaled 950,000 units, up 11.8% from February and down 9.5% from one year ago (1.05 million). Unsold inventory sits at a 2.0-month supply at the present sales pace, up from 1.7 months in February and down from 2.1 months in March 2021.
emphasis added
 Click on graph for larger image.
This graph shows existing home sales, on a Seasonally Adjusted Annual Rate (SAAR) basis since 1993.
Sales in March (5.77 million SAAR) were down 2.7% from the previous month and were 4.5% below the March 2021 sales rate.
The second graph shows nationwide inventory for existing homes.
 According to the NAR, inventory increased to 0.95 million in March from 0.85 million in February.
Headline inventory is not seasonally adjusted, and inventory usually decreases to the seasonal lows in December and January, and peaks in mid-to-late summer.
The last graph shows the year-over-year (YoY) change in reported existing home inventory and months-of-supply. Since inventory is not seasonally adjusted, it really helps to look at the YoY change. Note: Months-of-supply is based on the seasonally adjusted sales and not seasonally adjusted inventory.
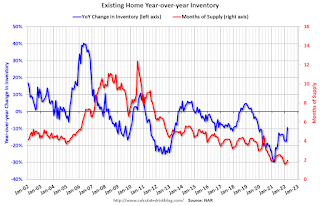 Inventory was down 9.5% year-over-year (blue) in March compared to March 2021.
Months of supply (red) increased to 2.0 months in March from 1.7 months in February.
This was slightly below the consensus forecast. I'll have more later.
The last graph shows the year-over-year (YoY) change in reported existing home inventory and months-of-supply. Since inventory is not seasonally adjusted, it really helps to look at the YoY change. Note: Months-of-supply is based on the seasonally adjusted sales and not seasonally adjusted inventory.
 Inventory was down 9.5% year-over-year (blue) in March compared to March 2021.
 Months of supply (red) increased to 2.0 months in March from 1.7 months in February.
This was slightly below the consensus forecast. I'll have more later.
MBA: Mortgage Applications Decrease in Latest Weekly Survey
by Calculated Risk on 4/20/2022 07:00:00 AM
From the MBA: Mortgage Applications Decrease in Latest MBA Weekly Survey
Mortgage applications decreased 5.0 percent from one week earlier, according to data from the Mortgage Bankers Association’s (MBA) Weekly Mortgage Applications Survey for the week ending April 15, 2022.
... The Refinance Index decreased 8 percent from the previous week and was 68 percent lower than the same week one year ago. The seasonally adjusted Purchase Index decreased 3 percent from one week earlier. The unadjusted Purchase Index decreased 2 percent compared with the previous week and was 14 percent lower than the same week one year ago.
“Ongoing concerns about rapid inflation and tighter US monetary policy continued to push Treasury yields higher, driving mortgage rates to their highest level in over a decade. Rates increased across the board for all loan types, with the 30-year fixed rate hitting 5.2%, the highest level since 2010,” said Joel Kan, MBA’s Associate Vice President of Economic and Industry Forecasting. “The 30-year rate has increased 70 basis points over the past month and is 2 full percentage points higher than a year ago. The recent surge in mortgage rates has shut most borrowers out of rate/term refinances, causing the refinance index to fall for the sixth consecutive week. In a housing market facing affordability challenges and low inventory, higher rates are causing a pullback or delay in home purchase demand as well. Home purchase activity has been volatile in recent weeks and has yet to see the typical pick up for this time of the year.”
Added Kan: “The ARM share of applications reached 8.5% last week, its highest level since 2019. As ARM loans typically have lower rates than fixed rate mortgages, and as this spread has widened, ARM loans have become more attractive to borrowers already facing home purchase loan amounts close to record highs.”
...
The average contract interest rate for 30-year fixed-rate mortgages with conforming loan balances ($647,200 or less) increased to 5.20 percent from 5.13 percent, with points increasing to 0.66 from 0.63 (including the origination fee) for 80 percent loan-to-value ratio (LTV) loans.
emphasis added
 Click on graph for larger image.
The first graph shows the refinance index since 1990.
With higher mortgage rates, the refinance index has declined sharply over the last several months.
The refinance index is at the lowest level since February 2019.
The second graph shows the MBA mortgage purchase index
 According to the MBA, purchase activity is down 14% year-over-year unadjusted.
Note: Red is a four-week average (blue is weekly).
Tuesday, April 19, 2022
Wednesday: Existing Home Sales, Beige Book
by Calculated Risk on 4/19/2022 09:10:00 PM
From Matthew Graham at Mortgage News Daily: Highest Mortgage Rates Since 2009
Today's dubious distinction is that we'd have to go back to 2009 before seeing rates that were meaningfully higher. [30 year fixed 5.35%]Wednesday:
emphasis added
• At 7:00 AM ET, The Mortgage Bankers Association (MBA) will release the results for the mortgage purchase applications index.
• At 10:00 AM, Existing Home Sales for March from the National Association of Realtors (NAR). The consensus is for 5.80 million SAAR, down from 6.02 million.
• During the day, The AIA's Architecture Billings Index for March (a leading indicator for commercial real estate).
• At 2:00 PM, the Federal Reserve Beige Book, an informal review by the Federal Reserve Banks of current economic conditions in their Districts.
On COVID (focus on hospitalizations and deaths):
| COVID Metrics | ||||
|---|---|---|---|---|
| Now | Week Ago | Goal | ||
| Percent fully Vaccinated | 66.0% | --- | ≥70.0%1 | |
| Fully Vaccinated (millions) | 219.0 | --- | ≥2321 | |
| New Cases per Day3🚩 | 37,132 | 30,293 | ≤5,0002 | |
| Hospitalized3 | 9,560 | 9,883 | ≤3,0002 | |
| Deaths per Day3 | 389 | 489 | ≤502 | |
| 1 Minimum to achieve "herd immunity" (estimated between 70% and 85%). 2my goals to stop daily posts, 37-day average for Cases, Currently Hospitalized, and Deaths 🚩 Increasing 7-day average week-over-week for Cases, Hospitalized, and Deaths ✅ Goal met. | ||||
 Click on graph for larger image.
This graph shows the daily (columns) and 7-day average (line) of deaths reported.
Average daily deaths bottomed in July 2021 at 214 per day.


