 RSS Feed
 by Calculated Risk on 4/23/2022 08:11:00 AM
Saturday, April 23, 2022
Schedule for Week of April 24, 2022
The key reports scheduled for this week are the advance estimate of Q1 GDP and March New Home sales.
Other key reports include February Case-Shiller house prices and Personal Income and Outlays for March.
For manufacturing, the April Dallas, Richmond and Kansas City manufacturing surveys will be released.
8:30 AM ET: Chicago Fed National Activity Index for March. This is a composite index of other data.
10:30 AM: Dallas Fed Survey of Manufacturing Activity for April.
8:30 AM: Durable Goods Orders for March from the Census Bureau. The consensus is for a 1.0% increase in durable goods orders.
 9:00 AM: S&P/Case-Shiller House Price Index for February.
This graph shows the nominal seasonally adjusted National Index, Composite 10 and Composite 20 indexes through the most recent report (the Composite 20 was started in January 2000).
The consensus is for a 18.4% year-over-year increase in the Comp 20 index for February.
9:00 AM: FHFA House Price Index for February. This was originally a GSE only repeat sales, however there is also an expanded index.
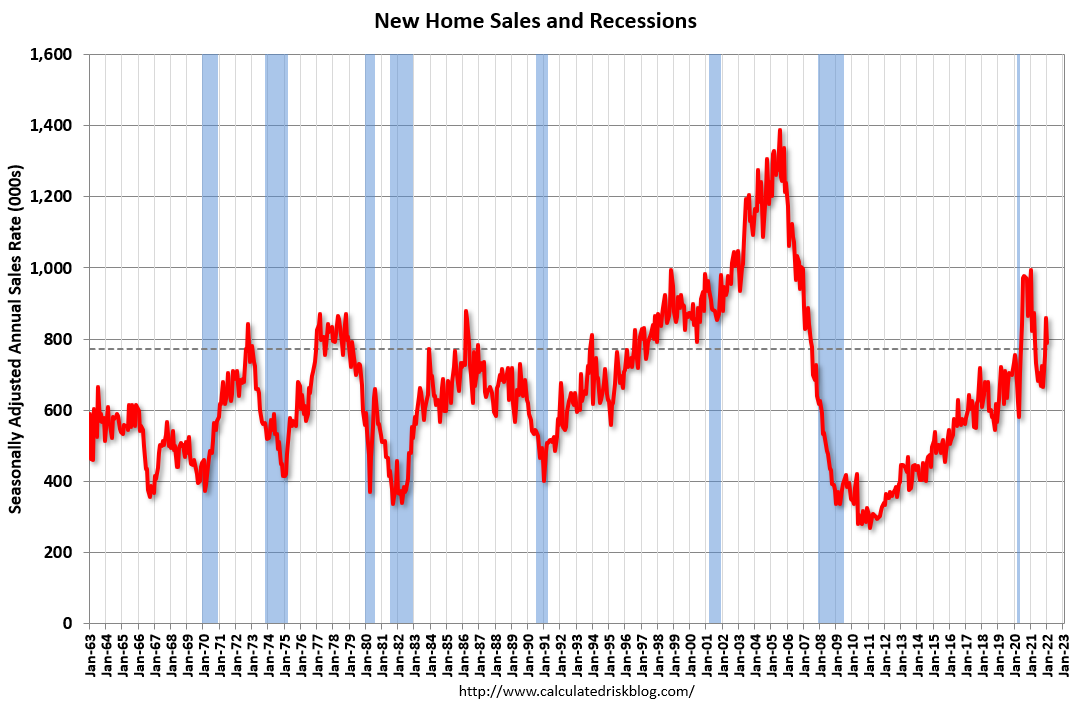 10:00 AM: New Home Sales for March from the Census Bureau.
 This graph shows New Home Sales since 1963. The dashed line is the sales rate for last month.
The consensus is for 762 thousand SAAR, down from 772 thousand in February.
10:00 AM: Richmond Fed Survey of Manufacturing Activity for April.
7:00 AM ET: The Mortgage Bankers Association (MBA) will release the results for the mortgage purchase applications index.
10:00 AM: Pending Home Sales Index for March. The consensus is for a 1.8% decrease in the index.
10:00 AM: the Q1 2022 Housing Vacancies and Homeownership from the Census Bureau.
8:30 AM: The initial weekly unemployment claims report will be released. The consensus is for 180 thousand down from 184 thousand last week.
8:30 AM: Gross Domestic Product, 1st quarter 2021 (Advance estimate). The consensus is that real GDP increased 1.0% annualized in Q1, down from 6.9% in Q4.
11:00 AM: the Kansas City Fed manufacturing survey for April. This is the last of regional manufacturing surveys for April.
8:30 AM ET: Personal Income and Outlays, March 2021. The consensus is for a 0.4% increase in personal income, and for a 0.6% increase in personal spending. And for the Core PCE price index to increase 0.3%. PCE prices are expected to be up 6.4% YoY, and core PCE prices up 5.3% YoY.
9:45 AM: Chicago Purchasing Managers Index for April. The consensus is for a reading of 62.0, down from 62.9 in March.
10:00 AM: University of Michigan's Consumer sentiment index (Final for April). The consensus is for a reading of 65.7.
Friday, April 22, 2022
COVID Update: Hospitalizations Starting to Increase
by Calculated Risk on 4/22/2022 09:21:00 PM
On COVID (focus on hospitalizations and deaths):
| COVID Metrics | ||||
|---|---|---|---|---|
| Now | Week Ago | Goal | ||
| Percent fully Vaccinated | 66.0% | --- | ≥70.0%1 | |
| Fully Vaccinated (millions) | 219.2 | --- | ≥2321 | |
| New Cases per Day3🚩 | 42,604 | 31,495 | ≤5,0002 | |
| Hospitalized3🚩 | 9,794 | 9,760 | ≤3,0002 | |
| Deaths per Day3 | 375 | 414 | ≤502 | |
| 1 Minimum to achieve "herd immunity" (estimated between 70% and 85%). 2my goals to stop daily posts, 37-day average for Cases, Currently Hospitalized, and Deaths 🚩 Increasing 7-day average week-over-week for Cases, Hospitalized, and Deaths ✅ Goal met. | ||||
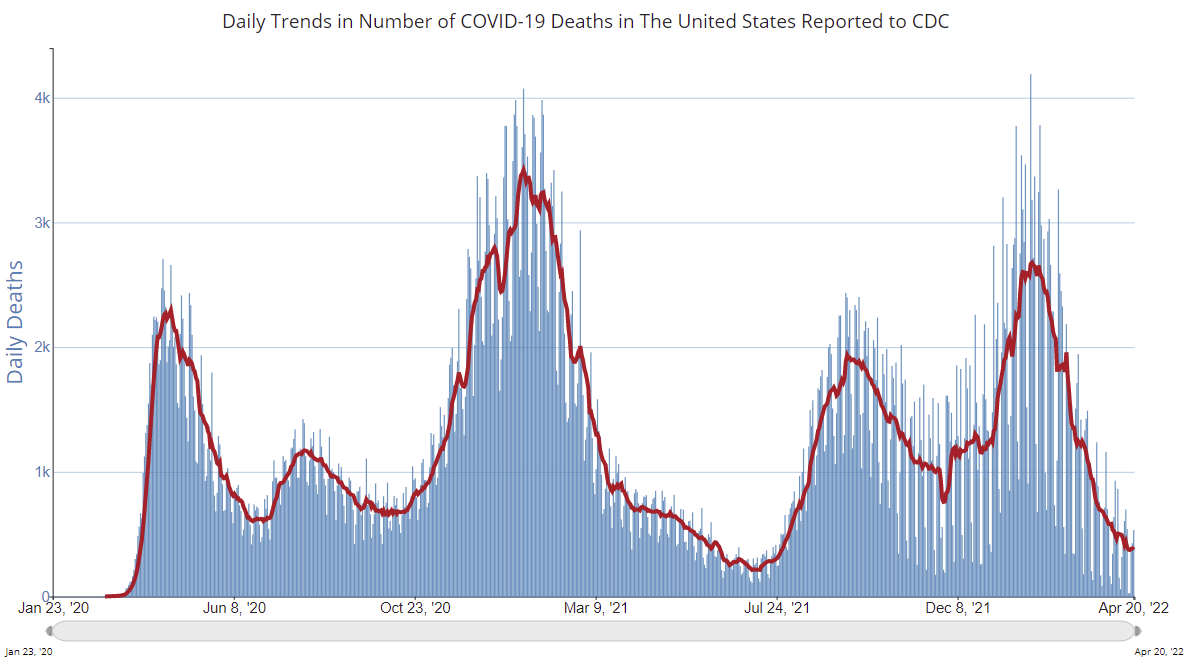 Click on graph for larger image.
This graph shows the daily (columns) and 7-day average (line) of deaths reported.
Average daily deaths bottomed in July 2021 at 214 per day.
April Vehicle Sales Forecast: Increase to 14.5 million SAAR
by Calculated Risk on 4/22/2022 07:46:00 PM
From WardsAuto: April, Second-Quarter U.S. Light-Vehicle Sales to Continue Sequential Growth (pay content). Brief excerpt:
"Bottom line is U.S. sales remain weak, and below potential, but are trending up from the depths they fell to in the second half of last year due to a dearth in supply. Although geopolitics, economic headwinds and ongoing supply-chain issues undeniably are creating huge risks to the outlook, sales still are expected to gradually rise through the end of the year."
 Click on graph for larger image.
This graph shows actual sales from the BEA (Blue), and Wards forecast for April (Red).
The Wards forecast of 14.5 million SAAR, would be up about 9% from last month, and down 21% from a year ago (sales were solid in April 2021, as sales recovered from the depths of the pandemic, and weren't yet impacted by supply chain issues).
Yellen: Inflation May have Peaked
by Calculated Risk on 4/22/2022 01:54:00 PM
According to Reuters, quoting Treasury Secretary Janet Yellen:
She said inflation may have peaked in the United States, but cautioned that prices may remain elevated "for a while longer."There are many drivers of inflation right now - supply chain issues, high energy and food prices, housing (Owners' Equivalent Rent will keep inflation high for some time) - to name a few. But it is possible, due to base effects, that inflation "may have peaked".
 Click on graph for larger image.
This graph shows the month-to-month increase in PCE and core PCE prices since January 2020.
Prices really picked up in March 2021, so when the PCE prices are released for March 2022 next week, the year-over-year change might be unchanged or even decrease as March 2021 is dropped from the calculation.
But, as Yellen notes, prices increase will likely remain elevated "for a while longer".
"Examining Resolution of Mortgage Forbearances and Delinquencies"
by Calculated Risk on 4/22/2022 10:45:00 AM
Here is a new report from the Philly Fed: Examining Resolution of Mortgage Forbearances and Delinquencies – April 2022
By our projections, 2.15 million mortgages are either in forbearance or past due; around 630,000 of those were still in forbearance as of April 7.And an excerpt from the report:
Forbearances and seriously delinquent loans continue to decline to prepandemic levels, attributable to the strong housing market and loss mitigation activities implemented by policymakers, investors, and mortgage servicers. Nonetheless, there are still pockets of borrowers who remain at high risk of losing their homes and require special attention. This report documents how these loss mitigation programs have performed to date and the remaining pockets of risk.
As shown in Table 1, as of April 7, we estimate that 629,714 mortgage loans remain in forbearance.In general, borrowers exiting forbearance have performed very well. The report shows that of 8.65 million forbearances, only 8% remain in active forbearance, and only 3% are delinquent, in-loss mitigation and not paying. Since the foreclosure moratoriums have ended, we've seen a pickup in foreclosures, but there will not be a huge wave of foreclosures.
These include mortgages from the Federal Housing Administration (FHA), Veterans Affairs (VA), and the two government-sponsored enterprises (GSEs) — Fannie Mae and Freddie Mac — comprising almost all of the federally insured mortgages, along with the major private-sector mortgages from private-label mortgage-backed securities (PLMBS) and portfolio loans.
Click on graph for larger image.
Figure 1 presents the projected forbearance expirations, assuming borrowers take the maximum forbearance allowed by various programs. Note that 39 percent of forbearances are FHA/VA mortgages. Unless mortgage servicers can successfully execute home-retention options in the coming months, many borrowers face the prospect of selling their homes or losing them to foreclosure.

Q1 GDP Forecasts: Around 1%
by Calculated Risk on 4/22/2022 08:15:00 AM
The BEA is scheduled to release the advance estimate of Q1 GDP this coming Thursday, April 28th. The consensus estimate is for a 1.0% increase in real GDP QoQ.
From BofA:
In the advance release of 1Q GDP, we expect growth slowed to a tepid 0.5% qoq saar clip from 6.9% qoq saar in 4Q 2021. Don’t be head-faked by the headline, however, as underlying demand remained robust. Indeed, we expect a slowing in inventory growth and a widening in the trade deficit to slice 3.5-4pp off real GDP growth this quarter, which means domestic final sales of 4-4.5%. [April 22 estimate]From Goldman:
emphasis added
We left our Q1 GDP tracking estimate unchanged at +1.5% (qoq ar). [April 20 estimate]And from the Altanta Fed: GDPNow
The GDPNow model estimate for real GDP growth (seasonally adjusted annual rate) in the first quarter of 2022 is 1.3 percent on April 19, up from 1.1 percent on April 14. After recent releases from the Federal Reserve Board of Governors and the US Census Bureau, the nowcast of first-quarter real gross private domestic investment growth increased from -0.8 percent to 0.1 percent. [April 19 estimate]
Thursday, April 21, 2022
Fed's Powell: "50 basis points will be on the table for the May meeting"
by Calculated Risk on 4/21/2022 04:04:00 PM
Fed Chair Powell delivered prepared remarks on The Global Economy At the International Monetary Fund Debate on the Global Economy today.
Nick Timarios at the WSJ as some details: Fed’s Jerome Powell Seals Expectations of Half-Point Rate Rise in May
“It is appropriate in my view to be moving a little more quickly” to raise interest rates than the Fed has in the recent past, Mr. Powell said Thursday. “I also think there’s something in the idea of front-end-loading” the removal of stimulus, he said.And from Jeff Cox at CNBC: Powell says taming inflation ‘absolutely essential,’ and a 50 basis point hike possible for May
...
"It's too hot. It's unsustainably hot. It's our job to get it to a better place where supply and demand are closer together."
"I would say 50 basis points will be on the table for the May meeting.”
...
“Our goal is to use our tools to get demand and supply back in synch, so that inflation moves down and does so without a slowdown that amounts to a recession,” Powell said. “I don’t think you’ll hear anyone at the Fed say that that’s going to be straightforward or easy. It’s going to be very challenging. We’re going to do our best to accomplish that.”
“It’s absolutely essential to restore price stability,” he added. “Economies don’t work without price stability.”
Final Look at Local Housing Markets in March and Housing Inventory Milestones to Watch
by Calculated Risk on 4/21/2022 12:04:00 PM
Today, in the Calculated Risk Real Estate Newsletter: Final Look at Local Housing Markets in March
A brief excerpt:
This final update for March adds Alabama, Columbus, Des Moines, Illinois, Indiana, Miami and New York.There is much more in the article.
...
Housing Inventory Milestones to Watch
1. The seasonal bottom.
2. Inventory up year-over-year (currently down 9.5% according to NAR)
3. Inventory up compared to two years ago (currently down 36%)
4. Inventory back to median for last decade (currently down 43%)
So far #1 has happened, and #2 will probably happen mid-year 2022. The following graph (using NAR inventory data) shows the above changes since January 2020. Even when inventory is up YoY (that will happen soon), we will still be a long way from normal levels of inventory.
I will discuss house prices vs. inventory next week after the Case-Shiller house price index is released.
...
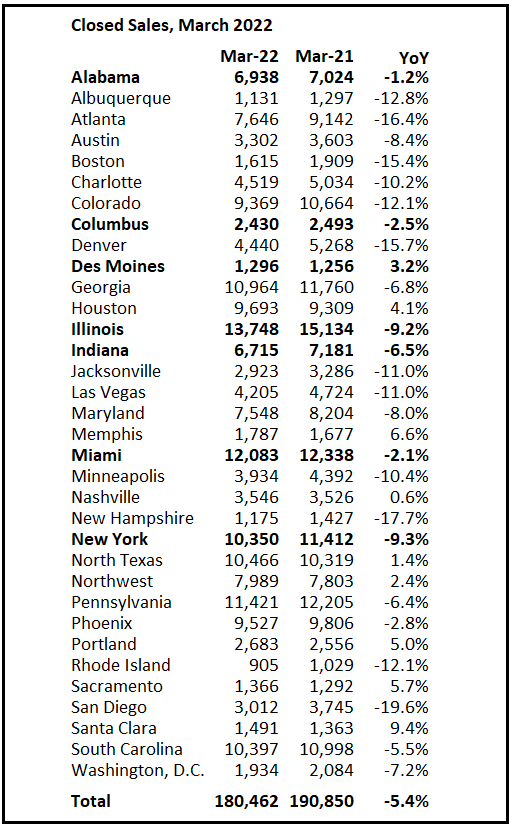
Closed Sales in March
And a table of March sales. Sales in these areas were down 5.4% YoY, Not Seasonally Adjusted (NSA). Sales were up YoY in about 30% of these markets. The NAR reported sales NSA in March (456,000) were 5.8% below sales in March 2021 (484,000). So, this sample of local markets is similar to the NAR report.
The table doesn’t include California where sales were down 4.4% year-over-year.
Notes for all tables:
1) New additions to table in BOLD.
2) Northwest (Seattle), North Texas (Dallas) and Santa Clara (San Jose), Jacksonville, Source: Northeast Florida Association of REALTORS®
3) Totals do not include Atlanta or Denver (included in state totals).

You can subscribe at Calculated Risk Real Estate Newsletter (most content is free without ads).
Hotels: Occupancy Rate Down 5.6% Compared to Same Week in 2019
by Calculated Risk on 4/21/2022 11:10:00 AM
From CoStar: STR: US Hotels See Easter Week Performance Drop
Aligned with historical patterns, U.S. hotel performance came in lower during the week of Easter, according to STR‘s latest data through April 16.The following graph shows the seasonal pattern for the hotel occupancy rate using the four-week average.
April 10-16, 2022 (percentage change from comparable week in 2019*):
• Occupancy: 62.0% (-5.6%)
• Average daily rate (ADR): US$147.25 (+14.4%)
• Revenue per available room (RevPAR): US$91.25 (+8.0%)
*Due to the pandemic impact, STR is measuring recovery against comparable time periods from 2019.
emphasis added
 Click on graph for larger image.
The red line is for 2022, black is 2020, blue is the median, and dashed light blue is for 2021.
The 4-week average of the occupancy rate is at the median rate for the previous 20 years (Blue).
Note: Y-axis doesn't start at zero to better show the seasonal change.
The 4-week average of the occupancy rate will now mostly move sideways seasonally until the summer.
Weekly Initial Unemployment Claims Decrease to 184,000
by Calculated Risk on 4/21/2022 08:34:00 AM
The DOL reported:
In the week ending April 16, the advance figure for seasonally adjusted initial claims was 184,000, a decrease of 2,000 from the previous week's revised level. The previous week's level was revised up by 1,000 from 185,000 to 186,000. The 4-week moving average was 177,250, an increase of 4,500 from the previous week's revised average. The previous week's average was revised up by 500 from 172,250 to 172,750.The following graph shows the 4-week moving average of weekly claims since 1971.
emphasis added
 Click on graph for larger image.
The dashed line on the graph is the current 4-week average. The four-week average of weekly unemployment claims increased to 177,250.
The previous week was revised up.
Weekly claims were close to the consensus forecast.


