 RSS Feed
 by Calculated Risk on 4/29/2022 11:46:00 AM
Friday, April 29, 2022
Realtor.com Reports Weekly Inventory down only 6% Year-over-year
Today, in the Calculated Risk Real Estate Newsletter: Realtor.com Reports Weekly Inventory down only 6% Year-over-year
Excerpt:
Realtor.com has monthly and weekly data on the existing homes. Here is their most recent weekly report released yesterday: Weekly Housing Trends View — Data Week Ending April 23, 2022. They have data on list prices, new listing and more, but this focus is on inventory.• Active inventory is down just 6 percent from a year ago.
The number of homes for sale is past this year’s seasonal low, which was also a record low, which means the number of homes for sale is climbing week to week and month to month as it typically does in spring. While the market has not yet caught up to last year’s level, this week marked a big jump forward. The gap between this year’s homes for sale and last year’s is one-fifth the size that it was at the beginning of the year. The catch up is likely to continue, as we noted last week, as new listings grow and home sales slow, and we expect active inventory to surpass year ago levels in the next few months. This growth will mean more options for shoppers than they’ve had in a while, even though inventory continues to lag pre-pandemic normal.Here is a graph of the year-over-year change in inventory according to realtor.com. Note: I corrected a sign error in the data for Feb 26, 2022.
The previous week, inventory was down 12.6% YoY according to Realtor.com. That is close to the 11.2% that Altos reported. I expect Altos to report a single digit year-over-year decline in inventory on Monday.

There is much more in the article. You can subscribe at https://calculatedrisk.substack.com/
Personal Income increased 0.5% in March; Spending increased 1.1%
by Calculated Risk on 4/29/2022 08:38:00 AM
The BEA released the Personal Income and Outlays report for March:
Personal income increased $107.2 billion (0.5 percent) in March, according to estimates released today by the Bureau of Economic Analysis. Disposable personal income (DPI) increased $89.7 billion (0.5 percent) and personal consumption expenditures (PCE) increased $185.0 billion (1.1 percent).The March PCE price index increased 6.6 percent year-over-year and the PCE price index, excluding food and energy, increased 5.2 percent year-over-year.
Real DPI decreased 0.4 percent in March and Real PCE increased 0.2 percent; goods decreased 0.5 percent and services increased 0.6 percent. The PCE price index increased 0.9 percent. Excluding food and energy, the PCE price index increased 0.3 percent
emphasis added
The following graph shows real Personal Consumption Expenditures (PCE) through March 2022 (2012 dollars). Note that the y-axis doesn't start at zero to better show the change.
 Click on graph for larger image.
The dashed red lines are the quarterly levels for real PCE.
Personal income was slightly above expectations, and the increase in PCE was above expectations.
Thursday, April 28, 2022
Friday: Personal Income and Outlays, Chicago PMI
by Calculated Risk on 4/28/2022 09:15:00 PM
Friday:
• At 8:30 AM ET: Personal Income and Outlays, March 2021. The consensus is for a 0.4% increase in personal income, and for a 0.6% increase in personal spending. And for the Core PCE price index to increase 0.3%. PCE prices are expected to be up 6.4% YoY, and core PCE prices up 5.3% YoY.
• At 9:45 AM, Chicago Purchasing Managers Index for April. The consensus is for a reading of 62.0, down from 62.9 in March.
• At 10:00 AM, University of Michigan's Consumer sentiment index (Final for April). The consensus is for a reading of 65.7.
On COVID (focus on hospitalizations and deaths):
| COVID Metrics | ||||
|---|---|---|---|---|
| Now | Week Ago | Goal | ||
| Percent fully Vaccinated | 66.1% | --- | ≥70.0%1 | |
| Fully Vaccinated (millions) | 219.6 | --- | ≥2321 | |
| New Cases per Day3🚩 | 53,133 | 42,426 | ≤5,0002 | |
| Hospitalized3🚩 | 10,803 | 9,909 | ≤3,0002 | |
| Deaths per Day3 | 334 | 352 | ≤502 | |
| 1 Minimum to achieve "herd immunity" (estimated between 70% and 85%). 2my goals to stop daily posts, 37-day average for Cases, Currently Hospitalized, and Deaths 🚩 Increasing 7-day average week-over-week for Cases, Hospitalized, and Deaths ✅ Goal met. | ||||
 Click on graph for larger image.
This graph shows the daily (columns) and 7-day average (line) of deaths reported.
Average daily deaths bottomed in July 2021 at 214 per day.
NMHC: April Apartment Market Survey shows Tighter Conditions
by Calculated Risk on 4/28/2022 03:05:00 PM
From the National Multifamily Housing Council (NMHC): Apartment Demand Continues to Grow, but Investors Face Tougher Financing Conditions
Apartment markets tightened further according to the National Multifamily Housing Council’s Quarterly Survey of Apartment Market Conditions for April 2022, while financing became more costly. The Market Tightness (60) index was the only index to come in above the breakeven level (50) this quarter; the Sales Volume (50) index came in at exactly 50, with much disagreement among respondents; while both the Equity Financing (35) and Debt Financing (9) indexes indicated weaker conditions compared to three months prior.
“Demand for apartments continues to exceed supply, resulting in the fifth straight quarter of tightening markets,” noted NMHC’s Chief Economist, Mark Obrinsky. “Yet, even as rent growth and occupancy remain elevated, developers are struggling to build more housing due to the increasing cost of materials, a lack of available labor, continued obstructionism from NIMBYs, and, because of rising interest rates, an increasing cost of capital.”
...
The Market Tightness Index came in at 60 this quarter – above the breakeven level of 50 – indicating that market conditions have become tighter. While less than one-third (30 percent) of respondents reported markets to be tighter than three months ago, an even smaller share (10 percent) thought that markets have become looser. A majority of respondents (59 percent), meanwhile, thought that apartment market conditions were unchanged from last quarter.

Click on graph for larger image.
This graph shows the quarterly Apartment Tightness Index. Any reading above 50 indicates tighter conditions from the previous quarter.
Even though the index declined in April, this indicates market conditions tightened further in April for the fifth consecutive quarter, after being especially weak during the early months of the pandemic.
Las Vegas March 2022: Visitor Traffic Down 10% Compared to 2019
by Calculated Risk on 4/28/2022 02:38:00 PM
From the Las Vegas Visitor Authority: March 2022 Las Vegas Visitor Statistics
The positive visitation trajectory continued in March as Las Vegas hosted more than 3.3M visitors, nearly 50% ahead of last March and roughly 10% shy of March 2019.
With meetings returning across the destination along with tradeshows such as ASD Las Vegas, Nat'l Automobile Dealers Assn, Bar & Restaurant Expo, and Int'l Pizza Expo, the convention segment saw continued improvement, reaching an est. 495k attendees for the month, roughly 90% of pre‐COVID levels of Mar 2019. Overall hotel occupancy reached 80.6%, up approx. 25 pts YoY and down only 10.9 pts vs. March 2019. Weekend occupancy exceeded 92% (up 14.4 pts YoY and down 5.0 pts vs. March 2019) and Midweek occupancy reached 76.6% (up 28.8 pts YoY and down 12.3 pts vs. March 2019).
ADR exceeded $163, well ahead of last March (+63.0%) and March 2019 (+21.8%) while RevPAR reached $131.49 for the month, dramatically ahead of March 2021 (+136.7%) and 7.3% over March 2019 levels
 Click on graph for larger image.
 The first graph shows visitor traffic for 2019 (dark blue), 2020 (light blue), 2021 (yellow) and 2022 (red)
Visitor traffic was down 9.8% compared to the same month in 2019.
Visitor traffic was up 50% compared to last March.
The second graph shows convention traffic.
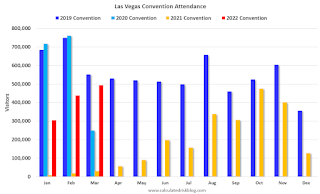
Convention traffic was down 10.5% compared to March 2019.The second graph shows convention traffic.

Note: There was almost no convention traffic from April 2020 through May 2021.
A Few Comments on Q1 GDP and Investment
by Calculated Risk on 4/28/2022 12:22:00 PM
Earlier from the BEA: Gross Domestic Product, Fourth Quarter and Year 2021 (Advance Estimate)
Real gross domestic product (GDP) decreased at an annual rate of 1.4 percent in the first quarter of 2022, according to the "advance" estimate released by the Bureau of Economic Analysis. In the fourth quarter, real GDP increased 6.9 percent....The advance Q1 GDP report, at -1.4% annualized, was below expectations, primarily due to a negative impact from trade and a decrease in inventories.
The decrease in real GDP reflected decreases in private inventory investment, exports, federal government spending, and state and local government spending, while imports, which are a subtraction in the calculation of GDP, increased. Personal consumption expenditures (PCE), nonresidential fixed investment, and residential fixed investment increased.
emphasis added
Personal consumption expenditures (PCE) increased at a 2.7% annualized rate in Q1.
The graph below shows the contribution to GDP from residential investment, equipment and software, and nonresidential structures (3 quarter trailing average). This is important to follow because residential investment tends to lead the economy, equipment and software is generally coincident, and nonresidential structure investment trails the economy.
In the graph, red is residential, green is equipment and software, and blue is investment in non-residential structures. So, the usual pattern - both into and out of recessions is - red, green, blue.
Of course - with the sudden economic stop due to COVID-19 - the usual pattern didn't apply.
The dashed gray line is the contribution from the change in private inventories.
 Click on graph for larger image.
Residential investment (RI) increased at a 2.1% annual rate in Q1. Equipment investment increased at a 15.3% annual rate, and investment in non-residential structures increased at a 9.2% annual rate.
The contribution to Q1 GDP from investment in private inventories was -0.84 percentage points.
On a 3-quarter trailing average basis, RI (red) is unchanged, equipment (green) is up, and nonresidential structures (blue) is still down.
On a 3-quarter trailing average basis, RI (red) is unchanged, equipment (green) is up, and nonresidential structures (blue) is still down.
I'll post more on the components of non-residential investment once the supplemental data is released.
 The second graph shows residential investment as a percent of GDP.
Residential Investment as a percent of GDP increased in Q1.
I'll break down Residential Investment into components after the GDP details are released.
Note: Residential investment (RI) includes new single-family structures, multifamily structures, home improvement, broker's commissions, and a few minor categories.
 The third graph shows non-residential investment in
structures, equipment and "intellectual property products".
The third graph shows non-residential investment in
structures, equipment and "intellectual property products".
Investment in non-residential structures increased in Q1 as a percent GDP.
Weekly Initial Unemployment Claims Decrease to 180,000
by Calculated Risk on 4/28/2022 08:41:00 AM
The DOL reported:
In the week ending April 23, the advance figure for seasonally adjusted initial claims was 180,000, a decrease of 5,000 from the previous week's revised level. The previous week's level was revised up by 1,000 from 184,000 to 185,000. The 4-week moving average was 179,750, an increase of 2,250 from the previous week's revised average. The previous week's average was revised up by 250 from 177,250 to 177,500.The following graph shows the 4-week moving average of weekly claims since 1971.
emphasis added
 Click on graph for larger image.
The dashed line on the graph is the current 4-week average. The four-week average of weekly unemployment claims increased to 179,750.
The previous week was revised up.
Weekly claims were close to the consensus forecast.
BEA: Real GDP decreased at 1.4% Annualized Rate in Q1
by Calculated Risk on 4/28/2022 08:35:00 AM
From the BEA: Gross Domestic Product, First Quarter 2022 (Advance Estimate)
Real gross domestic product (GDP) decreased at an annual rate of 1.4 percent in the first quarter of 2022, according to the "advance" estimate released by the Bureau of Economic Analysis. In the fourth quarter, real GDP increased 6.9 percent....PCE increased at a 2.7% rate, and residential investment increased at a 2.1% rate. Change in private inventories and trade were a huge drag in Q1. The advance Q1 GDP report, with 1.4% annualized decline, was below expectations.
The decrease in real GDP reflected decreases in private inventory investment, exports, federal government spending, and state and local government spending, while imports, which are a subtraction in the calculation of GDP, increased. Personal consumption expenditures (PCE), nonresidential fixed investment, and residential fixed investment increased.
emphasis added
I'll have more later ...
MBA: Median Mortgage Application Payment Up 5.0% in March compared to February
by Calculated Risk on 4/28/2022 07:00:00 AM
This is a new monthly affordability index from the Mortgage Bankers Association (MBA).
From the MBA: Mortgage Application Payments Jumped 5 Percent to $1,736 in March
Homebuyer affordability declined in March, with the national median payment applied for by applicants rising 5.0 percent to $1,736 from $1,653 in February. This is according to the Mortgage Bankers Association's (MBA) new Purchase Applications Payment Index (PAPI), which measures how new monthly mortgage payments vary across time – relative to income – using data from MBA’s Weekly Applications Survey (WAS).This will increase further in April with the further increase in mortgage rates.
“The start of the spring homebuying season is off to a mixed start. The healthy labor market and robust wage gains fueled demand throughout the country in March, but rapid home-price growth and the 42- basis-point surge in mortgage rates last month slowed purchase application activity. A typical borrower’s principal and interest payment was $387 more than in March 2021,” said Edward Seiler, MBA's Associate Vice President, Housing Economics, and Executive Director, Research Institute for Housing America. “Swift price-appreciation, sky-high inflation, low inventory, and mortgage rates now two percentage points higher than last year are all headwinds for the housing market in the coming months – especially for first-time buyers.”
...
An increase in MBA’s PAPI – indicative of declining borrower affordability conditions – means that the mortgage payment to income ratio (PIR) is higher due to increasing application loan amounts, rising mortgage rates, or a decrease in earnings. A decrease in the PAPI – indicative of improving borrower affordability conditions – occurs when loan application amounts decrease, mortgage rates decrease, or earnings increase.
Click on graph for larger image.
The national PAPI (Figure 1) increased 5.0 percent to 150.9 in March from 143.7 in February, meaning payments on new mortgages take up a larger share of a typical person’s income. Compared to March 2021 (122.9), the index jumped 22.8 percent. For borrowers applying for lower-payment mortgages (the 25th percentile), the national mortgage payment increased 3.2 percent to $1,129 from $1,094 in February
emphasis added

Wednesday, April 27, 2022
Thursday: GDP, Unemployment Claims
by Calculated Risk on 4/27/2022 09:23:00 PM
Thursday:
• At 8:30 AM ET, The initial weekly unemployment claims report will be released. The consensus is for 180 thousand down from 184 thousand last week.
• Also at 8:30 AM, Gross Domestic Product, 1st quarter 2021 (Advance estimate). The consensus is that real GDP increased 1.0% annualized in Q1, down from 6.9% in Q4.
• At 11:00 AM, the Kansas City Fed manufacturing survey for April. This is the last of regional manufacturing surveys for April.
On COVID (focus on hospitalizations and deaths):
| COVID Metrics | ||||
|---|---|---|---|---|
| Now | Week Ago | Goal | ||
| Percent fully Vaccinated | 66.1% | --- | ≥70.0%1 | |
| Fully Vaccinated (millions) | 219.4 | --- | ≥2321 | |
| New Cases per Day3🚩 | 48,692 | 40,812 | ≤5,0002 | |
| Hospitalized3🚩 | 10,606 | 9,833 | ≤3,0002 | |
| Deaths per Day3 | 299 | 360 | ≤502 | |
| 1 Minimum to achieve "herd immunity" (estimated between 70% and 85%). 2my goals to stop daily posts, 37-day average for Cases, Currently Hospitalized, and Deaths 🚩 Increasing 7-day average week-over-week for Cases, Hospitalized, and Deaths ✅ Goal met. | ||||
 Click on graph for larger image.
This graph shows the daily (columns) and 7-day average (line) of deaths reported.
Average daily deaths bottomed in July 2021 at 214 per day.


