 RSS Feed
 by Calculated Risk on 5/03/2022 09:33:00 PM
Tuesday, May 03, 2022
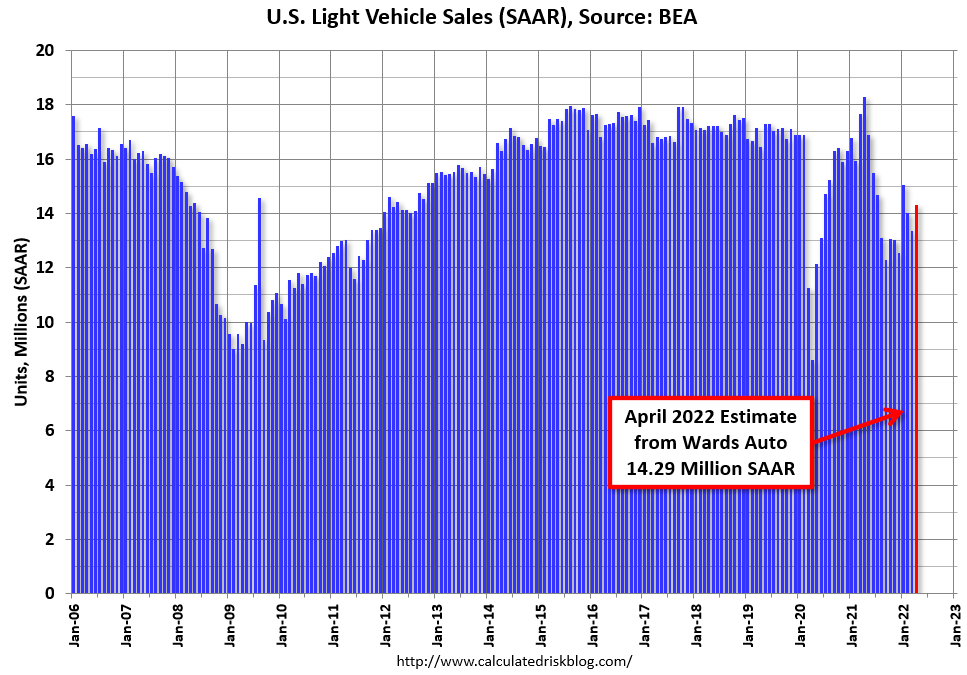
April Vehicles Sales increased to 14.29 million SAAR
Wards Auto released their estimate of light vehicle sales for April. Wards Auto estimates sales of 14.29 million SAAR in April 2022 (Seasonally Adjusted Annual Rate), up 6.9% from the March sales rate, and down 21.9% from April 2021.
 Click on graph for larger image.
This graph shows light vehicle sales since 2006 from the BEA (blue) and Wards Auto's estimate for April (red).
The impact of COVID-19 was significant, and April 2020 was the worst month. After April 2020, sales increased, and were close to sales in 2019 (the year before the pandemic).
However, sales decreased late last year due to supply issues. It appears the "supply chain bottom" was in September 2021, and sales in April were above the consensus forecast of 13.8 million SAAR.
Sales are still weak but picking up.
Fannie REO inventory increased in Q1 year-over-year; Expected to increase further in 2022
by Calculated Risk on 5/03/2022 03:23:00 PM
Fannie reported results for Q1 2022. Here is some information on single-family Real Estate Owned (REOs).
Here is a note on the pandemic impact on foreclosures, from Fannie:
"In response to the pandemic and with instruction from FHFA, we prohibited our servicers from completing foreclosures on our single-family loans through July 31, 2021, except in the case of vacant or abandoned properties. In addition, our servicers were required to comply with a Consumer Financial Protection Bureau (the “CFPB”) rule that prohibited certain new single-family foreclosures on mortgage loans secured by the borrower’s principal residence until after December 31, 2021. As a result, our foreclosure volumes were slightly higher in the first quarter of 2022 compared with the first quarter of 2021. We expect foreclosure volumes to gradually increase throughout 2022.
In April 2022, FHFA announced a suspension of foreclosure activities for up to 60 days for borrowers who apply for assistance under Treasury’s Homeowner Assistance Fund." emphasis added
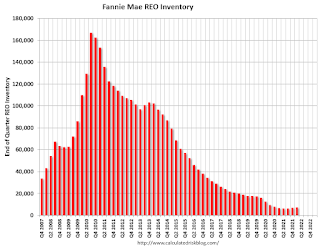
Fannie Mae reported the number of REO increased to 7,430 at the end of Q1 2022 compared to 6,918 at the end of Q1 2021.
For Fannie, this is down 96% from the 166,787 peak number of REOs in Q3 2010.
 Click on graph for larger image.
Here is a graph of Fannie Real Estate Owned (REO).
REO inventory increased in Q1 2022, and inventory is up 7% year-over-year.
This is well below a normal level of REOs for Fannie, and REO levels will increase in 2022 now that the moratorium is over, but there will not be a huge wave of foreclosures.
Rent Increases Up Sharply Year-over-year, Pace may be slowing
by Calculated Risk on 5/03/2022 12:45:00 PM
Today, in the Calculated Risk Real Estate Newsletter: Rent Increases Up Sharply Year-over-year, Pace may be slowing
A brief excerpt:
Here is a graph of the year-over-year (YoY) change for these measures since January 2015. All of these measures are through March 2022 (Apartment List through April 2022).There is much more in the article. You can subscribe at https://calculatedrisk.substack.com/
Note that new lease measures (Zillow, Apartment List) dipped early in the pandemic, whereas the BLS measures were steady. Then new leases took off, and the BLS measures are picking up.
...
The Zillow measure is up 16.8% YoY in February, down from 17.2% YoY in February. And the ApartmentList measure is up 16.4% as of April, down from 17.2% in March. Both the Zillow measure (a repeat rent index), and ApartmentList are showing a sharp increase in rents.
Clearly rents are still increasing, and we should expect this to continue to spill over into measures of inflation in 2022. The Owners’ Equivalent Rent (OER) was up 4.5% YoY in March, from 4.3% YoY in February - and will likely increase further in the coming months.
My suspicion - based on all of the above data - is rent increases will slow over the coming months.

BLS: Job Openings at Series High 11.5 million in March
by Calculated Risk on 5/03/2022 10:05:00 AM
From the BLS: Job Openings and Labor Turnover Summary
The number of job openings was at a series high of 11.5 million on the last business day of March, although little changed over the month, the U.S. Bureau of Labor Statistics reported today. Hires, at 6.7 million, were also little changed while total separations edged up to 6.3 million. Within separations, quits edged up to a series high of 4.5 million, while layoffs and discharges were little changed at 1.4 million.The following graph shows job openings (yellow line), hires (dark blue), Layoff, Discharges and other (red column), and Quits (light blue column) from the JOLTS.
emphasis added
This series started in December 2000.
Note: The difference between JOLTS hires and separations is similar to the CES (payroll survey) net jobs headline numbers. This report is for March, the employment report this Friday will be for April.
 Click on graph for larger image.
Note that hires (dark blue) and total separations (red and light blue columns stacked) are usually pretty close each month. This is a measure of labor market turnover. When the blue line is above the two stacked columns, the economy is adding net jobs - when it is below the columns, the economy is losing jobs.
The spike in layoffs and discharges in March 2020 are labeled, but off the chart to better show the usual data.
Jobs openings increased slightly in March to 11.549 million from 11.344 million in February.
The number of job openings (yellow) were up 36% year-over-year.
Quits were up 23% year-over-year. These are voluntary separations. (See light blue columns at bottom of graph for trend for "quits").
CoreLogic: House Prices up Record 20.9% YoY in March
by Calculated Risk on 5/03/2022 08:00:00 AM
Notes: This CoreLogic House Price Index report is for March. The recent Case-Shiller index release was for February. The CoreLogic HPI is a three-month weighted average and is not seasonally adjusted (NSA).
From CoreLogic: U.S. Annual Home Price Growth Exceeds 20% in March, CoreLogic Reports
CoreLogic® ... today released the CoreLogic Home Price Index (HPI™) and HPI Forecast™ for March 2022.
U.S. home prices continued to post significant year-over-year gains in March, up by 20.9%, another record high. Even with the past year’s streak of double-digit price increases, annual gains are projected to slow to around 6% by next March, due in part to rising mortgage rates and higher home prices hampering affordability for some home shoppers. Buyers who closed on a property in March had a good chance of locking in mortgage rates around 4% or slightly lower. By late April, rates had moved up to more than 5%, a jump of about 30% from the same time last year and a trend that might derail more prospective buyers.
“The annual growth in the U.S. index was the largest we have measured in the 45-year history of the CoreLogic Home Price Index,” said Dr. Frank Nothaft, chief economist at CoreLogic. “Couple that price increase with the rapid rise in mortgage rates and buyer affordability has fallen sharply. In April, 30-year fixed mortgage rates averaged nearly 2 percentage points higher than one year earlier. With the growth in home prices, that means the monthly principal and interest payment to buy the median-priced home was up about 50% in April compared with last April.”
...
Nationally, home prices increased 20.9% in March 2022, compared to March 2021. On a month-over-month basis, home prices increased by 3.3% compared to February 2022.
...
Annual home price gains are forecast to slow to 5.9% by March 2023.
emphasis added
Monday, May 02, 2022
Tuesday: Job Openings, Corelogic House Prices, Vehicle Sales
by Calculated Risk on 5/02/2022 08:46:00 PM
From Matthew Graham at Mortgage News Daily: 30yr Fixed Mortgage Rates Now Over 5.5%
The hits keep coming for mortgage rates in 2022. Not since the early 80s have rates risen as quickly as they have in the past 2 months (or the past 4 months for that matter). Less than 6 months ago, some lenders were still quoting top tier conforming 30yr fixed rates just under 3%. As recently as early March, those same rates were still in the high 3's at times. Now today, the average lender is easily over 5.5%. [30 year fixed 5.55%]Tuesday:
emphasis added
• At 8:00 AM ET, Corelogic House Price index for March.
• At 10:00 AM, Job Openings and Labor Turnover Survey for March from the BLS.
• All day, Light vehicle sales for April. The expectation is for light vehicle sales to be 13.8 million SAAR in April, up from 13.36 million in March (Seasonally Adjusted Annual Rate).
On COVID (focus on hospitalizations and deaths):
| COVID Metrics | ||||
|---|---|---|---|---|
| Now | Week Ago | Goal | ||
| Percent fully Vaccinated | 66.2% | --- | ≥70.0%1 | |
| Fully Vaccinated (millions) | 219.7 | --- | ≥2321 | |
| New Cases per Day3🚩 | 57,020 | 45,428 | ≤5,0002 | |
| Hospitalized3🚩 | 10,591 | 10,366 | ≤3,0002 | |
| Deaths per Day3 | 307 | 346 | ≤502 | |
| 1 Minimum to achieve "herd immunity" (estimated between 70% and 85%). 2my goals to stop daily posts, 37-day average for Cases, Currently Hospitalized, and Deaths 🚩 Increasing 7-day average week-over-week for Cases, Hospitalized, and Deaths ✅ Goal met. | ||||
 Click on graph for larger image.
This graph shows the daily (columns) and 7-day average (line) of deaths reported.
Average daily deaths bottomed in July 2021 at 214 per day.
Update: Framing Lumber Prices: Down from Recent Peak, but increasing Recently
by Calculated Risk on 5/02/2022 04:08:00 PM
Here is another monthly update on framing lumber prices.
This graph shows CME random length framing futures through May 2nd.
Lumber was at $1,035 per 1000 board feet this morning.
This is down from the peak of $1,733, and down from $1,670 a year ago - but up sharply from $361 two years ago.
 Click on graph for larger image.
A combination of strong demand and various supply constraints have kept lumber prices high and volatile.
 Click on graph for larger image.
There is somewhat of a seasonal demand for lumber, and lumber prices usually peak in April or May (although it seems likely lumber prices peaked earlier this year).
A combination of strong demand and various supply constraints have kept lumber prices high and volatile.
Black Knight Mortgage Monitor: Record Low Delinquencies, "Home Affordability Nears All-Time Low"
by Calculated Risk on 5/02/2022 11:37:00 AM
Today, in the Calculated Risk Real Estate Newsletter: Black Knight Mortgage Monitor for March: "Home Affordability Nears All-Time Low"
A brief excerpt:
Note: Black Knights data on affordability goes back to 1996. This doesn’t include housing in the 1980 period when 30-year mortgage rates peaked at over 18%.There is much more in the article. You can subscribe at https://calculatedrisk.substack.com/
And on the payment to income ratio:
• The least affordable American housing has ever been was back in July 2006, when it took 34.1% of median income to make the monthly P&I payment on the average-priced home bought with 20% downAs Black Knight has noted, there were “affordability products” with low teaser rates available during the housing bubble. Excluding the bubble years, this is the worst affordability since at least the early ‘90s, maybe '80s.
• As of April 21, that payment-to-income ratio has now climbed all the way to 32.5%, within just 1.6 points of the prior record
• A rise of just 50 more basis points (BPS) in rates or a 5% rise in home prices, would push affordability to its worst level on record, and they are already up 200 BPS and 5.9% respectively since the start of 2022
• 37 markets – representing nearly a third of the country – are now the least affordable they’ve ever been

Construction Spending Increased 0.1% in March
by Calculated Risk on 5/02/2022 10:20:00 AM
From the Census Bureau reported that overall construction spending increased 1.3%:
Construction spending during March 2022 was estimated at a seasonally adjusted annual rate of $1,730.5 billion, 0.1 percent above the revised February estimate of $1,728.6 billion. The March figure is 11.7 percent above the March 2021 estimate of $1,548.6 billion.Private spending increased and public spending decreased:
emphasis added
Spending on private construction was at a seasonally adjusted annual rate of $1,379.7 billion, 0.2 percent above the revised February estimate of $1,376.9 billion. ...
In March, the estimated seasonally adjusted annual rate of public construction spending was $350.8 billion, 0.2 percent below the revised February estimate of $351.7 billion.
 Click on graph for larger image.
This graph shows private residential and nonresidential construction spending, and public spending, since 1993. Note: nominal dollars, not inflation adjusted.
Residential (red) spending is 30% above the bubble peak (in nominal terms - not adjusted for inflation).
Non-residential (blue) spending is 20% above the bubble era peak in January 2008 (nominal dollars).
Public construction spending is 8% above the peak in March 2009.
 The second graph shows the year-over-year change in construction spending.
On a year-over-year basis, private residential construction spending is up 18.4%. Non-residential spending is up 8.5% year-over-year. Public spending is up 1.7% year-over-year.
This was below consensus expectations of a 0.7% increase in spending; however, construction spending for the previous two months was revised up.
ISM® Manufacturing index Decreased to 55.4% in April
by Calculated Risk on 5/02/2022 10:05:00 AM
(Posted with permission). The ISM manufacturing index indicated expansion. The PMI® was at 55.4% in April, down from 57.1% in March. The employment index was at 50.9%, down from 56.3% last month, and the new orders index was at 53.5%, down from 53.8%.
From ISM: Manufacturing PMI® at 55.4% April 2022 Manufacturing ISM® Report On Business®
Economic activity in the manufacturing sector grew in April, with the overall economy achieving a 23rd consecutive month of growth, say the nation’s supply executives in the latest Manufacturing ISM® Report On Business®.This suggests manufacturing expanded at a slower pace in April than in March. This was below the consensus forecast, and the employment index was weak in April.
The report was issued today by Timothy R. Fiore, CPSM, C.P.M., Chair of the Institute for Supply Management® (ISM®) Manufacturing Business Survey Committee:
“The April Manufacturing PMI® registered 55.4 percent, a decrease of 1.7 percentage points from the March reading of 57.1 percent. This figure indicates expansion in the overall economy for the 23rd month in a row after a contraction in April and May 2020. This is the lowest reading since July 2020 (53.9 percent). The New Orders Index registered 53.5 percent, down 0.3 percentage point compared to the March reading of 53.8 percent. The Production Index reading of 53.6 percent is a 0.9-percentage point decrease compared to March’s figure of 54.5 percent. The Prices Index registered 84.6 percent, down 2.5 percentage points compared to the March figure of 87.1 percent. The Backlog of Orders Index registered 56 percent, 4 percentage points lower than the March reading of 60 percent. The Employment Index figure of 50.9 percent is 5.4 percentage points lower than the 56.3 percent recorded in March. The Supplier Deliveries Index registered 67.2 percent, an increase of 1.8 percentage points compared to the March figure of 65.4 percent. The Inventories Index registered 51.6 percent, 3.9 percentage points lower than the March reading of 55.5 percent. The New Export Orders Index reading of 52.7 percent is down 0.5 percentage point compared to March’s figure of 53.2 percent. The Imports Index registered 51.4 percent, a 0.4-percentage point decrease from the March reading of 51.8 percent.”
emphasis added


