 RSS Feed
 by Calculated Risk on 5/05/2022 03:27:00 PM
Thursday, May 05, 2022
Hotels: Occupancy Rate Down 3.4% Compared to Same Week in 2019
From CoStar: STR: US Hotel Occupancy Increases From Previous Week
U.S. hotel occupancy improved from the previous week, while average daily rate (ADR) decreased slightly, according to STR‘s latest data through April 30.The following graph shows the seasonal pattern for the hotel occupancy rate using the four-week average.
April 24-30, 2022 (percentage change from comparable week in 2019*):
• Occupancy: 66.6% (-3.4%)
• Average daily rate (ADR): $146.67 (+10.2%)
• Revenue per available room (RevPAR): $97.72 (+6.4%)
*Due to the pandemic impact, STR is measuring recovery against comparable time periods from 2019.
emphasis added
 Click on graph for larger image.
The red line is for 2022, black is 2020, blue is the median, and dashed light blue is for 2021. Dashed purple is 2019 (STR is comparing to a strong year for hotels).
The 4-week average of the occupancy rate is at the median rate for the previous 20 years (Blue).
Note: Y-axis doesn't start at zero to better show the seasonal change.
The 4-week average of the occupancy rate will now mostly move sideways seasonally until the summer.
Lawler: Mortgage/Treasury Spreads, Part I
by Calculated Risk on 5/05/2022 12:12:00 PM
Today, in the Calculated Risk Real Estate Newsletter: Lawler: Mortgage/Treasury Spreads, Part I
A brief excerpt:
From housing economist Tom Lawler:There is much more in the article. You can subscribe at https://calculatedrisk.substack.com/
...
The most widely quoted statistic from the PMMS is the 30-year mortgage rate from the survey. Yet the survey also shows the typical/average fees/points associated with this interest rate, and these fees/points have changed dramatically over time. Below is a historical chart showing the fees/points charged along with the PMMS rate.
Click on graph for larger image.
As the chart shows, from the late 70’s to the late 90’s the average fees/points associated with the PMMS mortgage rate were substantially higher than has been the case over the last two decades. As such, the spread between the “effective” mortgage rate and the PMMS mortgage rate was considerably wider from the late 70’s to the late 90’s than has been than in the more recent decades.
...
More on this topic later. However, the fact that nominal mortgage to 10-year Treasury spreads have widened considerably this year is not surprising given other developments in fixed-income markets, and there is no reason to expect that they will revert back to some “mean” level.

MBA: "Mortgage Delinquencies Decrease in the First Quarter of 2022"
by Calculated Risk on 5/05/2022 10:13:00 AM
From the MBA: Mortgage Delinquencies Decrease in the First Quarter of 2022
The delinquency rate for mortgage loans on one-to-four-unit residential properties decreased to a seasonally adjusted rate of 4.11 percent of all loans outstanding at the end of the first quarter of 2022, according to the Mortgage Bankers Association’s (MBA) National Delinquency Survey.
For the purposes of the survey, MBA asks servicers to report loans in forbearance as delinquent if the payment was not made based on the original terms of the mortgage. The delinquency rate decreased 54 basis points from the fourth quarter of 2021 and was down 227 basis points from one year ago.
“The mortgage delinquency rate dropped for the seventh consecutive quarter, reaching its lowest level since the fourth quarter of 2019,” said Marina Walsh, CMB, MBA’s Vice President of Industry Analysis. “The decrease in delinquency rates was apparent across all loan types, and especially for FHA loans. The delinquency rate for FHA loans declined 118 basis points from fourth-quarter 2021 and was down 509 basis points from one year ago.”
According to Walsh, most of the improvement in loan performance can be attributed to the movement of loans that were 90-days or more delinquent. The majority of these aged delinquencies were either cured or entered post-forbearance loan workouts.
The expiration of pandemic-related foreclosure moratoriums led to a modest increase in foreclosure starts from the record lows maintained over the past two years. At 0.19 percent, the foreclosure starts rate remains below the quarterly average of 0.41 percent dating back to 1979.
Added Walsh, “Given the nation’s limited housing inventory and the variety of home retention and foreclosure alternatives on the table across various loan types, the probability of a significant foreclosure surge is minimal. Borrowers have more choices today to either stay in their homes or sell without resorting to a foreclosure.”
emphasis added
 Click on graph for larger image.
This graph shows the percent of loans delinquent by days past due. Overall delinquencies decreased in Q1.
From the MBA:
Compared to last quarter, the seasonally adjusted mortgage delinquency rate decreased for all loans outstanding. By stage, the 30-day delinquency rate decreased 6 basis points to 1.59 percent, the 60-day delinquency rate remained unchanged at 0.56 percent, and the 90-day delinquency bucket decreased 48 basis points to 1.96 percent.This sharp increase in 2020 in the 90-day bucket was due to loans in forbearance (included as delinquent, but not reported to the credit bureaus).
...
The delinquency rate includes loans that are at least one payment past due but does not include loans in the process of foreclosure. The percentage of loans in the foreclosure process at the end of the first quarter was 0.53 percent, up 11 basis points from the fourth quarter of 2021 and down 1 basis point from one year ago. The percentage of loans on which foreclosure actions were started in the first quarter rose by 15 basis points to 0.19 percent. The foreclosure starts rate remains below the quarterly average of 0.41 percent dating back to 1979.
The percent of loans in the foreclosure process increased in Q1 with the end of the foreclosure moratoriums.
April Employment Preview
by Calculated Risk on 5/05/2022 09:35:00 AM
On Friday at 8:30 AM ET, the BLS will release the employment report for April. The consensus is for 400,000 jobs added, and for the unemployment rate to be unchanged at 3.6%.
 Click on graph for larger image.
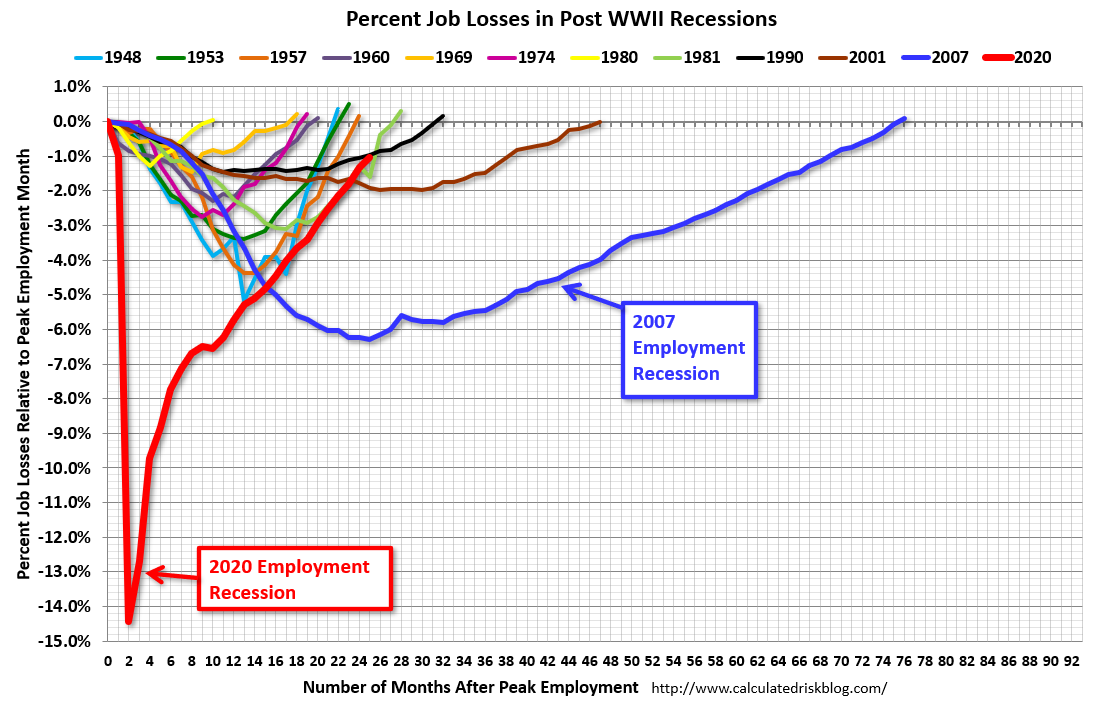
• First, currently there are still about 1.6 million fewer jobs than in February 2020 (the month before the pandemic).
This graph shows the job losses from the start of the employment recession, in percentage terms.
The current employment recession was by far the worst recession since WWII in percentage terms. However, the current employment recession, 25 months after the onset, has recovered quicker than the previous two recessions.
• ADP Report: The ADP employment report showed a gain of 247,000 private sector jobs, well below the consensus estimates of 395,000 jobs added. The ADP report hasn't been very useful in predicting the BLS report, but this suggests a weaker than expected BLS report.
• ISM Surveys: Note that the ISM services are diffusion indexes based on the number of firms hiring (not the number of hires). The ISM® manufacturing employment index decreased in April to 50.9%, down from 56.3% last month. This would suggest 15,000 jobs lost in manufacturing employment in April. ADP showed 25,000 manufacturing jobs added.
The ISM® Services employment index decreased in April to 49.5%, down from 54.0% last month. This would suggest a 60 thousand increase in service employment in April. Combined, the ISM indexes suggest employment well below the consensus estimate.
• Unemployment Claims: The weekly claims report showed an increase in the number of initial unemployment claims during the reference week (includes the 12th of the month) from 177,000 in March to 185,000 in April. This would usually suggest a few mort layoffs in April than in March, although this might not be very useful right now. In general, weekly claims were at expectations in April.
 • Permanent Job Losers: Something to watch in the employment report will be "Permanent job losers". This graph shows permanent job losers as a percent of the pre-recession peak in employment through the January report.
This data is only available back to 1994, so there is only data for three recessions. In March, the number of permanent job losers decreased to 1.392 million from 1.583 million in the previous month.
These jobs will likely be the hardest to recover, so it is a positive that the number of permanent job losers is declining fairly rapidly.
• COVID: As far as the pandemic, the number of daily cases during the reference week in April was around 30,000, down slightly from around 33,000 in March. This is neutral for the April report.
• Seasonality: Over the last 15 months, the economy has averaged 562,000 jobs added per month. The only month below 400,000 in the last 15 months was April 2021.
In April 2021, the consensus was for 978,000 jobs added, and the BLS reported 266,000 jobs added (a large miss). It is possible there is a seasonal impact from the 20+ million jobs lost in April 2020 (although the BLS is trying to remove that impact in their seasonal adjustments).
• Conclusion: The consensus is for job growth to slow to 400,000 jobs added in April. Overall, the ADP report was below expectations, the ISM employment surveys were weak, and unemployment claims was mostly neutral during the reference week. This suggests a weaker than expected employment report for April.
Weekly Initial Unemployment Claims Increase to 200,000
by Calculated Risk on 5/05/2022 08:33:00 AM
The DOL reported:
In the week ending April 30, the advance figure for seasonally adjusted initial claims was 200,000, an increase of 19,000 from the previous week's revised level. The previous week's level was revised up by 1,000 from 180,000 to 181,000. The 4-week moving average was 188,000, an increase of 8,000 from the previous week's revised average. The previous week's average was revised up by 250 from 179,750 to 180,000.The following graph shows the 4-week moving average of weekly claims since 1971.
emphasis added
 Click on graph for larger image.
The dashed line on the graph is the current 4-week average. The four-week average of weekly unemployment claims increased to 188,000.
The previous week was revised up.
Weekly claims were higher than the consensus forecast.
Wednesday, May 04, 2022
Thursday: Unemployment Claims
by Calculated Risk on 5/04/2022 10:49:00 PM
Thursday:
• At 8:30 AM ET, The initial weekly unemployment claims report will be released. The consensus is for 180 thousand unchanged from 180 thousand last week.
FOMC Statement: Raise Rates 50bp; Runoff Starts June 1st
by Calculated Risk on 5/04/2022 02:04:00 PM
Fed Chair Powell press conference video here starting at 2:30 PM ET.
FOMC Statement:
Although overall economic activity edged down in the first quarter, household spending and business fixed investment remained strong. Job gains have been robust in recent months, and the unemployment rate has declined substantially. Inflation remains elevated, reflecting supply and demand imbalances related to the pandemic, higher energy prices, and broader price pressures.
The invasion of Ukraine by Russia is causing tremendous human and economic hardship. The implications for the U.S. economy are highly uncertain. The invasion and related events are creating additional upward pressure on inflation and are likely to weigh on economic activity. In addition, COVID-related lockdowns in China are likely to exacerbate supply chain disruptions. The Committee is highly attentive to inflation risks.
The Committee seeks to achieve maximum employment and inflation at the rate of 2 percent over the longer run. With appropriate firming in the stance of monetary policy, the Committee expects inflation to return to its 2 percent objective and the labor market to remain strong. In support of these goals, the Committee decided to raise the target range for the federal funds rate to 3/4 to 1 percent and anticipates that ongoing increases in the target range will be appropriate. In addition, the Committee decided to begin reducing its holdings of Treasury securities and agency debt and agency mortgage-backed securities on June 1, as described in the Plans for Reducing the Size of the Federal Reserve's Balance Sheet that were issued in conjunction with this statement.
In assessing the appropriate stance of monetary policy, the Committee will continue to monitor the implications of incoming information for the economic outlook. The Committee would be prepared to adjust the stance of monetary policy as appropriate if risks emerge that could impede the attainment of the Committee’s goals. The Committee's assessments will take into account a wide range of information, including readings on public health, labor market conditions, inflation pressures and inflation expectations, and financial and international developments.
Voting for the monetary policy action were Jerome H. Powell, Chair; John C. Williams, Vice Chair; Michelle W. Bowman; Lael Brainard; James Bullard; Esther L. George; Patrick Harker; Loretta J. Mester; and Christopher J. Waller. Patrick Harker voted as an alternate member at this meeting.
emphasis added
Denver Real Estate in April: Active Inventory up Sharply
by Calculated Risk on 5/04/2022 12:04:00 PM
Today, in the Calculated Risk Real Estate Newsletter: Denver Real Estate in April: Active Inventory up Sharply
A brief excerpt:
Every month I track about 35 local housing markets in the US, and I usually post several markets at a time. But this is worth noting.There is more in the article. You can subscribe at https://calculatedrisk.substack.com/
The Denver market is still hot, with historically low inventory, prices increasing, and homes selling above list price, but we are seeing a sharp increase in active inventory. We are still a long way from the “only looky-loos and crickets” phase of the housing cycle, but there is a clear sea change in active inventory.
The Denver Metro Association of Realtors® (DMAR) has released their data for April this morning. From the DMAR: DMAR Real Estate Market Trends ReportThe increased interest rates are already impacting the amount of inventory sitting on the market. While Denver Metro is still relatively low in inventory, the word “historic” is no longer applicable as there were 610 fewer properties on the market last year compared to today. The market usually sees an 8.59 percent increase in month-over-month inventory. This month, it saw an outstanding 44.26 percent increase.DMAR reports total residential active inventory (detached and attached) was 3,204 at the end of April, up 44.3% from 2,221 at the end of March, and up 23.5% year-over-year from 2,594 in March 2021. Inventory is up 171% from the all-time low set in January of this year.
ISM® Services Index Decreased to 57.1% in April, Employment Contracted
by Calculated Risk on 5/04/2022 10:07:00 AM
(Posted with permission). The ISM® Services index was at 57.1%, down from 58.3% last month. The employment index decreased to 49.5%, from 54.0%. Note: Above 50 indicates expansion, below 50 in contraction.
From the Institute for Supply Management: Services PMI® at 57.1% April 2022 Services ISM® Report On Business®
Economic activity in the services sector grew in April for the 23rd month in a row — with the Services PMI® registering 57.1 percent — say the nation’s purchasing and supply executives in the latest Services ISM® Report On Business®.
The report was issued today by Anthony Nieves, CPSM, C.P.M., A.P.P., CFPM, Chair of the Institute for Supply Management® (ISM®) Services Business Survey Committee: “In April, the Services PMI® registered 57.1 percent, 1.2 percentage points lower than March’s reading of 58.3 percent. The Business Activity Index registered 59.1 percent, an increase of 3.6 percentage points compared to the reading of 55.5 percent in March, and the New Orders Index figure of 54.6 percent is 5.5 percentage points lower than the March reading of 60.1 percent.
...
Employment activity in the services sector contracted in April. ISM®’s Employment Index registered 49.5 percent, down 4.5 percentage points from the reading of 54 percent registered in March. Comments from respondents include: “Job openings exist, but finding talent to fill them remains a struggle across most industry sectors and job categories” and “Demand for employment remains hypercompetitive; there is just not enough qualified personnel available.”
emphasis added
Trade Deficit increased to $109.8 Billion in March
by Calculated Risk on 5/04/2022 08:40:00 AM
From the Department of Commerce reported:
The U.S. Census Bureau and the U.S. Bureau of Economic Analysis announced today that the goods and services deficit was $109.8 billion in March, up $20.0 billion from $89.8 billion in February, revised.
March exports were $241.7 billion, $12.9 billion more than February exports. March imports were $351.5 billion, $32.9 billion more than February imports.
emphasis added
 Click on graph for larger image.
Both exports and imports increased in March.
Exports are up 18% year-over-year; imports are up 27% year-over-year.
Both imports and exports decreased sharply due to COVID-19, and have now bounced back (imports more than exports),
The second graph shows the U.S. trade deficit, with and without petroleum.
 The blue line is the total deficit, and the black line is the petroleum deficit, and the red line is the trade deficit ex-petroleum products.
Note that net, imports and exports of petroleum products are close to zero.
The trade deficit with China increased to $34.0 billion in March, from $27.7 billion a year ago.
This is a record trade deficit and was close to expectations.


