 RSS Feed
 by Calculated Risk on 5/12/2022 08:11:00 PM
Thursday, May 12, 2022
Mortgage Rates Move Lower
From Matthew Graham at MortgageNewsDaily: Rates Are Actually Lower Today (And This Week)
Rates are actually lower today and significantly lower than last week. In fact, as long as they're still ending the business week on Fridays, this week's rates are significantly lower, with the average lender offering conventional 30yr fixed rates about a quarter of a point below those seen on Friday afternoon.
You'd have to go all the way back to April 27th to see anything as low.
...
The average lender is now quoting conventional 30yr fixed rates in the at 5.375% or lower for top tier scenarios. This is down from 5.625% at the recent highs just a few days ago.
 Click on graph for larger image.
This is a graph from Mortgage News Daily (MND) showing 30-year fixed rates from three sources (MND, MBA, Freddie Mac) since the beginning of 2021.
The 30-year fixed rate for top tier scenarios was 5.35% today, down from the recent high of 5.64%.
Go to MND and you can adjust the graph for different time periods.
Realtor.com Reports Weekly Inventory Up Slightly Year-over-year; First Year-over-year Increase Since 2019
by Calculated Risk on 5/12/2022 10:32:00 AM
Today, in the Calculated Risk Real Estate Newsletter: Realtor.com Reports Weekly Inventory Up Slightly Year-over-year
Excerpt:
Realtor.com has monthly and weekly data on the existing home market. Here is their weekly report released this morning from Chief Economist Danielle Hale: Weekly Housing Trends View — Data Week Ending May 7, 2022. Note: They have data on list prices, new listings and more, but this focus is on inventory.• Active inventory grew for the first time since 2019. While the size of the improvement rounded to 0%, this week’s data [marks] the first time that inventory figures weren’t lower than the previous year since June 2019. Our April Housing Trends Report showed that the active listings count remained 60 percent below its level right at the onset of the pandemic. This means that for every 5 homes available for sale in the earlier period, today there are just 2. In other words, homes for sale are still limited. However, the switch to growth after nearly 3 years of decline is a step in the right direction, even though inventory continues to lag pre-pandemic normal.Here is a graph of the year-over-year change in inventory according to realtor.com. Note: I corrected a sign error in the data for Feb 26, 2022.
Note the rapid increase in the YoY change, from down 30% at the beginning of the year, to unchanged YoY now. It will be important to watch if that trend continues.
The previous week, inventory was down 3.4% YoY according to Realtor.com. That is close to the 1.6% decline that Altos reported for the similar period. I expect Altos to report a year-over-year increase in inventory on Monday.

There is much more in the article. You can subscribe at https://calculatedrisk.substack.com/
Weekly Initial Unemployment Claims Increase to 203,000
by Calculated Risk on 5/12/2022 08:35:00 AM
The DOL reported:
In the week ending May 7, the advance figure for seasonally adjusted initial claims was 203,000, an increase of 1,000 from the previous week's revised level. The previous week's level was revised up by 2,000 from 200,000 to 202,000. The 4-week moving average was 192,750, an increase of 4,250 from the previous week's revised average. The previous week's average was revised up by 500 from 188,000 to 188,500.The following graph shows the 4-week moving average of weekly claims since 1971.
emphasis added
 Click on graph for larger image.
The dashed line on the graph is the current 4-week average. The four-week average of weekly unemployment claims increased to 192,750.
The previous week was revised up.
Weekly claims were lower than the consensus forecast.
Wednesday, May 11, 2022
Thursday: PPI, Unemployment Claims
by Calculated Risk on 5/11/2022 08:50:00 PM
Thursday:
• At 8:30 AM ET, the initial weekly unemployment claims report will be released. The consensus is for 210 thousand up from 200 thousand last week.
• At 8:30 AM, The Producer Price Index for April from the BLS. The consensus is for a 0.5% increase in PPI, and a 0.6% increase in core PPI.
On COVID (focus on hospitalizations and deaths):
| COVID Metrics | ||||
|---|---|---|---|---|
| Now | Week Ago | Goal | ||
| Percent fully Vaccinated | 66.3% | --- | ≥70.0%1 | |
| Fully Vaccinated (millions) | 220.3 | --- | ≥2321 | |
| New Cases per Day3🚩 | 78,236 | 61,715 | ≤5,0002 | |
| Hospitalized3🚩 | 14,104 | 12,291 | ≤3,0002 | |
| Deaths per Day3 | 326 | 332 | ≤502 | |
| 1 Minimum to achieve "herd immunity" (estimated between 70% and 85%). 2my goals to stop daily posts, 37-day average for Cases, Currently Hospitalized, and Deaths 🚩 Increasing 7-day average week-over-week for Cases, Hospitalized, and Deaths ✅ Goal met. | ||||
 Click on graph for larger image.
This graph shows the daily (columns) and 7-day average (line) of deaths reported.
Average daily deaths bottomed in July 2021 at 214 per day.
2nd Look at Local Housing Markets in April; Inventory increasing, No Surge in New Listings
by Calculated Risk on 5/11/2022 12:48:00 PM
Today, in the Calculated Risk Real Estate Newsletter: 2nd Look at Local Housing Markets in April
A brief excerpt:
Here is a summary of active listings for these housing markets in April. Note: Inventory usually increases seasonally in April, so some month-over-month (MoM) increase is not surprising.There is much more in the article. You can subscribe at https://calculatedrisk.substack.com/
Inventory was up 17.9% in April MoM from March, and up 4.9% year-over-year (YoY). Eight of 15 markets were up YoY.
Active inventory in these markets were down 19% YoY in February, and down 4.8% YoY in March, so this is a significant change from February and March. This is another step towards a more balanced market, but inventory levels are still very low.
Notes for all tables:
1) New additions to table in BOLD.
2) Northwest (Seattle), North Texas (Dallas) and Santa Clara (San Jose), Jacksonville, Source: Northeast Florida Association of REALTORS®
3) Totals do not include Atlanta (included in state total).

Cleveland Fed: Median CPI increased 0.5% and Trimmed-mean CPI increased 0.4% in April
by Calculated Risk on 5/11/2022 11:18:00 AM
The Cleveland Fed released the median CPI and the trimmed-mean CPI this morning:
According to the Federal Reserve Bank of Cleveland, the median Consumer Price Index rose 0.5% in April. The 16% trimmed-mean Consumer Price Index increased 0.4% in April. "The median CPI and 16% trimmed-mean CPI are measures of core inflation calculated by the Federal Reserve Bank of Cleveland based on data released in the Bureau of Labor Statistics’ (BLS) monthly CPI report".
Note: The Cleveland Fed released the median CPI details here: "Used Cars" were down slightly annualized in April, and this will likely show further declines in coming months. Motor fuel was down 51% annualized in April after increasing sharply in March
Note that Owners' Equivalent Rent and Rent of Primary Residence account for almost 1/3 of median CPI, and these measures were up around 5% to 6% annualized in April.
 Click on graph for larger image.
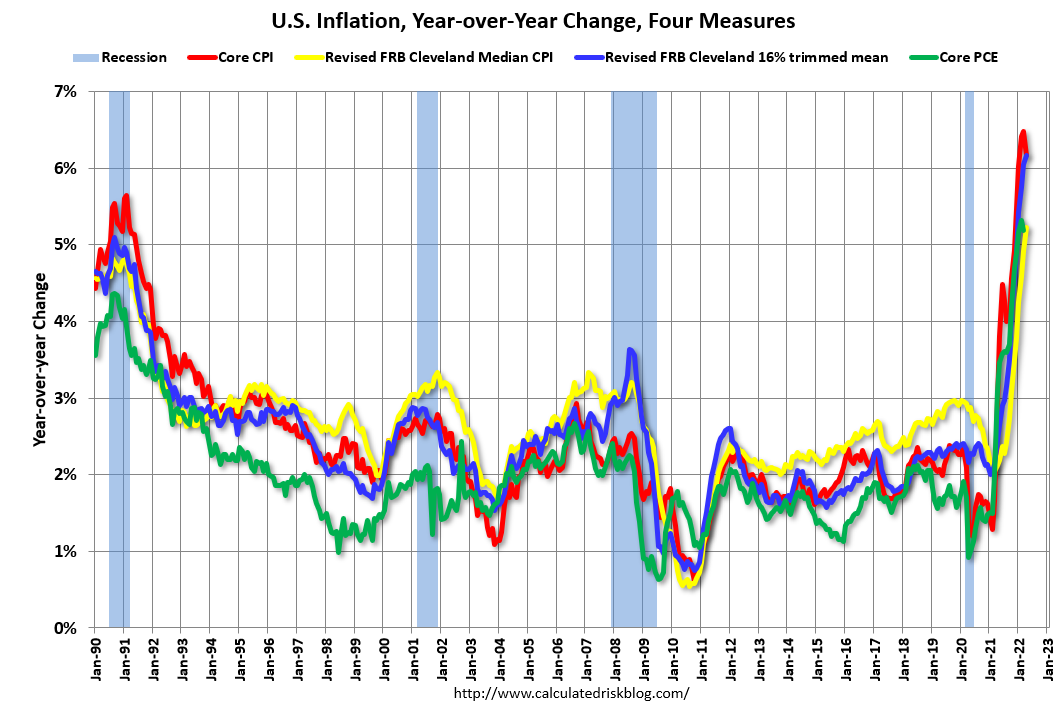
This graph shows the year-over-year change for these four key measures of inflation.
 Click on graph for larger image.
This graph shows the year-over-year change for these four key measures of inflation.
On a year-over-year basis, the median CPI rose 5.2%, the trimmed-mean CPI rose 6.2%, and the CPI less food and energy rose 6.2%. Core PCE is for March and increased 5.2% year-over-year.
BLS: CPI increased 0.3% in April; Core CPI increased 0.6%
by Calculated Risk on 5/11/2022 08:33:00 AM
The Consumer Price Index for All Urban Consumers (CPI-U) increased 0.3 percent in April on a seasonally adjusted basis after rising 1.2 percent in March, the U.S. Bureau of Labor Statistics reported today. Over the last 12 months, the >all items index increased 8.3 percent before seasonal adjustment.The consensus was for 0.2% increase in CPI (up 8.1% YoY), and a 0.4% increase in core CPI (up 6.1% YoY). Both were above expectations. I'll post a graph later today after the Cleveland Fed releases the median and trimmed-mean CPI.
Increases in the indexes for shelter, food, airline fares, and new vehicles were the largest contributors to the seasonally adjusted all items increase. The food index rose 0.9 percent over the month as the food at home index rose 1.0 percent. The energy index declined in April after rising in recent months. The index for gasoline fell 6.1 percent over the month, offsetting increases in the indexes for natural gas and electricity.
The index for all items less food and energy rose 0.6 percent in April following a 0.3-percent advance in March. Along with indexes for shelter, airline fares, and new vehicles, the indexes for medical care, recreation, and household furnishings and operations all increased in April. The indexes for apparel, communication, and used cars and trucks all declined over the month.
The all items index increased 8.3 percent for the 12 months ending April, a smaller increase than the 8.5-percent figure for the period ending in March. The all items less food and energy index rose 6.2 percent over the last 12 months. The energy index rose 30.3 percent over the last year, and the food index increased 9.4 percent, the largest 12-month increase since the period ending April 1981.
emphasis added
MBA: Mortgage Applications Increase in Latest Weekly Survey
by Calculated Risk on 5/11/2022 07:00:00 AM
From the MBA: Mortgage Applications Increase in Latest MBA Weekly Survey
Mortgage applications increased 2.0 percent from one week earlier, according to data from the Mortgage Bankers Association’s (MBA) Weekly Mortgage Applications Survey for the week ending May 6, 2022.
... The Refinance Index decreased 2 percent from the previous week and was 72 percent lower than the same week one year ago. The seasonally adjusted Purchase Index increased 5 percent from one week earlier. The unadjusted Purchase Index increased 5 percent compared with the previous week and was 8 percent lower than the same week one year ago.
“The increase in mortgage applications last week was driven by a strong gain in application activity for conventional and government purchase loans, even as mortgage rates rose to their highest level – 5.53 percent – since 2009. Despite a slow start to this year’s spring home buying season, prospective buyers are showing some resiliency to higher rates. Purchase activity has now increased for two straight weeks,” said Joel Kan, MBA’s Associate Vice President of Economic and Industry Forecasting. “More borrowers continue to utilize ARMs to combat higher rates. The share of ARMs increased to 11 percent of overall loans and to 19 percent by dollar volume.”
Added Kan, “The rapid rise in mortgages rates continues to hit the refinance market, with activity 70 percent below a year ago. Most homeowners refinanced to lower rates in the past two years.”
...
The average contract interest rate for 30-year fixed-rate mortgages with conforming loan balances ($647,200 or less) increased to 5.53 percent from 5.36 percent, with points increasing to 0.73 from 0.63 (including the origination fee) for 80 percent loan-to-value ratio (LTV) loans
emphasis added
 Click on graph for larger image.
The first graph shows the refinance index since 1990.
With higher mortgage rates, the refinance index has declined sharply over the last several months.
The refinance index just above last week, and that was the lowest level since December 2018.
The second graph shows the MBA mortgage purchase index
 According to the MBA, purchase activity is down 8% year-over-year unadjusted.
Note: Red is a four-week average (blue is weekly).
Tuesday, May 10, 2022
Wednesday: CPI
by Calculated Risk on 5/10/2022 09:00:00 PM
Wednesday:
• At 7:00 AM ET, The Mortgage Bankers Association (MBA) will release the results for the mortgage purchase applications index.
• At 8:30 AM, The Consumer Price Index for April from the BLS. The consensus is for 0.2% increase in CPI (up 8.1% YoY), and a 0.4% increase in core CPI (up 6.1% YoY).
On COVID (focus on hospitalizations and deaths):
| COVID Metrics | ||||
|---|---|---|---|---|
| Now | Week Ago | Goal | ||
| Percent fully Vaccinated | 66.3% | --- | ≥70.0%1 | |
| Fully Vaccinated (millions) | 220.2 | --- | ≥2321 | |
| New Cases per Day3🚩 | 74,712 | 60,554 | ≤5,0002 | |
| Hospitalized3🚩 | 13,538 | 12,047 | ≤3,0002 | |
| Deaths per Day3 | 323 | 331 | ≤502 | |
| 1 Minimum to achieve "herd immunity" (estimated between 70% and 85%). 2my goals to stop daily posts, 37-day average for Cases, Currently Hospitalized, and Deaths 🚩 Increasing 7-day average week-over-week for Cases, Hospitalized, and Deaths ✅ Goal met. | ||||
 Click on graph for larger image.
This graph shows the daily (columns) and 7-day average (line) of deaths reported.
Average daily deaths bottomed in July 2021 at 214 per day.
Mortgage Originations by Credit Score and Age
by Calculated Risk on 5/10/2022 12:01:00 PM
Today, in the Calculated Risk Real Estate Newsletter: Mortgage Originations by Credit Score and Age
A brief excerpt:
The NY Fed released the Q1 Quarterly Report on Household Debt and Credit this morning. Here are a couple of charts from the report.There is much more in the article. You can subscribe at https://calculatedrisk.substack.com/
The first graph shows mortgage originations by credit score (this includes both purchase and refinance). Look at the difference in credit scores in the recent period compared to the during the bubble years (2003 through 2006). Recently there have been almost no originations for borrowers with credit scores below 620, and few below 660. A significant majority of recent originations have been to borrowers with credit score above 760.
Solid underwriting is a key reason I’ve argued Don't Compare the Current Housing Boom to the Bubble and Bust, Look instead at the 1978 to 1982 period for lessons.
From the NY Fed:
Mortgage originations, measured as appearances of new mortgages on consumer credit reports and which include refinances, were at $859 billion in 2022Q1. This represented a decrease from the high volumes seen during 2021, but still was $197 billion higher than the volume seen in 2020Q1, just before the pandemic hit.
The median credit score of newly originated mortgages declined again, to 776, down from a series high in 2021Q1 of 788. Yet, credit scores on newly originated mortgages remain very high and reflect continuing high lending standards.


