 RSS Feed
 by Calculated Risk on 5/19/2022 12:40:00 PM
Thursday, May 19, 2022
Hotels: Occupancy Rate Down 5.9% Compared to Same Week in 2019
U.S. hotel performance improved from the previous week, according to STR‘s latest data through May 14.The following graph shows the seasonal pattern for the hotel occupancy rate using the four-week average.
May 8-14, 2022 (percentage change from comparable week in 2019*):
• Occupancy: 66.5% (-5.9%)
• Average daily rate (ADR): $148.31 (+10.5%)
• Revenue per available room (RevPAR): $98.59 (+4.1%)
*Due to the pandemic impact, STR is measuring recovery against comparable time periods from 2019.
emphasis added
 Click on graph for larger image.
The red line is for 2022, black is 2020, blue is the median, and dashed light blue is for 2021. Dashed purple is 2019 (STR is comparing to a strong year for hotels).
The 4-week average of the occupancy rate is at the median rate for the previous 20 years (Blue).
Note: Y-axis doesn't start at zero to better show the seasonal change.
The 4-week average of the occupancy rate will now mostly move sideways seasonally until the summer travel season.
More Analysis on April Existing Home Sales
by Calculated Risk on 5/19/2022 10:46:00 AM
Today, in the CalculatedRisk Real Estate Newsletter: NAR: Existing-Home Sales Decreased to 5.61 million SAAR in April
Excerpt:
Sales in April (5.61 million SAAR) were down 2.4% from the previous month and were 5.9% below the April 2021 sales rate.There is much more in the article. You can subscribe at https://calculatedrisk.substack.com/ (Most content is available for free, so please subscribe).
The second graph shows existing home sales by month for 2021 and 2022.
Sales declined 5.9% year-over-year compared to March 2021. This was the eighth consecutive month with sales down year-over-year.
...
A key milestone will be when inventory is up year-over-year (YoY). My current guess is inventory will be up YoY next month in the NAR report. Inventory will still be historically very low.
Also note that 30-year mortgage rates averaged 4.98% in April according to Freddie Mac. Now rates are around 5.45%. Sometimes people rush to buy as rates rise - anticipating further rate increases. However, eventually, higher rates will suppress demand. It seems likely we will see a further negative impact on sales from higher rates, and more inventory in the coming months.

NAR: Existing-Home Sales Decreased to 5.61 million SAAR in April
by Calculated Risk on 5/19/2022 10:12:00 AM
From the NAR: Existing-Home Sales Retract 2.4% in April
Existing-home sales recorded a third straight month of declines, slipping slightly in April, according to the National Association of Realtors®. Month-over-month sales were split amongst the four major U.S. regions, with two areas posting gains and the other two experiencing waning in April. Year-over-year sales struggled, as each of the four regions reported dips.
Total existing-home sales, completed transactions that include single-family homes, townhomes, condominiums and co-ops, slid 2.4% from March to a seasonally adjusted annual rate of 5.61 million in April. Year-over-year, sales dropped 5.9% (5.96 million in April 2021).
...
Total housing inventory at the end of April amounted to 1,030,000 units, up 10.8% from March and down 10.4% from one year ago (1.15 million). Unsold inventory sits at a 2.2-month supply at the current sales pace, up from 1.9 months in March and down from 2.3 months in April 2021.
emphasis added
 Click on graph for larger image.
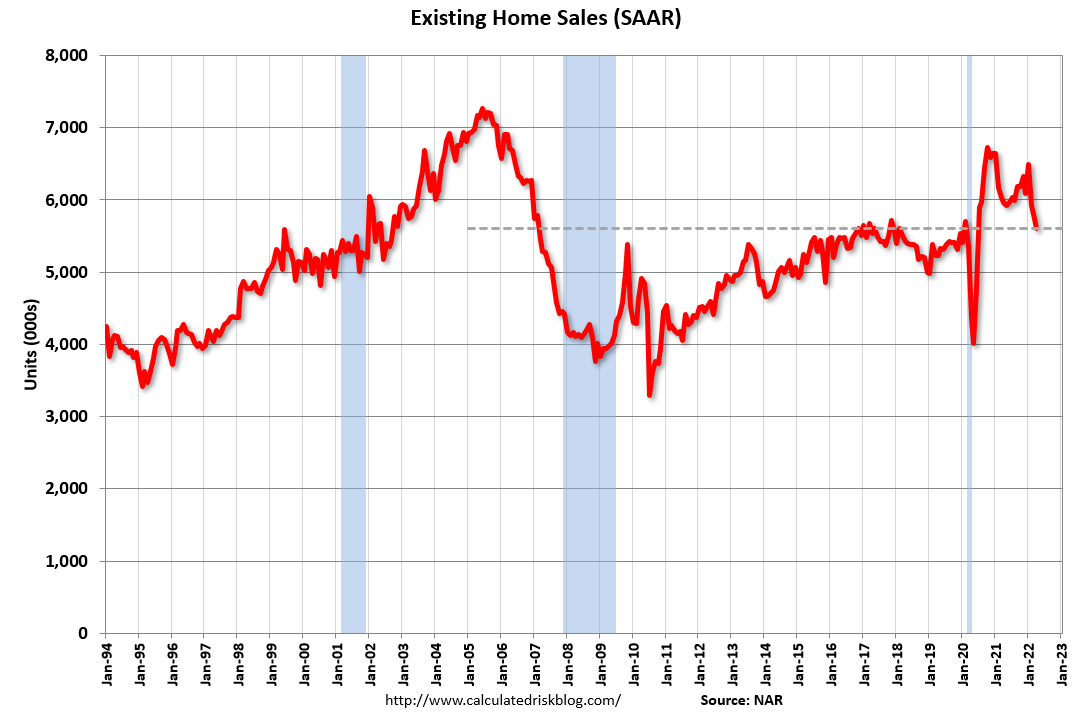
This graph shows existing home sales, on a Seasonally Adjusted Annual Rate (SAAR) basis since 1993.
Sales in April (5.61 million SAAR) were down 2.4% from the previous month and were 5.9% below the April 2021 sales rate.
The second graph shows nationwide inventory for existing homes.
 According to the NAR, inventory increased to 1.03 million in April from 0.93 million in March.
Headline inventory is not seasonally adjusted, and inventory usually decreases to the seasonal lows in December and January, and peaks in mid-to-late summer.
The last graph shows the year-over-year (YoY) change in reported existing home inventory and months-of-supply. Since inventory is not seasonally adjusted, it really helps to look at the YoY change. Note: Months-of-supply is based on the seasonally adjusted sales and not seasonally adjusted inventory.
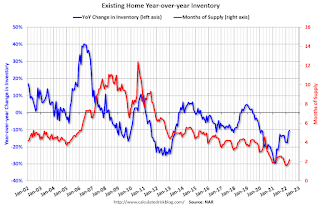 Inventory was down 10.4% year-over-year (blue) in April compared to April 2021.
Months of supply (red) increased to 2.2 months in April from 1.9 months in March.
This was close to the consensus forecast. I'll have more later.
The last graph shows the year-over-year (YoY) change in reported existing home inventory and months-of-supply. Since inventory is not seasonally adjusted, it really helps to look at the YoY change. Note: Months-of-supply is based on the seasonally adjusted sales and not seasonally adjusted inventory.
 Inventory was down 10.4% year-over-year (blue) in April compared to April 2021.
 Months of supply (red) increased to 2.2 months in April from 1.9 months in March.
This was close to the consensus forecast. I'll have more later.
Weekly Initial Unemployment Claims Increase to 218,000
by Calculated Risk on 5/19/2022 08:33:00 AM
The DOL reported:
In the week ending May 14, the advance figure for seasonally adjusted initial claims was 218,000, an increase of 21,000 from the previous week's revised level. The previous week's level was revised down by 6,000 from 203,000 to 197,000. The 4-week moving average was 199,500, an increase of 8,250 from the previous week's revised average. The previous week's average was revised down by 1,500 from 192,750 to 191,250.The following graph shows the 4-week moving average of weekly claims since 1971.
emphasis added
 Click on graph for larger image.
The dashed line on the graph is the current 4-week average. The four-week average of weekly unemployment claims increased to 199,500.
The previous week was revised down.
Weekly claims were higher than the consensus forecast.
Wednesday, May 18, 2022
Thursday: Unemployment Claims, Philly Fed Mfg, Existing Home Sales
by Calculated Risk on 5/18/2022 09:01:00 PM
Thursday:
• At 8:30 AM ET, the initial weekly unemployment claims report will be released. The consensus is for 210 thousand up from 203 thousand last week.
• Also at 8:30 AM, the Philly Fed manufacturing survey for May. The consensus is for a reading of 16.7, down from 17.6.
• At 10:00 AM, Existing Home Sales for April from the National Association of Realtors (NAR). The consensus is for 5.62 million SAAR, down from 5.77 million.
On COVID (focus on hospitalizations and deaths):
| COVID Metrics | ||||
|---|---|---|---|---|
| Now | Week Ago | Goal | ||
| Percent fully Vaccinated | 66.5% | --- | ≥70.0%1 | |
| Fully Vaccinated (millions) | 220.7 | --- | ≥2321 | |
| New Cases per Day3🚩 | 99,347 | 81,031 | ≤5,0002 | |
| Hospitalized3🚩 | 16,624 | 14,258 | ≤3,0002 | |
| Deaths per Day3 | 273 | 317 | ≤502 | |
| 1 Minimum to achieve "herd immunity" (estimated between 70% and 85%). 2my goals to stop daily posts, 37-day average for Cases, Currently Hospitalized, and Deaths 🚩 Increasing 7-day average week-over-week for Cases, Hospitalized, and Deaths ✅ Goal met. | ||||
 Click on graph for larger image.
This graph shows the daily (columns) and 7-day average (line) of deaths reported.
Average daily deaths bottomed in July 2021 at 214 per day.
Lawler: Early Read on Existing Home Sales in April
by Calculated Risk on 5/18/2022 02:43:00 PM
From housing economist Tom Lawler:
Based on publicly available local realtor/MLS reports released across the country through today, I project that existing home sales as estimated by the National Association of Realtors ran at a seasonally adjusted annual rate of 5.57 million in April, down 3.5% from March’s preliminary pace and down 6.5% from last April’s seasonally adjusted pace. Unadjusted sales should show a larger YOY % decline, reflecting this April’s lower business day count compared to last April’s.
Local realtor reports, as well as reports from national inventory trackers, suggest that the YOY % decline in the inventory of existing homes for sale last month was significantly lower than was the case last month, and other indicators suggest the inventory in May will be up YOY.
Finally, local realtor/MLS reports suggest the median existing single-family home sales price last month was up by about 15.2% from last April.
CR Note: The National Association of Realtors (NAR) is scheduled to release April existing home sales on Thursday, May 19, 2022, at 10:00 AM ET. The consensus is for 5.62 million SAAR.
AIA: "Architecture Billings Index moderates slightly, remains strong" in April
by Calculated Risk on 5/18/2022 12:35:00 PM
Note: This index is a leading indicator primarily for new Commercial Real Estate (CRE) investment.
From the AIA: Architecture Billings Index moderates slightly, remains strong
For the fifteenth consecutive month architecture firms reported increasing demand for design services in April, according to a new report today from The American Institute of Architects (AIA)
AIA’s Architecture Billings Index score for April was 56.5 compared to 58.0 in March. Any score above 50 indicates an increase in billings. During April, scores for both new project inquiries and design contracts moderated slightly, but remained strong, posting scores of 62.3 and 55.4, respectively.
“While business conditions at architecture firms have been very encouraging over the past year, project activity has been steadily shifting toward work on existing buildings,” said AIA Chief Economist, Kermit Baker, Hon. AIA, PhD. “Billings for reconstruction projects exceeded those for new construction for the first time in the last two decades. While the reconstruction share of building activity will continue to ebb and flow, in general, we’ll continue to move toward an increased share of building activity for reconstruction and a decreased share for new construction.”
...
• Regional averages: West (58.2); Midwest (57.6); South (57.3); Northeast (53.1)
• Sector index breakdown: mixed practice (61.2); commercial/industrial (60.7); multi-family residential (57.2); institutional (51.8)
emphasis added
 Click on graph for larger image.
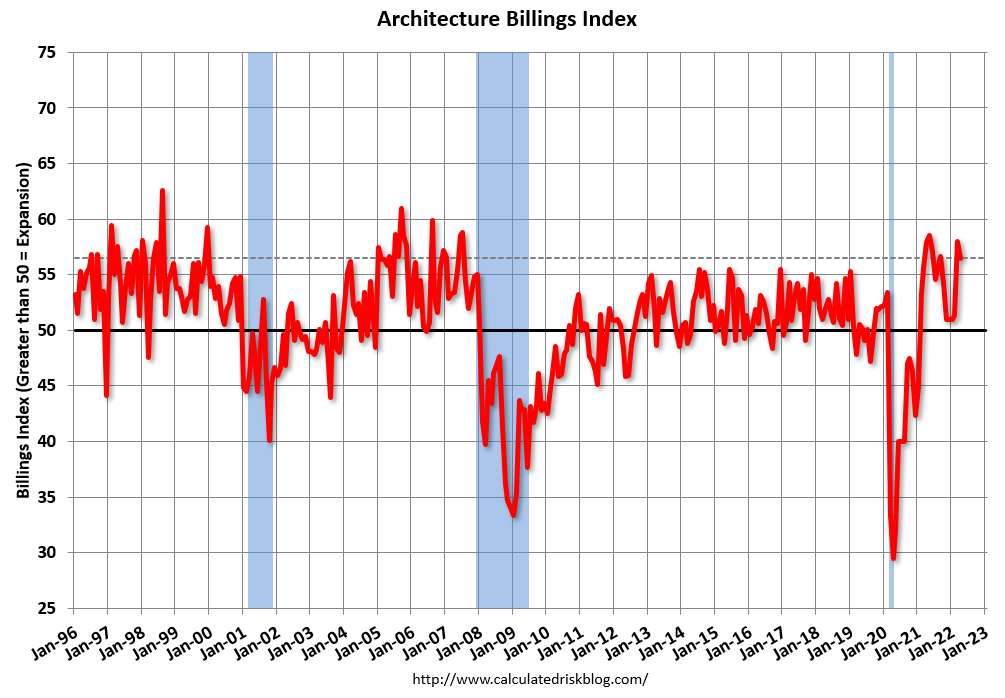
This graph shows the Architecture Billings Index since 1996. The index was at 56.5 in April, down from 58.0 in March. Anything above 50 indicates expansion in demand for architects' services.
Note: This includes commercial and industrial facilities like hotels and office buildings, multi-family residential, as well as schools, hospitals and other institutions.
This index has been positive for fifteen consecutive months. This index usually leads CRE investment by 9 to 12 months, so this index suggests a pickup in CRE investment in 2022.
April Housing Starts: All-Time Record Housing Units Under Construction
by Calculated Risk on 5/18/2022 09:09:00 AM
Today, in the CalculatedRisk Real Estate Newsletter: April Housing Starts: All-Time Record Housing Units Under Construction
Excerpt:
The fourth graph shows housing starts under construction, Seasonally Adjusted (SA).There is much more in the post. You can subscribe at https://calculatedrisk.substack.com/ (Most content is available for free, so please subscribe).
Red is single family units. Currently there are 815 thousand single family units under construction (SA). This is the highest level since November 2006.
For single family, many of these homes are already sold (Census counts sales when contract is signed). The reason there are so many homes is probably due to construction delays. Since many of these are already sold, it is unlikely this is “overbuilding”, or that this will significantly impact prices (although the buyers will be moving out of their current home or apartment once these homes are completed).
Blue is for 2+ units. Currently there are 826 thousand multi-family units under construction. This is the highest level since May 1974! For multi-family, construction delays are probably also a factor. The completion of these units should help with rent pressure.
Combined, there are a record 1.641 million units under construction. This eclipses the previous record of 1.628 million units that were under construction (mostly apartments in 1973 for the baby boom generation).

Housing Starts Decreased to 1.724 million Annual Rate in April
by Calculated Risk on 5/18/2022 08:39:00 AM
From the Census Bureau: Permits, Starts and Completions
Housing Starts:
Privately‐owned housing starts in April were at a seasonally adjusted annual rate of 1,724,000. This is 0.2 percent below the revised March estimate of 1,728,000, but is 14.6 percent above the April 2021 rate of 1,505,000. Single‐family housing starts in April were at a rate of 1,100,000; this is 7.3 percent below the revised March figure of 1,187,000. The April rate for units in buildings with five units or more was 612,000.
Building Permits:
Privately‐owned housing units authorized by building permits in April were at a seasonally adjusted annual rate of 1,819,000. This is 3.2 percent below the revised March rate of 1,879,000, but is 3.1 percent above the April 2021 rate of 1,765,000. Single‐ family authorizations in April were at a rate of 1,110,000; this is 4.6 percent below the revised March figure of 1,163,000. Authorizations of units in buildings with five units or more were at a rate of 656,000 in April.
emphasis added
 Click on graph for larger image.
The first graph shows single and multi-family housing starts for the last several years.
Multi-family starts (blue, 2+ units) increased in April compared to March. Multi-family starts were up 40.5% year-over-year in April.
Single-family starts (red) decreased in April and were up 3.7% year-over-year.
 The second graph shows single and multi-family housing starts since 1968.
 This shows the huge collapse following the housing bubble, and then the eventual recovery (but still not historically high).
Total housing starts in April were below expectations, and starts in February and March, were revised down, combined.
I'll have more later …
MBA: Mortgage Applications Decrease in Latest Weekly Survey
by Calculated Risk on 5/18/2022 07:00:00 AM
From the MBA: Mortgage Applications Decrease in Latest MBA Weekly Survey
Mortgage applications decreased 11.0 percent from one week earlier, according to data from the Mortgage Bankers Association’s (MBA) Weekly Mortgage Applications Survey for the week ending May 13, 2022.
... The Refinance Index decreased 10 percent from the previous week and was 76 percent lower than the same week one year ago. The seasonally adjusted Purchase Index decreased 12 percent from one week earlier. The unadjusted Purchase Index decreased 12 percent compared with the previous week and was 15 percent lower than the same week one year ago.
“Mortgage applications decreased for the first time in three weeks, as mortgage rates – despite declining last week – remained over two percentage points higher than a year ago and close to the highest levels since 2009. For borrowers looking to refinance, the current level of rates continues to be a significant disincentive,” said Joel Kan, MBA’s Associate Vice President of Economic and Industry Forecasting. “Purchase applications fell 12 percent last week, as prospective homebuyers have been put off by the higher rates and worsening affordability conditions. Furthermore, general uncertainty about the near-term economic outlook, as well as recent stock market volatility, may be causing some households to delay their home search.”
Added Kan, “These results were consistent with MBA’s May forecast released earlier this week, which now calls for fewer home sales and mortgage originations in 2022 compared to a year ago.”
...
The average contract interest rate for 30-year fixed-rate mortgages with conforming loan balances ($647,200 or less) decreased to 5.49 percent from 5.53 percent, with points increasing to 0.74 from 0.73 (including the origination fee) for 80 percent loan-to-value ratio (LTV) loans. The effective rate decreased from last week.
emphasis added
 Click on graph for larger image.
The first graph shows the refinance index since 1990.
With higher mortgage rates, the refinance index has declined sharply over the last several months.
The refinance index is at the lowest level since December 2018.
The second graph shows the MBA mortgage purchase index
 According to the MBA, purchase activity is down 15% year-over-year unadjusted.
Note: Red is a four-week average (blue is weekly).


