 RSS Feed
 by Calculated Risk on 5/23/2022 09:19:00 AM
Monday, May 23, 2022
Housing Inventory May 23rd Update: Inventory UP 8.2% Week-over-week
Altos reports inventory is up year-over-year!
Inventory usually declines in the winter, and then increases in the spring. Inventory bottomed seasonally at the beginning of March 2022 and is now up 43% since then.
 Click on graph for larger image in graph gallery.
This inventory graph is courtesy of Altos Research.
As of May 20th, inventory was at 344 thousand (7-day average), compared to 318 thousand the prior week. Inventory was up 8.2% from the previous week.
Inventory is still very low. Compared to the same week in 2021, inventory is up 6.4% from 324 thousand, however compared to the same week in 2020, and inventory is down 52.5% from 724 thousand. Compared to 3 years ago, inventory is down 63.3% from 938 thousand.
Inventory is still very low. Compared to the same week in 2021, inventory is up 6.4% from 324 thousand, however compared to the same week in 2020, and inventory is down 52.5% from 724 thousand. Compared to 3 years ago, inventory is down 63.3% from 938 thousand.
Here are the inventory milestones I’m watching for with the Altos data:
1. The seasonal bottom (happened on March 4th for Altos) ✅
2. Inventory up year-over-year (happened on May 13th for Altos) ✅
3. Inventory up compared to two years ago (currently down 52.5% according to Altos)
4. Inventory up compared to 2019 (currently down 63.3%).
1. The seasonal bottom (happened on March 4th for Altos) ✅
2. Inventory up year-over-year (happened on May 13th for Altos) ✅
3. Inventory up compared to two years ago (currently down 52.5% according to Altos)
4. Inventory up compared to 2019 (currently down 63.3%).

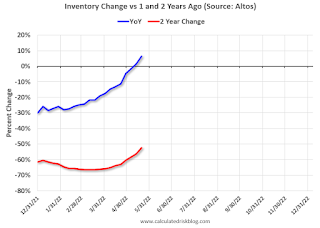
Here is a graph of the inventory change year-over-year and vs two years ago (milestone 3 above).
The blue line is the year-over-year data, and the red line is compared to two years ago.
Inventory is now up year-over-year. Two years ago (in 2020) inventory was declining all year, so the two-year comparison will get easier all year.
Mike Simonsen discusses this data regularly on Youtube.
Four High Frequency Indicators for the Economy
by Calculated Risk on 5/23/2022 08:49:00 AM
These indicators are mostly for travel and entertainment. It is interesting to watch these sectors recover as the pandemic subsides. Note: Apple has discontinued "Apple mobility", and restaurant traffic is mostly back to normal.
The TSA is providing daily travel numbers.
This data is as of May 22nd.
 Click on graph for larger image.
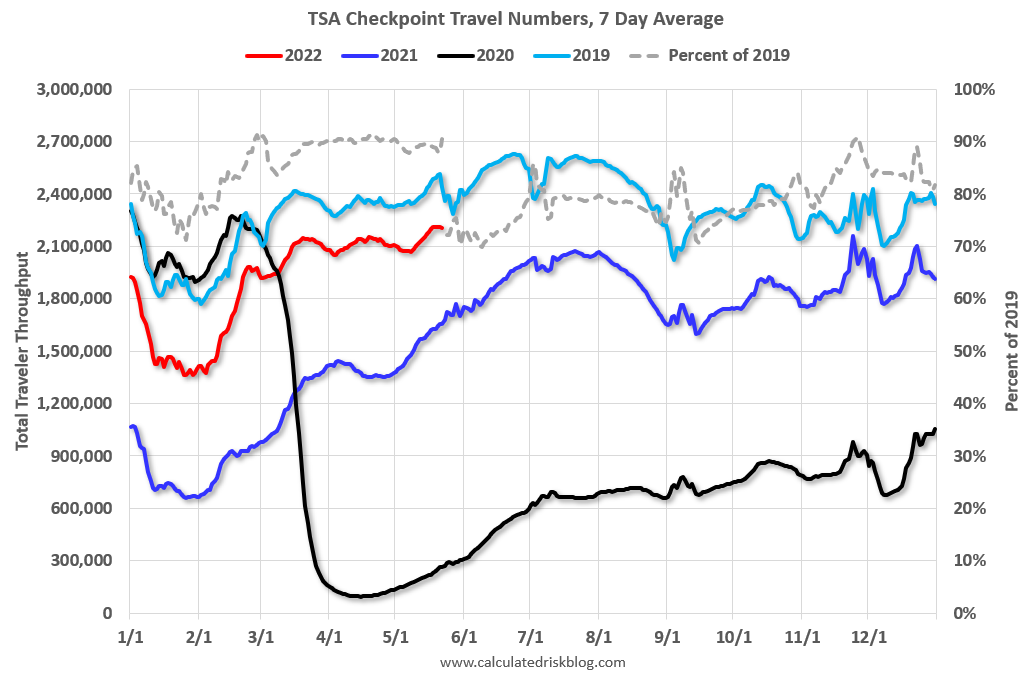
This data shows the 7-day average of daily total traveler throughput from the TSA for 2019 (Light Blue), 2020 (Black), 2021 (Blue) and 2022 (Red).
The dashed line is the percent of 2019 for the seven-day average.
The 7-day average is down 9.5% from the same day in 2019 90.5% of 2019). (Dashed line)
Air travel has been moving sideways over the last two months, off about 10% from 2019.
 This data shows domestic box office for each week and the median for the years 2016 through 2019 (dashed light blue).
 Black is 2020, Blue is 2021 and Red is 2022.
The data is from BoxOfficeMojo through May 19th.
Note that the data is usually noisy week-to-week and depends on when blockbusters are released.
Movie ticket sales were at $120 million last week, down about 40% from the median for the week.
Note that the data is usually noisy week-to-week and depends on when blockbusters are released.
Movie ticket sales were at $120 million last week, down about 40% from the median for the week.
 This graph shows the seasonal pattern for the hotel occupancy rate using the four-week average.
 The red line is for 2022, black is 2020, blue is the median, and dashed light blue is for 2021. Dashed purple is 2019 (STR is comparing to a strong year for hotels).
This data is through May 14th. The occupancy rate was down 5.9% compared to the same week in 2019.
The 4-week average of the occupancy rate is at the median rate for the previous 20 years (Blue).
Notes: Y-axis doesn't start at zero to better show the seasonal change.
Notes: Y-axis doesn't start at zero to better show the seasonal change.
The 4-week average of the occupancy rate will now mostly move sideways seasonally until the summer.
Here is some interesting data on New York subway usage (HT BR).
 This graph is from Todd W Schneider.
 This graph shows how much MTA traffic has recovered in each borough (Graph starts at first week in January 2020 and 100 = 2019 average).
Manhattan is at about 39% of normal.
This data is through Friday, May 20th.
He notes: "Data updates weekly from the MTA’s public turnstile data, usually on Saturday mornings".
Sunday, May 22, 2022
Sunday Night Futures
by Calculated Risk on 5/22/2022 07:26:00 PM
Weekend:
• Schedule for Week of May 22, 2022
• Quarterly Starts by Purpose and Design: "Built for rent" Increasing
Monday:
• At 8:30 AM ET, Chicago Fed National Activity Index for April. This is a composite index of other data.
From CNBC: Pre-Market Data and Bloomberg futures S&P 500 are up 33 and DOW futures are up 200 (fair value).
Oil prices were down over the last week with WTI futures at $110.28 per barrel and Brent at $112.55 per barrel. A year ago, WTI was at $66 and Brent was at $69 - so WTI oil prices are up about 70% year-over-year.
Here is a graph from Gasbuddy.com for nationwide gasoline prices. Nationally prices are at $4.58 per gallon. A year ago prices were at $3.02 per gallon, so gasoline prices are up $1.56 per gallon year-over-year.
Quarterly Starts by Purpose and Design: "Built for rent" Increasing
by Calculated Risk on 5/22/2022 11:48:00 AM
Along with the monthly housing starts for April last week, the Census Bureau released Housing Units Started by Purpose and Design through Q1 2022.
This graph shows the NSA quarterly intent for four start categories since 1975: single family built for sale, owner built (includes contractor built for owner), starts built for rent, and condos built for sale.
 Click on graph for larger image.
Single family starts built for sale (red) were down 2% in Q1 2022 compared to Q1 2021.
Owner built starts (orange) were up 28% year-over-year.
Condos built for sale increased and are still low.
The 'units built for rent' (blue) and were up 19% in Q1 2022 compared to Q1 2021.
The recent housing boom had been mostly in single family homes 'built for sale', but 'built for rent' has picked up.
Saturday, May 21, 2022
Real Estate Newsletter Articles this Week
by Calculated Risk on 5/21/2022 02:11:00 PM
At the Calculated Risk Real Estate Newsletter this week:
• Lawler: The Sharp increase in Monthly Payments in Selected Metro Areas
• NAR: Existing-Home Sales Decreased to 5.61 million SAAR in April
• April Housing Starts: All-Time Record Housing Units Under Construction
• 3rd Look at Local Housing Markets
• A Slowdown in Showings
• Lawler: Mortgage/Treasury Spreads Part II: “Decomposing” the Widening This Year
This is usually published 4 to 6 times a week and provides more in-depth analysis of the housing market.
You can subscribe at https://calculatedrisk.substack.com/
Most content is available for free (and no Ads), but please subscribe!
Schedule for Week of May 22, 2022
by Calculated Risk on 5/21/2022 08:11:00 AM
The key reports this week are the second estimate of Q1 GDP, April New Home Sales, and Personal Income and Outlays for April.
For manufacturing, the May Richmond and Kansas City Fed manufacturing surveys will be released.
Note: The Census Bureau is expected to release "National, State, and County housing units" from the 2020 Census sometime in May.
8:30 AM ET: Chicago Fed National Activity Index for April. This is a composite index of other data.
 10:00 AM: New Home Sales for April from the Census Bureau.
 This graph shows New Home Sales since 1963. The dashed line is the sales rate for last month.
The consensus is for 750 thousand SAAR, down from 763 thousand SAAR in March.
10:00 AM: Richmond Fed Survey of Manufacturing Activity for May.
7:00 AM ET: The Mortgage Bankers Association (MBA) will release the results for the mortgage purchase applications index.
8:30 AM: Durable Goods Orders for April from the Census Bureau. The consensus is for a 0.6% increase in durable goods orders.
2:00 PM: FOMC Minutes, Minutes Meeting of May 3-4, 2022
8:30 AM: The initial weekly unemployment claims report will be released. The consensus is for 220 thousand up from 218 thousand last week.
8:30 AM: Gross Domestic Product, 1st quarter 2021 (Second estimate). The consensus is that real GDP decreased 1.3% annualized in Q1, up from the advance estimate of -1.4%.
10:00 AM: Pending Home Sales Index for April. The consensus is for a 1.9% decrease in the index.
11:00 AM: the Kansas City Fed manufacturing survey for May.
8:30 AM ET: Personal Income and Outlays, April 2021. The consensus is for a 0.6% increase in personal income, and for a 0.7% increase in personal spending. And for the Core PCE price index to increase 0.3%. PCE prices are expected to be up 6.3% YoY, and core PCE prices up 4.9% YoY.
10:00 AM: University of Michigan's Consumer sentiment index (Final for May). The consensus is for a reading of 59.1.
Friday, May 20, 2022
Q2 GDP Forecasts: 2.5% to 3.0%
by Calculated Risk on 5/20/2022 01:21:00 PM
From BofA:
We have revised down our GDP forecast for 2022 and 2023 to 2.6% and 1.5% from 2.7% and 1.8% previously. [Q2 3.0% revised down from 3.5%] [May 20 estimate]From Goldman:
emphasis added
we left our Q2 GDP tracking estimate unchanged at +2.6% (qoq ar) and our past-quarter GDP tracking estimate for Q1 unchanged at -1.5%. [May 19 estimate]And from the Altanta Fed: GDPNow
The GDPNow model estimate for real GDP growth (seasonally adjusted annual rate) in the second quarter of 2022 is 2.4 percent on May 18, down from 2.5 percent on May 17. [May 18 estimate]
Lawler: The Sharp increase in Monthly Payments in Selected Metro Areas
by Calculated Risk on 5/20/2022 10:31:00 AM
Today, in the CalculatedRisk Real Estate Newsletter: Lawler: The Sharp increase in Monthly Payments in Selected Metro Areas
Excerpt:
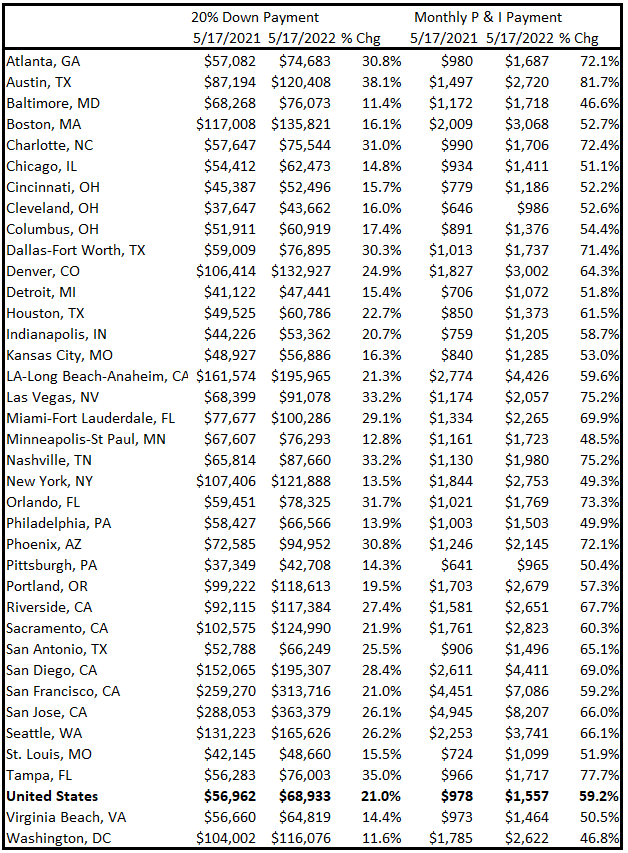
According to Mortgage News Daily, the interest rate on a 30-year fixed-rate mortgage for a prime borrower putting 20% down increased to 5.45% earlier this week from 3.14% a year ago. Such an increase would result in a 31.6% jump in the monthly principal and interest (P&I) payment on a mortgage with a fixed dollar amount. However, the increase in the monthly P&I payment for a typical home bought today compared to a year ago would be massively higher than 31.6%, as home prices nationally are up by over 20% from a year earlier, and by much more in many markets. In addition, that means a 20% down payment has risen sharply as well.There is much more in the post. You can subscribe at https://calculatedrisk.substack.com/ (Most content is available for free, so please subscribe).
Below is a table showing the year-over-year increase in a 20% down payment and the P&I payment for a 30-year FRM for the US and for several metro areas on a “typical” single-family home. ...
Click on table for larger image.
...
It is not the absolute mortgage rate, rather the change in monthly payments that is causing the slowdown in the housing market.
Black Knight: "Mortgage Delinquencies Hit Yet Another Record Low in April"
by Calculated Risk on 5/20/2022 08:00:00 AM
From Black Knight: Black Knight’s First Look: Mortgage Delinquencies Hit Yet Another Record Low in April, Driven by Continued Improvement Among Seriously Past-Due Loans
• The national delinquency rate fell to 2.80% in April, down four basis points from March, hitting a new record low for the second consecutive monthAccording to Black Knight's First Look report, the percent of loans delinquent decreased 1.3% in April compared to March and decreased 40% year-over-year.
• Overall delinquencies are down nearly 40% from last year as the mortgage market continues to recover from pandemic-related impacts
• The number of borrowers who are a single payment past due increased 7.9% month-over-month, following typical seasonal patterns
• This was offset by strong improvement among borrowers who are three or more payments past due – with volumes falling by 8% month-over-month
• Though such serious delinquencies have fallen between 6%-12% in each of the past 14 months, volumes remain more than 55% above pre-pandemic levels
• Despite still-elevated serious delinquency levels, foreclosure starts dropped nearly 12% from March and are holding well below pre-pandemic levels – though active foreclosures edged slightly higher
• Prepayment activity fell by 19.1% from March and 61.8% from a year ago as interest rates continued their sharp ascent in April
emphasis added
The percent of loans in the foreclosure process increased 2.3% in April and were up 13.5% over the last year. (First year-over-year increase in almost 10 years - but from very low levels)
Black Knight reported the U.S. mortgage delinquency rate (loans 30 or more days past due, but not in foreclosure) was 2.80% in April, down from 2.84% in March.
The percent of loans in the foreclosure process increased in April to 0.32%, from 0.32% in March.
The number of delinquent properties, but not in foreclosure, is down 1,004,000 properties year-over-year, and the number of properties in the foreclosure process is up 20,000 properties year-over-year.
| Black Knight: Percent Loans Delinquent and in Foreclosure Process | ||||
|---|---|---|---|---|
| Apr 2022 | Mar 2022 | Apr 2021 | Apr 2020 | |
| Delinquent | 2.80% | 2.84% | 4.66% | 6.45% |
| In Foreclosure | 0.32% | 0.32% | 0.29% | 0.40% |
| Number of properties: | ||||
| Number of properties that are delinquent, but not in foreclosure: | 1,496,000 | 1,513,000 | 2,500,000 | 3,400,000 |
| Number of properties in foreclosure pre-sale inventory: | 173,000 | 169,000 | 153,000 | 211,000 |
| Total Properties | 1,669,000 | 1,682,000 | 2,653,000 | 3,611,000 |
Thursday, May 19, 2022
Realtor.com Reports Weekly Inventory Up 5% Year-over-year
by Calculated Risk on 5/19/2022 02:58:00 PM
Realtor.com has monthly and weekly data on the existing home market. Here is their weekly report released this morning from Chief Economist Danielle Hale: Weekly Housing Trends View — Data Week Ending May 14, 2022. Note: They have data on list prices, new listings and more, but this focus is on inventory.
• Active inventory moved convincingly into positive territory for the first time since 2019. While last week’s positive inventory improvement rounded to 0%, this week’s data built on that trend in a notable way, leading to the biggest year over year gain since March 2019. Our April Housing Trends Report showed that the active listings count remained 60 percent below its level right at the onset of the pandemic. This means that today’s buyers have just 2 homes to consider for every 5 homes that were available for sale just before the pandemic. In other words, homes for sale are still limited. However, more sellers combined with a slowing level of sales activity is causing a relatively rapid transition in conditions.
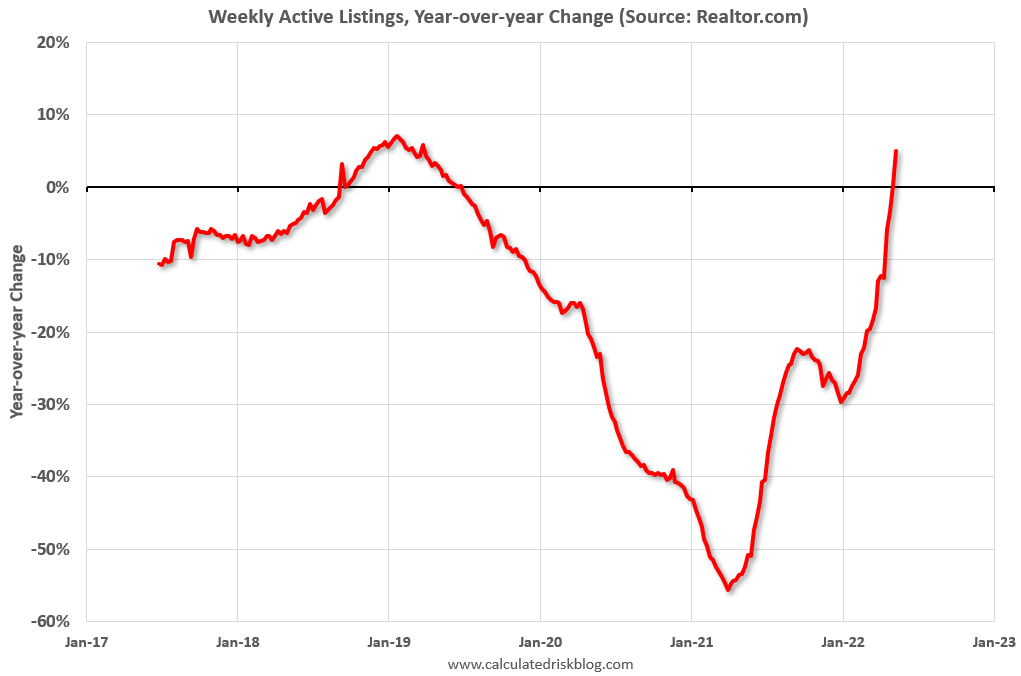 Here is a graph of the year-over-year change in inventory according to realtor.com. Note: I corrected a sign error in the data for Feb 26, 2022.
Note the rapid increase in the YoY change, from down 30% at the beginning of the year, to up 5% YoY now. It will be important to watch if that trend continues.
The previous week, inventory was unchanged YoY according to Realtor.com. That is close to the 1.5% increase that Altos reported for the similar period. I expect Altos to report a stronger year-over-year increase in inventory on Monday.


