 RSS Feed
 by Calculated Risk on 5/31/2022 04:11:00 PM
Tuesday, May 31, 2022
Fannie Mae: Mortgage Serious Delinquency Rate Decreased in April
Fannie Mae reported that the Single-Family Serious Delinquency decreased to 0.94% in April from 1.01% in March. The serious delinquency rate is down from 2.38% in April 2021. This is almost back to pre-pandemic levels.
These are mortgage loans that are "three monthly payments or more past due or in foreclosure".
The Fannie Mae serious delinquency rate peaked in February 2010 at 5.59% following the housing bubble and peaked at 3.32% in August 2020 during the pandemic.
 Click on graph for larger image
By vintage, for loans made in 2004 or earlier (1% of portfolio), 2.98% are seriously delinquent (down from 3.12% in March).
For loans made in 2005 through 2008 (1% of portfolio), 4.88% are seriously delinquent (down from 5.14%),
For recent loans, originated in 2009 through 2021 (97% of portfolio), 0.74% are seriously delinquent (down from 0.81%). So, Fannie is still working through a handful of poor performing loans from the bubble years.
Mortgages in forbearance are counted as delinquent in this monthly report, but they will not be reported to the credit bureaus.
The pandemic related increase in delinquencies was very different from the increase in delinquencies following the housing bubble. Lending standards had been fairly solid over the previous decade, and most of these homeowners had equity in their homes - and the vast majority of these homeowners have been able to restructure their loans once they were employed.
Freddie Mac reported earlier.
Update: Framing Lumber Prices Down 50% Year-over-year; Still up Sharply from Pre-pandemic Levels
by Calculated Risk on 5/31/2022 01:17:00 PM
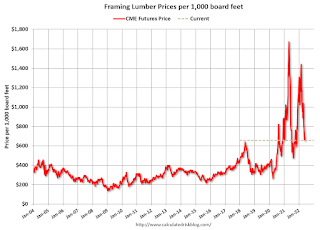
Here is another monthly update on framing lumber prices.
This graph shows CME random length framing futures through May 31st.
Lumber was at $656 per 1000 board feet this morning.
This is down from the peak of $1,733, and down 50% from $1,284 a year ago.
Prices are still up sharply from the pre-pandemic levels of around $400.
 Click on graph for larger image.
The slowdown in housing - and some supply improvement - has pushed down prices.
Prices are still up sharply from the pre-pandemic levels of around $400.
 Click on graph for larger image.
There is somewhat of a seasonal demand for lumber, and lumber prices usually peak in April or May (although it seems likely lumber prices peaked earlier this year).
The slowdown in housing - and some supply improvement - has pushed down prices.
Comments on March Case-Shiller and FHFA House Price Increases; New Record Monthly Increase
by Calculated Risk on 5/31/2022 09:40:00 AM
Today, in the Calculated Risk Real Estate Newsletter: Case-Shiller National Index up 20.6% Year-over-year in March; New Record Monthly Increase
Excerpt:
This graph below shows existing home months-of-supply (inverted, from the NAR) vs. the seasonally adjusted month-to-month price change in the Case-Shiller National Index (both since January 1999 through March 2022).
Note that the months-of-supply is not seasonally adjusted.
There is a clear relationship, and this is no surprise (but interesting to graph). If months-of-supply is high, prices decline. If months-of-supply is very low (like now), prices rise quickly.
In March, the months-of-supply was at 1.9 months, and the Case-Shiller National Index (SA) increased 2.09% month-over-month. The black arrow points to the March 2022 dot. In the April existing home sales report, the NAR reported months-of-supply increased to 2.2 months.
This month was very likely the peak YoY growth rate - just above the peak last August. Since inventory is now increasing year-over-year (but still low), we should expect price increases to slow.
The normal level of inventory is probably in the 4 to 6 months range, and we will have to see a significant increase in inventory to sharply slow price increases, and that is why I’m focused on inventory!
Since Case-Shiller is a 3-month average, and this report was for March (includes January and February), this included price increases when mortgage rates were significantly lower than today. In January, the Freddie Mac PMMS averaged 3.4% for a 30-year mortgage, and 3.8% in February. Currently mortgage rates are around 5.25%.emphasis added

There is much more in the article. You can subscribe at https://calculatedrisk.substack.com/
Case-Shiller: National House Price Index increased 20.6% year-over-year in March
by Calculated Risk on 5/31/2022 09:11:00 AM
S&P/Case-Shiller released the monthly Home Price Indices for March ("March" is a 3-month average of January, February and March prices).
This release includes prices for 20 individual cities, two composite indices (for 10 cities and 20 cities) and the monthly National index.
From S&P: S&P Corelogic Case-Shiller Index Reports Annual Home Price Gain Of 20.6% In March
The S&P CoreLogic Case-Shiller U.S. National Home Price NSA Index, covering all nine U.S. census divisions, reported a 20.6% annual gain in March, up from 20.0% in the previous month. The 10-City Composite annual increase came in at 19.5%, up from 18.7% in the previous month. The 20-City Composite posted a 21.2% year-over-year gain, up from 20.3% in the previous month.
Tampa, Phoenix, and Miami reported the highest year-over-year gains among the 20 cities in March. Tampa led the way with a 34.8% year-over-year price increase, followed by Phoenix with a 32.4% increase, and Miami with a 32.0% increase. Seventeen of the 20 cities reported higher price increases in the year ending March 2022 versus the year ending February 2022.
...
Before seasonal adjustment, the U.S. National Index posted a 2.6% month-over-month increase in March, while the 10-City and 20-City Composites posted increases of 2.8% and 3.1%, respectively
After seasonal adjustment, the U.S. National Index posted a month-over-month increase of 2.1%, and the 10-City and 20-City Composites posted increases of 2.2% and 2.4%, respectively.
In March, all 20 cities reported increases before and after seasonal adjustments.
“Those of us who have been anticipating a deceleration in the growth rate of U.S. home prices will have to wait at least a month longer,” says Craig J. Lazzara, Managing Director at S&P DJI. “The National Composite Index recorded a gain of 20.6% for the 12 months ended March 2022; the 10- and 20-City Composites rose 19.5% and 21.2%, respectively. For both National and 20-City Composites, March’s reading was the highest year-over-year price change in more than 35 years of data, with the 10-City growth rate at the 99th percentile of its own history.
“The strength of the Composite indices suggests very broad strength in the housing market, which we continue to observe. All 20 cities saw double-digit price increases for the 12 months ended in March, and price growth in 17 cities accelerated relative to February’s report. March’s price increase ranked in the top quintile of historical experience for every city, and in the top decile for 19 of them.
emphasis added
 Click on graph for larger image.
 The first graph shows the nominal seasonally adjusted Composite 10, Composite 20 and National indices (the Composite 20 was started in January 2000).
The Composite 10 index is up 2.2% in March (SA).
The Composite 20 index is up 2.4% (SA) in March.
The National index is 60% above the bubble peak (SA), and up 2.1% (SA) in March. The National index is up 117% from the post-bubble low set in February 2012 (SA).
 The second graph shows the year-over-year change in all three indices.
The Composite 10 SA is up 19.5% year-over-year. The Composite 20 SA is up 21.2% year-over-year.
The National index SA is up 20.6% year-over-year.
Price increases were above expectations. I'll have more later.
Monday, May 30, 2022
Tuesday: Case-Shiller House Prices, Chicago PMI, Dallas Fed Mfg
by Calculated Risk on 5/30/2022 09:03:00 PM
Weekend:
• Schedule for Week of May 29, 2022
Tuesday:
• At 9:00 AM ET, S&P/Case-Shiller House Price Index for March. The consensus is for a 20.0% year-over-year increase in the Comp 20 index for March.
• Also at 9:00 AM, FHFA House Price Index for March 2022. This was originally a GSE only repeat sales, however there is also an expanded index.
• At 9:45 AM, Chicago Purchasing Managers Index for May.
• At 10:00 AM, Dallas Fed Survey of Manufacturing Activity for May.
From CNBC: Pre-Market Data and Bloomberg futures S&P 500 are up 9 and DOW futures are up 12 (fair value).
Oil prices were up over the last week with WTI futures at $116.53 per barrel and Brent at $121.15 per barrel. A year ago, WTI was at $66 and Brent was at $69 - so WTI oil prices are up 75% year-over-year.
Here is a graph from Gasbuddy.com for nationwide gasoline prices. Nationally prices are at $4.59 per gallon. A year ago prices were at $3.04 per gallon, so gasoline prices are up $1.55 per gallon year-over-year.
Lawler: Large Builders Acquired Lots of Lots over the Last Year
by Calculated Risk on 5/30/2022 12:42:00 PM
Today, in the Calculated Risk Real Estate Newsletter: Lawler: Large Builders Acquired Lots of Lots over the Last Year
A brief excerpt:
Over the last year some of the nation’s largest home builders acquired an enormous number of lots – either owned outright or “controlled” via land purchase option or other contracts – over the last year in anticipation of a continuation of a strong and perhaps even over-heated economy. Here are the number of lots owned or “controlled” for the three largest home builders.There is more in the article. You can subscribe at https://calculatedrisk.substack.com/
...Obviously, the land/lot acquisition strategy of these (and other) builders over the last 15 months reflected an assumption that the exceptionally strong (frothy?) housing market over that period would continue throughout this year. If, in fact, housing demand slows considerably this year, then there could be some serious weakness in the land/lot markets.

Housing Inventory May 30th Update: Inventory UP 5.7% Week-over-week
by Calculated Risk on 5/30/2022 10:06:00 AM
Altos reports inventory is up 11.4% year-over-year.
Inventory usually declines in the winter, and then increases in the spring. Inventory bottomed seasonally at the beginning of March 2022 and is now up 51% since then.
 Click on graph for larger image in graph gallery.
This inventory graph is courtesy of Altos Research.
As of May 27th, inventory was at 364 thousand (7-day average), compared to 344 thousand the prior week. Inventory was up 5.7% from the previous week.
Inventory is still very low. Compared to the same week in 2021, inventory is up 11.4% from 327 thousand, however compared to the same week in 2020 inventory is down 49.4% from 719 thousand. Compared to 3 years ago, inventory is down 61.6% from 948 thousand.
Inventory is still very low. Compared to the same week in 2021, inventory is up 11.4% from 327 thousand, however compared to the same week in 2020 inventory is down 49.4% from 719 thousand. Compared to 3 years ago, inventory is down 61.6% from 948 thousand.
Here are the inventory milestones I’m watching for with the Altos data:
1. The seasonal bottom (happened on March 4th for Altos) ✅
2. Inventory up year-over-year (happened on May 13th for Altos) ✅
3. Inventory up compared to two years ago (currently down 49.4% according to Altos)
4. Inventory up compared to 2019 (currently down 61.6%).
1. The seasonal bottom (happened on March 4th for Altos) ✅
2. Inventory up year-over-year (happened on May 13th for Altos) ✅
3. Inventory up compared to two years ago (currently down 49.4% according to Altos)
4. Inventory up compared to 2019 (currently down 61.6%).

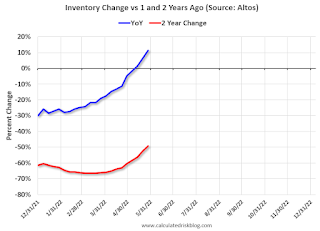
Here is a graph of the inventory change year-over-year and vs two years ago (milestone 3 above).
The blue line is the year-over-year data, and the red line is compared to two years ago.
Two years ago (in 2020) inventory was declining all year, so the two-year comparison will get easier all year.
Mike Simonsen discusses this data regularly on Youtube.
Four High Frequency Indicators for the Economy
by Calculated Risk on 5/30/2022 08:40:00 AM
These indicators are mostly for travel and entertainment. It is interesting to watch these sectors recover as the pandemic subsides. Note: Apple has discontinued "Apple mobility", and restaurant traffic is mostly back to normal.
The TSA is providing daily travel numbers.
This data is as of May 29th.
 Click on graph for larger image.
This data shows the 7-day average of daily total traveler throughput from the TSA for 2019 (Light Blue), 2020 (Black), 2021 (Blue) and 2022 (Red).
The dashed line is the percent of 2019 for the seven-day average.
The 7-day average is down 9.5% from the same day in 2019 90.5% of 2019). (Dashed line)
Air travel has been moving sideways over the last three months, off about 10% from 2019.
 This data shows domestic box office for each week and the median for the years 2016 through 2019 (dashed light blue).
 Black is 2020, Blue is 2021 and Red is 2022.
The data is from BoxOfficeMojo through May 26th.
Note that the data is usually noisy week-to-week and depends on when blockbusters are released.
Movie ticket sales were at $98 million last week, down about 48% from the median for the week.
Note that the data is usually noisy week-to-week and depends on when blockbusters are released.
Movie ticket sales were at $98 million last week, down about 48% from the median for the week.
 This graph shows the seasonal pattern for the hotel occupancy rate using the four-week average.
 The red line is for 2022, black is 2020, blue is the median, and dashed light blue is for 2021. Dashed purple is 2019 (STR is comparing to a strong year for hotels).
This data is through May 21st. The occupancy rate was down 3.5% compared to the same week in 2019.
The 4-week average of the occupancy rate is at the median rate for the previous 20 years (Blue).
Notes: Y-axis doesn't start at zero to better show the seasonal change.
Notes: Y-axis doesn't start at zero to better show the seasonal change.
The 4-week average of the occupancy rate will now mostly move sideways seasonally until the summer travel season.
Here is some interesting data on New York subway usage (HT BR).
 This graph is from Todd W Schneider.
 This graph shows how much MTA traffic has recovered in each borough (Graph starts at first week in January 2020 and 100 = 2019 average).
Manhattan is at about 39% of normal.
This data is through Friday, May 27th.
He notes: "Data updates weekly from the MTA’s public turnstile data, usually on Saturday mornings".
Sunday, May 29, 2022
Energy expenditures as a percentage of PCE
by Calculated Risk on 5/29/2022 02:14:00 PM
During the early stages of the pandemic, energy expenditures as a percentage of PCE hit an all-time low of 3.3% of PCE. Then energy expenditures increased to 2018 levels by the end of last year.
With the invasion of Ukraine, energy expenditures as a percentage of PCE increased further over the last few months.
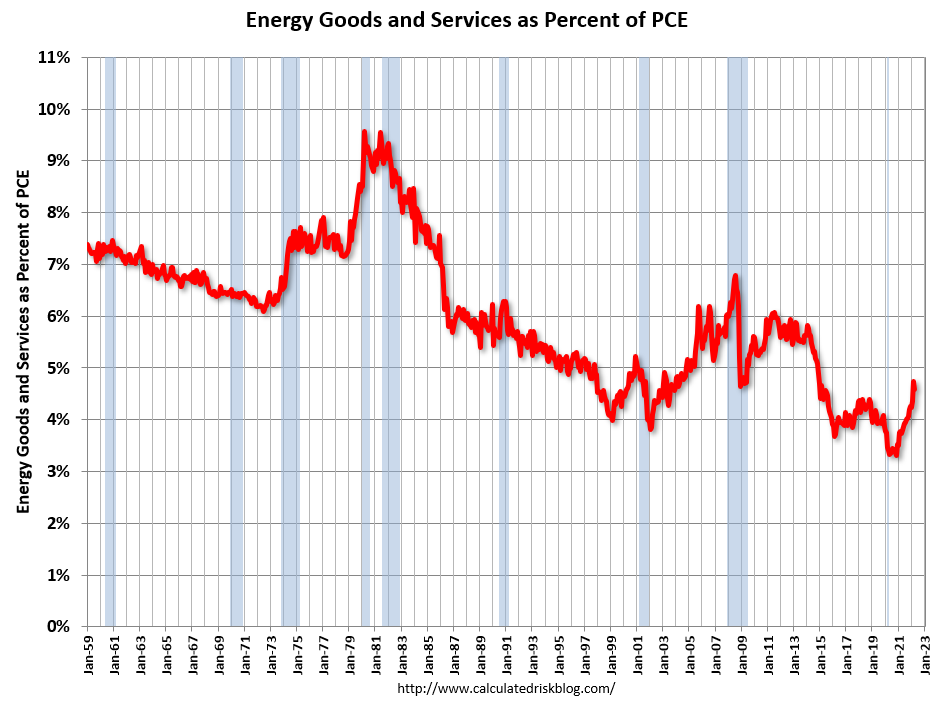
Here is an update through the April 2022 PCE report.
This graph shows expenditures on energy goods and services as a percent of total personal consumption expenditures. This is one of the measures that Professor Hamilton at Econbrowser looks at to evaluate any drag on GDP from energy prices.

Click on graph for larger image.
Data source: BEA.
In general, energy expenditures as a percent of PCE has been trending down for decades. The huge spikes in energy prices during the oil crisis of 1973 and 1979 are obvious. As is the increase in energy prices during the 2001 through 2008 period.
This graph shows expenditures on energy goods and services as a percent of total personal consumption expenditures. This is one of the measures that Professor Hamilton at Econbrowser looks at to evaluate any drag on GDP from energy prices.
Click on graph for larger image.
Data source: BEA.
In general, energy expenditures as a percent of PCE has been trending down for decades. The huge spikes in energy prices during the oil crisis of 1973 and 1979 are obvious. As is the increase in energy prices during the 2001 through 2008 period.
In April 2022, energy expenditures as a percentage of PCE were at 4.6% of PCE, down slightly from the March level.
This is above the pre-pandemic level, but excluding March, this was the highest level since 2014.
Note: Professor Hamilton discusses the recent increase in energy prices here, and here is his slide deck: Sanctions, Oil Prices, and Recession. Hamilton's conclusion "oil price increase so far not enough to cause a recession"
Saturday, May 28, 2022
Real Estate Newsletter Articles this Week
by Calculated Risk on 5/28/2022 02:11:00 PM
At the Calculated Risk Real Estate Newsletter this week:
• The Household Mystery: Part II
• April New Home Sales Decline Sharply, almost 6 Months of Inventory Under Construction
• Final Look at Local Housing Markets in April
• Update: Delinquencies, Foreclosures and REO
• Realtor.com Reports Weekly Inventory Up 9% Year-over-year
This is usually published 4 to 6 times a week and provides more in-depth analysis of the housing market.
You can subscribe at https://calculatedrisk.substack.com/
Most content is available for free (and no Ads), but please subscribe!


