by Calculated Risk on 6/02/2022 09:11:00 AM
Thursday, June 02, 2022
Rent Increases Up Sharply Year-over-year, Pace is slowing
Today, in the Calculated Risk Real Estate Newsletter: Rent Increases Up Sharply Year-over-year, Pace is slowing
A brief excerpt:
Here is a graph of the year-over-year (YoY) change for these measures since January 2015. All of these measures are through April 2022 (Apartment List through May 2022).There is much more in the article. You can subscribe at https://calculatedrisk.substack.com/
Note that new lease measures (Zillow, Apartment List) dipped early in the pandemic, whereas the BLS measures were steady. Then new leases took off, and the BLS measures are picking up.
...
The Zillow measure is up 16.4% YoY in April, down from 17.0% YoY in March. This is down from a peak of 17.2% YoY in February.
The ApartmentList measure is up 15.3% YoY as of May, down from 16.4% in April. This is down from the peak of 17.9% YoY last November.
Clearly rents are still increasing, and we should expect this to continue to spill over into measures of inflation in 2022. The Owners’ Equivalent Rent (OER) was up 4.8% YoY in April, from 4.5% YoY in March - and will likely increase further in the coming months.
My suspicion is rent increases will slow over the coming months as the pace of household formation slows, and more supply comes on the market.
Weekly Initial Unemployment Claims Decrease to 200,000
by Calculated Risk on 6/02/2022 08:34:00 AM
The DOL reported:
In the week ending May 28, the advance figure for seasonally adjusted initial claims was 200,000, a decrease of 11,000 from the previous week's revised level. The previous week's level was revised up by 1,000 from 210,000 to 211,000. The 4-week moving average was 206,500, a decrease of 500 from the previous week's revised average. The previous week's average was revised up by 250 from 206,750 to 207,000.The following graph shows the 4-week moving average of weekly claims since 1971.
emphasis added
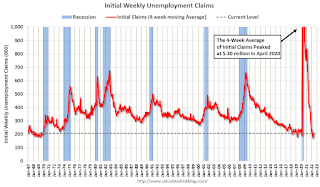 Click on graph for larger image.
The dashed line on the graph is the current 4-week average. The four-week average of weekly unemployment claims decreased to 206,500.
The previous week was revised up.
Weekly claims were lower than the consensus forecast.
ADP: Private Employment Increased 128,000 in May
by Calculated Risk on 6/02/2022 08:19:00 AM
Private sector employment increased by 128,000 jobs from April to May according to the May ADP® National Employment ReportTM. Broadly distributed to the public each month, free of charge, the ADP National Employment Report is produced by the ADP Research Institute® in collaboration with Moody’s Analytics. The report, which is derived from ADP’s actual data of those who are on a company’s payroll, measures the change in total nonfarm private employment each month on a seasonally-adjusted basisThis was below the consensus forecast of 280,000 for this report.
“Under a backdrop of a tight labor market and elevated inflation, monthly job gains are closer to pre-pandemic levels,” said Nela Richardson, chief economist, ADP. “The job growth rate of hiring has tempered across all industries, while small businesses remain a source of concern as they struggle to keep up with larger firms that have been booming as of late.”
emphasis added
The BLS report will be released Friday, and the consensus is for 320 thousand non-farm payroll jobs added in April. The ADP report has not been very useful in predicting the BLS report, but this suggests a weaker than expected BLS report.
Wednesday, June 01, 2022
Thursday: ADP Employment, Unemployment Claims
by Calculated Risk on 6/01/2022 09:14:00 PM
Thursday:
• At 8:15 AM ET, The ADP Employment Report for May. This report is for private payrolls only (no government). The consensus is for 280,000 payroll jobs added in May, up from 247,000 in April.
• At 8:30 AM, The initial weekly unemployment claims report will be released. The consensus is for 210 thousand unchanged from 210 thousand last week.
On COVID (focus on hospitalizations and deaths):
| COVID Metrics | ||||
|---|---|---|---|---|
| Now | Week Ago | Goal | ||
| Percent fully Vaccinated | 66.7% | --- | ≥70.0%1 | |
| Fully Vaccinated (millions) | 221.4 | --- | ≥2321 | |
| New Cases per Day3 | 103,686 | 108,692 | ≤5,0002 | |
| Hospitalized3🚩 | 20.984 | 20.011 | ≤3,0002 | |
| Deaths per Day3 | 264 | 303 | ≤502 | |
| 1 Minimum to achieve "herd immunity" (estimated between 70% and 85%). 2my goals to stop daily posts, 37-day average for Cases, Currently Hospitalized, and Deaths 🚩 Increasing 7-day average week-over-week for Cases, Hospitalized, and Deaths ✅ Goal met. | ||||
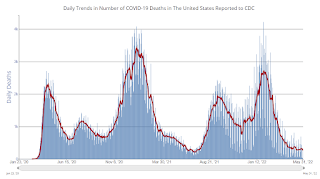 Click on graph for larger image.
This graph shows the daily (columns) and 7-day average (line) of deaths reported.
Vehicles Sales Decreased to 12.68 million SAAR in May
by Calculated Risk on 6/01/2022 05:28:00 PM
Wards Auto released their estimate of light vehicle sales for May. Wards Auto estimates sales of 12.68 million SAAR in May 2022 (Seasonally Adjusted Annual Rate), down 11.2% from the April sales rate, and down 24.9% from May 2021.
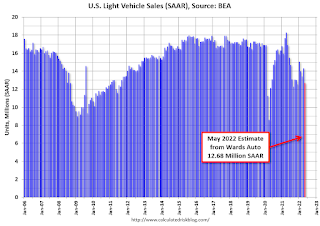 Click on graph for larger image.
This graph shows light vehicle sales since 2006 from the BEA (blue) and Wards Auto's estimate for May (red).
The impact of COVID-19 was significant, and April 2020 was the worst month. After April 2020, sales increased, and were close to sales in 2019 (the year before the pandemic).
 The second graph shows light vehicle sales since the BEA started keeping data in 1967.
 Fed's Beige Book: "Residential real estate contacts observed weakness"
by Calculated Risk on 6/01/2022 02:08:00 PM
Fed's Beige Book "This report was prepared at the Federal Reserve Bank of Philadelphia based on information collected on or before May 23, 2022."
All twelve Federal Reserve Districts have reported continued economic growth since the prior Beige Book period, with a majority indicating slight or modest growth; four Districts indicated moderate growth. Four Districts explicitly noted that the pace of growth had slowed since the prior period. Contacts in most Districts reported ongoing growth in manufacturing. Retail contacts noted some softening as consumers faced higher prices, and residential real estate contacts observed weakness as buyers faced high prices and rising interest rates. Contacts tended to cite labor market difficulties as their greatest challenge, followed by supply chain disruptions. Rising interest rates, general inflation, the Russian invasion of Ukraine, and disruptions from COVID-19 cases (especially in the Northeast) round out the key concerns impacting household and business plans. Eight Districts reported that expectations of future growth among their contacts had diminished; contacts in three Districts specifically expressed concerns about a recession.
...
Most Districts reported that employment rose modestly or moderately in a labor market that all Districts described as tight. One District explicitly reported that the pace of job growth had slowed, but some firms in most of the coastal Districts noted hiring freezes or other signs that market tightness had begun to ease. However, worker shortages continued to force many firms to operate below capacity. In response, firms continued to deploy automation, offer greater job flexibility, and raise wages. In a majority of Districts, firms reported strong wage growth, whereas most others reported moderate growth. However, in a few Districts, firms noted that wage rate increases were leveling off or edging down. Moreover, while firms throughout the country generally anticipate wages to rise further over the next year, one District indicated that its firms' expected rate of wage growth has fallen for two consecutive quarters.
emphasis added
Worst Housing Affordability" since 1991 excluding Bubble; Real House Prices and Price-to-Rent Ratio in March
by Calculated Risk on 6/01/2022 11:47:00 AM
Today, in the Calculated Risk Real Estate Newsletter: Worst Housing Affordability" since 1991 excluding Bubble
Excerpt:
I’ve put together my own affordability index - since 1976 - that is similar to the FirstAm approach (more of a house price index adjusted by mortgage rates and the median household income).
I used median income from the Census Bureau (estimated 2021 and 2022), assumed a 15% down payment, and used a 2% estimate for property taxes, insurance and maintenance. This is probably low for high property tax states like New Jersey and Texas, and too high for lower property tax states. If we were including condos, we’d also include HOA fees too (this is excluded).
For house prices, I used the Case-Shiller National Index, Seasonally Adjusted (SA). Also, for the down payment - there wasn’t a significant difference between 15% and 20%. For mortgage rates, I used the Freddie Mac PMMS (30-year fixed rates).
So here is what the index looks like (lower is more affordable like the FirstAm index):
Note that by this index, during the early ‘80s, homes were very unaffordable due to the very high mortgage rates. During the housing bubble, houses were also less affordable using 30-year mortgage rates, however, during the bubble, there were many “affordability products” that allowed borrowers to be qualified at the teaser rate (usually around 1%) that made houses seem more affordable.
In general, this would suggest houses are the least affordable since the housing bubble. And excluding the bubble - with all the “affordability products” - this is the worst affordability since 1991.
Look down to the second graph below (real house prices) and look what happened after 1991. House prices were mostly down or flat for the next 5 years in real terms.
Also, in March, the average 30-year mortgage rates were around 4.2%, and currently mortgage rates are close to 5.4% - so we already know the “Affordability Price Index” will increase further over the next couple of months (meaning houses are even less affordable).
Construction Spending Increased 0.2% in April
by Calculated Risk on 6/01/2022 11:34:00 AM
From the Census Bureau reported that overall construction spending increased:
Construction spending during April 2022 was estimated at a seasonally adjusted annual rate of $1,744.8 billion, 0.2 percent above the revised March estimate of $1,740.6 billion. The April figure is 12.3 percent above the April 2021 estimate of $1,553.5 billion.Private spending increased and public spending decreased:
emphasis added
Spending on private construction was at a seasonally adjusted annual rate of $1,394.7 billion, 0.5 percent above the revised March estimate of $1,387.9 billion. ...
In April, the estimated seasonally adjusted annual rate of public construction spending was $350.1 billion, 0.7 percent below the revised March estimate of $352.7 billion.
 Click on graph for larger image.
This graph shows private residential and nonresidential construction spending, and public spending, since 1993. Note: nominal dollars, not inflation adjusted.
Residential (red) spending is 31% above the bubble peak (in nominal terms - not adjusted for inflation).
Non-residential (blue) spending is 21% above the bubble era peak in January 2008 (nominal dollars).
Public construction spending is 8% above the peak in March 2009.
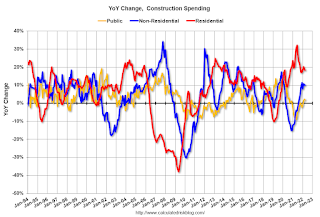 The second graph shows the year-over-year change in construction spending.
On a year-over-year basis, private residential construction spending is up 18.4%. Non-residential spending is up 10.1% year-over-year. Public spending is up 1.8% year-over-year.
BLS: Job Openings Decreased to 11.4 million in April
by Calculated Risk on 6/01/2022 10:13:00 AM
From the BLS: Job Openings and Labor Turnover Summary
The number of job openings decreased to 11.4 million on the last business day of April, the U.S. Bureau of Labor Statistics reported today. Hires and total separations were little changed at 6.6 million and 6.0 million, respectively. Within separations, quits were little changed at 4.4 million, while layoffs and discharges edged down to a series low of 1.2 million.The following graph shows job openings (yellow line), hires (dark blue), Layoff, Discharges and other (red column), and Quits (light blue column) from the JOLTS.
emphasis added
This series started in December 2000.
Note: The difference between JOLTS hires and separations is similar to the CES (payroll survey) net jobs headline numbers. This report is for April, the employment report this Friday will be for May.
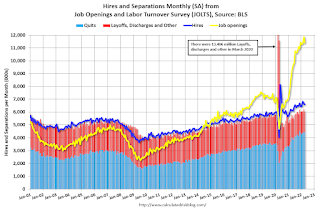 Click on graph for larger image.
Note that hires (dark blue) and total separations (red and light blue columns stacked) are usually pretty close each month. This is a measure of labor market turnover. When the blue line is above the two stacked columns, the economy is adding net jobs - when it is below the columns, the economy is losing jobs.
The spike in layoffs and discharges in March 2020 is labeled, but off the chart to better show the usual data.
Jobs openings decreased in April to 11.400 million from 11.855 million in March.
The number of job openings (yellow) were up 23% year-over-year.
Quits were up 10% year-over-year. These are voluntary separations. (See light blue columns at bottom of graph for trend for "quits").
ISM® Manufacturing index Increased to 56.1% in May
by Calculated Risk on 6/01/2022 10:06:00 AM
(Posted with permission). The ISM manufacturing index indicated expansion. The PMI® was at 56.1% in May, up from 55.4% in April. The employment index was at 49.6%, down from 50.9% last month, and the new orders index was at 55.1%, up from 53.5%.
From ISM: Manufacturing PMI® at 56.1% May 2022 Manufacturing ISM® Report On Business®
Economic activity in the manufacturing sector grew in May, with the overall economy achieving a 24th consecutive month of growth, say the nation’s supply executives in the latest Manufacturing ISM® Report On Business®.This suggests manufacturing expanded at a faster pace in May than in April. This was above the consensus forecast, although the employment index was weak in May.
The report was issued today by Timothy R. Fiore, CPSM, C.P.M., Chair of the Institute for Supply Management® (ISM®) Manufacturing Business Survey Committee:
“The May Manufacturing PMI® registered 56.1 percent, an increase of 0.7 percentage point from the reading of 55.4 percent in April. This figure indicates expansion in the overall economy for the 24th month in a row after a contraction in April and May 2020. This is the second-lowest Manufacturing PMI® reading since September 2020, when it registered 55.4 percent. The New Orders Index reading of 55.1 percent is 1.6 percentage points higher than the 53.5 percent recorded in April. The Production Index reading of 54.2 percent is a 0.6-percentage point increase compared to April’s figure of 53.6 percent. The Prices Index registered 82.2 percent, down 2.4 percentage points compared to the April figure of 84.6 percent. The Backlog of Orders Index registered 58.7 percent, 2.7 percentage points higher than the April reading of 56 percent. The Employment Index went into contraction territory at 49.6 percent, 1.3 percentage points lower than the 50.9 percent recorded in April. The Supplier Deliveries Index reading of 65.7 percent is 1.5 percentage points lower than the April figure of 67.2 percent. The Inventories Index registered 55.9 percent, 4.3 percentage points higher than the April reading of 51.6 percent. The New Export Orders Index reading of 52.9 percent is up 0.2 percentage point compared to April’s figure of 52.7 percent. The Imports Index fell into contraction territory, decreasing 2.7 percentage points to 48.7 percent from 51.4 percent in April.”
emphasis added


