 RSS Feed
 by Calculated Risk on 6/09/2022 10:38:00 AM
Thursday, June 09, 2022
CoreLogic: 1.1 million Homeowners with Negative Equity in Q1 2022
From CoreLogic: US Homeowners Gained Over $60,000 in Equity Per Borrower in Q1 2022 as Historic Home Price Growth Continues, CoreLogic Reports
CoreLogic® ... today released the Homeowner Equity Report (HER) for the first quarter of 2022. The report shows U.S. homeowners with mortgages (which account for roughly 62% of all properties) have seen their equity increase by 32.2% year over year, representing a collective equity gain of $3.8 trillion, and an average gain of $63,600 per borrower, since the first quarter of 2021.
...
“Price growth is the key ingredient for the creation of home equity wealth,” said Patrick Dodd, president and CEO at CoreLogic. “Home prices were up by 20% in March compared to one year earlier in CoreLogic’s national Home Price Index. This has led to the largest one-year gain in average home equity wealth for owners and is expected to spur a record amount of home-improvement spending this year.”
Negative equity, also referred to as underwater or upside-down mortgages, applies to borrowers who owe more on their mortgages than their homes are currently worth. As of the first quarter of 2022, the quarterly and annual changes in negative equity were:
• Quarterly change: From the fourth quarter of 2021 to the first quarter of 2022, the total number of mortgaged homes in negative equity decreased by 5.3% to 1.1 million homes, or 2% of all mortgaged properties.
• Annual change: In the first quarter of 2021, 1.4 million homes, or 2.6% of all mortgaged properties, were in negative equity. This number decreased by 23%, or approximately 300,000 properties, in the first quarter of 2022.
Because home equity is affected by home price changes, borrowers with equity positions near (+/- 5%) the negative equity cutoff are most likely to move out of or into negative equity as prices change, respectively. Looking at the first quarter of 2022 book of mortgages, if home prices increase by 5%, 130,000 homes would regain equity; if home prices decline by 5%, 167,000 properties would fall underwater.
emphasis added
 Click on graph for larger image.
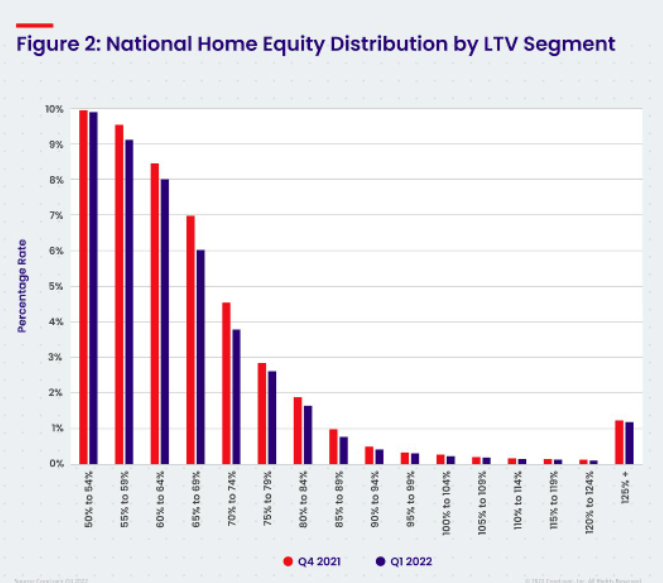
This graph from CoreLogic compares Q1 2022 to Q4 2021 equity distribution by LTV. There are still a few properties with LTV over 125%. But most homeowners have a significant amount of equity. This is a very different picture than at the start of the housing bust when many homeowners had little equity.
On a year-over-year basis, the number of homeowners with negative equity has declined from 1.4 million to 1.1 million.
Weekly Initial Unemployment Claims Increase to 229,000
by Calculated Risk on 6/09/2022 08:34:00 AM
The DOL reported:
In the week ending June 4, the advance figure for seasonally adjusted initial claims was 229,000, an increase of 27,000 from the previous week's revised level. The previous week's level was revised up by 2,000 from 200,000 to 202,000. The 4-week moving average was 215,000, an increase of 8,000 from the previous week's revised average. The previous week's average was revised up by 500 from 206,500 to 207,000.The following graph shows the 4-week moving average of weekly claims since 1971.
emphasis added
 Click on graph for larger image.
The dashed line on the graph is the current 4-week average. The four-week average of weekly unemployment claims increased to 215,000.
The previous week was revised up.
Weekly claims were higher than the consensus forecast.
Wednesday, June 08, 2022
Thursday: Unemployment Claims, Q1 Flow of Funds
by Calculated Risk on 6/08/2022 09:01:00 PM
Thursday:
• At 8:30 AM ET, The initial weekly unemployment claims report will be released. The consensus is for 210 thousand up from 200 thousand last week.
• At 12:00 PM, Q1 Flow of Funds Accounts of the United States from the Federal Reserve.
On COVID (focus on hospitalizations and deaths):
| COVID Metrics | ||||
|---|---|---|---|---|
| Now | Week Ago | Goal | ||
| Percent fully Vaccinated | 66.7% | --- | ≥70.0%1 | |
| Fully Vaccinated (millions) | 221.6 | --- | ≥2321 | |
| New Cases per Day3🚩 | 104,511 | 103,774 | ≤5,0002 | |
| Hospitalized3🚩 | 23,230 | 21,425 | ≤3,0002 | |
| Deaths per Day3🚩 | 291 | 275 | ≤502 | |
| 1 Minimum to achieve "herd immunity" (estimated between 70% and 85%). 2my goals to stop daily posts, 37-day average for Cases, Currently Hospitalized, and Deaths 🚩 Increasing 7-day average week-over-week for Cases, Hospitalized, and Deaths ✅ Goal met. | ||||
 Click on graph for larger image.
This graph shows the daily (columns) and 7-day average (line) of deaths reported.
Average daily deaths bottomed in July 2021 at 214 per day.
Homebuilder Comments in May: “Builder metrics quickly deteriorating"
by Calculated Risk on 6/08/2022 05:12:00 PM
Today, in the Calculated Risk Real Estate Newsletter: Homebuilder Comments in May: “Builder metrics quickly deteriorating"
A brief excerpt:
Read these comments. These are clear signs of a market shift.There is much more in the article. You can subscribe at https://calculatedrisk.substack.com/
Some homebuilder comments courtesy of Rick Palacios Jr., Director of Research at John Burns Real Estate Consulting (a must follow for housing on twitter!):
...
#Austin builder: “Some parts of town where finished homes are now taking a month to sell versus hours. Market is definitely correcting. Incentives are back and seeing some builders cutting prices on inventory.”
...
#Birmingham builder: “Steep decline in sales over past 2 weeks.”
...
#Greenville builder: “Lowest traffic in many months.”
#LosAngeles builder: “Seeing more cancellations due to payment shock for those in backlog that didn't lock rates.”
...
#Portland builder: “Incentives are back in the market.”
Current State of the Housing Market
by Calculated Risk on 6/08/2022 11:00:00 AM
Today, in the Calculated Risk Real Estate Newsletter: Current State of the Housing Market
A brief excerpt:
This is a market overview. There are clear signs of a market shift. A few quotes:There is much more in the article. You can subscribe at https://calculatedrisk.substack.com/
From Denver Metro Association of Realtors® “modest numbers this month became a sign that the market has returned to a semblance of ‘normal.’”
From Las Vegas: “The slowdown in sales and increase in our housing supply are signs that things may be starting to calm down a bit.” [LVR President Brandon] Roberts
From Seattle area: Mike Larson, a member of the board of directors at Northwest Multiple Listing Service described the market as "more balanced and not so crazy”.
...
We have to be patient waiting to see the impact on house prices of the slowdown in sales due to the significant data lags. Meanwhile, Altos Research CEO Mike Simonsen noted this week that “prices reductions” are the story right now.
Note the dark red line on the graph below. The percent of recent price reductions is still below normal for this time of year but increasing quicky - and it is well above last year at this time, and also above the level in 2020. This is an early indicator of the coming slowdown in house price growth.Mike Simonsen tweeted: Price reductions!
"That's the story of the US real estate market now.
While still fewer than normal, more sellers are cutting prices every day."

MBA: Mortgage Applications Decrease in Latest Weekly Survey
by Calculated Risk on 6/08/2022 07:00:00 AM
From the MBA: Mortgage Applications Decrease in Latest MBA Weekly Survey
Mortgage applications decreased 6.5 percent from one week earlier, according to data from the Mortgage Bankers Association’s (MBA) Weekly Mortgage Applications Survey for the week ending June 3, 2022. This week’s results include an adjustment for the Memorial Day holiday.
... The Refinance Index decreased 6 percent from the previous week and was 75 percent lower than the same week one year ago. The seasonally adjusted Purchase Index decreased 7 percent from one week earlier. The unadjusted Purchase Index decreased 18 percent compared with the previous week and was 21 percent lower than the same week one year ago.
“Weakness in both purchase and refinance applications pushed the market index down to its lowest level in 22 years. The 30-year fixed rate increased to 5.4 percent after three consecutive declines. While rates were still lower than they were four weeks ago, they remained high enough to still suppress refinance activity. Only government refinances saw a slight increase last week,” said Joel Kan, MBA’s Associate Vice President of Economic and Industry Forecasting. “The purchase market has suffered from persistently low housing inventory and the jump in mortgage rates over the past two months. These worsening affordability challenges have been particularly hard on prospective first-time buyers.”
...
The average contract interest rate for 30-year fixed-rate mortgages with conforming loan balances ($647,200 or less) increased to 5.40 percent from 5.33 percent, with points increasing to 0.60 from 0.51 (including the origination fee) for 80 percent loan-to-value ratio (LTV) loans.
emphasis added
 Click on graph for larger image.
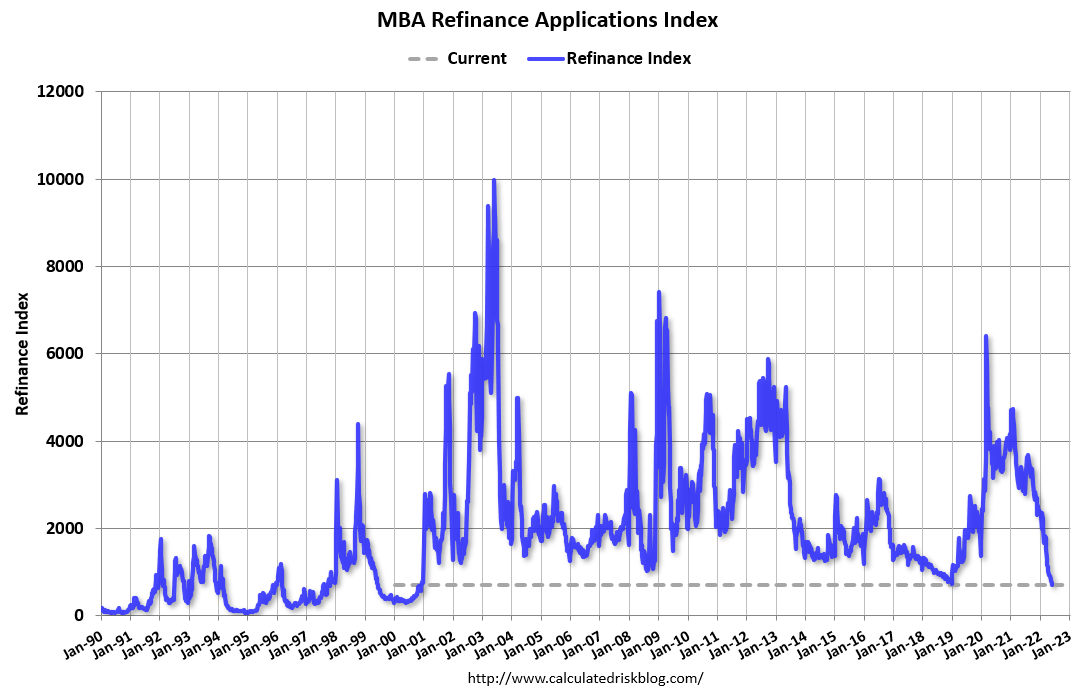
The first graph shows the refinance index since 1990.
With higher mortgage rates, the refinance index has declined sharply over the last several months.
The refinance index is at the lowest level since the year 2000.
The second graph shows the MBA mortgage purchase index
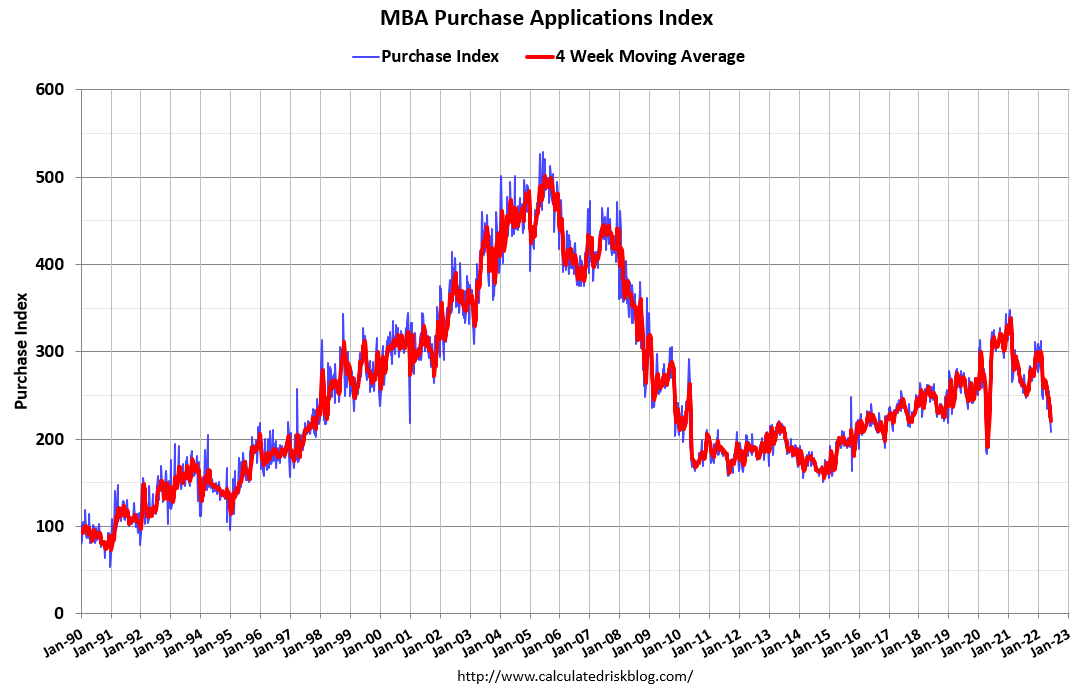 According to the MBA, purchase activity is down 21% year-over-year unadjusted.
Note: Red is a four-week average (blue is weekly).
Tuesday, June 07, 2022
Wednesday: Mortgage Purchase Index
by Calculated Risk on 6/07/2022 09:01:00 PM
Wednesday:
• At 7:00 AM ET, The Mortgage Bankers Association (MBA) will release the results for the mortgage purchase applications index.
On COVID (focus on hospitalizations and deaths):
| COVID Metrics | ||||
|---|---|---|---|---|
| Now | Week Ago | Goal | ||
| Percent fully Vaccinated | 66.7% | --- | ≥70.0%1 | |
| Fully Vaccinated (millions) | 221.6 | --- | ≥2321 | |
| New Cases per Day3🚩 | 108,891 | 97,584 | ≤5,0002 | |
| Hospitalized3🚩 | 22,764 | 21,287 | ≤3,0002 | |
| Deaths per Day3 | 287 | 295 | ≤502 | |
| 1 Minimum to achieve "herd immunity" (estimated between 70% and 85%). 2my goals to stop daily posts, 37-day average for Cases, Currently Hospitalized, and Deaths 🚩 Increasing 7-day average week-over-week for Cases, Hospitalized, and Deaths ✅ Goal met. | ||||
Click on graph for larger image.This graph shows the daily (columns) and 7-day average (line) of deaths reported.
Average daily deaths bottomed in July 2021 at 214 per day.
Leading Index for Commercial Real Estate "Shows Gains in May"
by Calculated Risk on 6/07/2022 04:18:00 PM
From Dodge Data Analytics: Dodge Momentum Index Shows Gains in May
The Dodge Momentum Index (DMI) jumped 7% in May to 176.2 (2000=100), up from the revised April reading of 165.2. The Momentum Index, issued by Dodge Construction Network, is a monthly measure of the initial report for nonresidential building projects in planning shown to lead construction spending for nonresidential buildings by a full year. In May, the institutional component of the Momentum Index rose 9%, and the commercial component increased 6%.
May’s increase in the Dodge Momentum Index pushed the level of planning above the most recent cyclical high in November 2021. During the month of May, commercial planning was led higher by an increase in office and hotel projects. Institutional planning was boosted by an increase in education and healthcare projects entering planning. On a year-over-year basis, the Momentum Index was 17% higher than in May 2021. The commercial component was 24% higher, and the institutional component was 8% higher than one year ago.
emphasis added
 Click on graph for larger image.
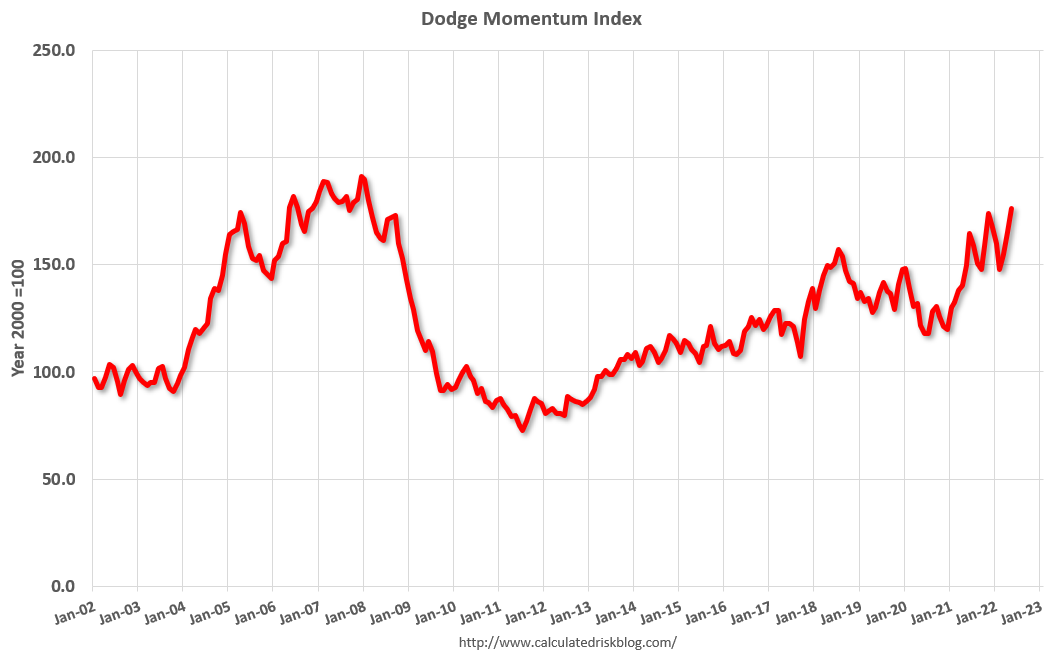
This graph shows the Dodge Momentum Index since 2002. The index was at 176.2 in May, up from 165.2 in April.
According to Dodge, this index leads "construction spending for nonresidential buildings by a full year". This index suggested a decline in Commercial Real Estate construction through most of 2021, but a solid pickup this year and into 2023.
1st Look at Local Housing Markets in May, Inventory up Sharply
by Calculated Risk on 6/07/2022 12:22:00 PM
Today, in the Calculated Risk Real Estate Newsletter: 1st Look at Local Housing Markets in May, Inventory up Sharply
A brief excerpt:
From the Northwest MLS: Western Washington housing market "more balanced, and not so crazy - and that's a good thing"There is much more in the article. You can subscribe at https://calculatedrisk.substack.com/"Home sellers really need to re-think their expectations," suggested Mike Larson, a member of the board of directors at Northwest Multiple Listing Service (NWMLS) when commenting on statistics summarizing May activity. ...Here is a summary of active listings for these housing markets in May. Inventory usually increases seasonally in May, so some month-over-month (MoM) increase is not surprising.
Inventory in these markets were down 28% YoY in February, down 4% YoY in March, up 10% YoY in April, and up 42% YoY in May! So, this is a significant change from earlier this year. This is another step towards a more balanced market, but inventory levels are still historically low.
Notes for all tables:
1) New additions to table in BOLD.
2) Northwest (Seattle) and Santa Clara (San Jose)

Second Home Market: South Lake Tahoe in May
by Calculated Risk on 6/07/2022 10:29:00 AM
With the pandemic, there was a surge in 2nd home buying.
I'm looking at data for some second home markets - and I'm tracking those markets to see if there is an impact from lending changes like the FHFA Targeted Increases to Enterprise Pricing Framework, rising mortgage rates or the easing of the pandemic.
This graph is for South Lake Tahoe since 2004 through May 2022, and shows inventory (blue), and the year-over-year (YoY) change in the median price (12-month average).
Note: The median price is distorted by the mix, but this is the available data.
 Click on graph for larger image.
Following the housing bubble, prices declined for several years in South Lake Tahoe, with the median price falling about 50% from the bubble peak.
Currently inventory is still very low, but up from the record low set in February 2022, and up 50% year-over-year. Prices are up 16.1% YoY (but the YoY change has been trending down).
This will be interesting to watch, but so far there is little evidence of a 2nd home slowdown in these numbers.


