by Calculated Risk on 6/28/2022 01:53:00 PM
Tuesday, June 28, 2022
Predicting the Next Recession
The recession callers are back, and some like ARK's Cathie Wood and Home Depot's Ken Langone claim the US is already in a recession. I disagree. We did see negative real GDP growth in Q1, and we might see negative real GDP growth in Q2 - but this doesn't mean the US economy is in a recession.
In that 2013 post, I wrote:
The next recession will probably be caused by one of the following (from least likely to most likely):Unfortunately, in 2020, one of those low probability events happened (pandemic), and that led to a recession in 2020.
3) An exogenous event such as a pandemic, significant military conflict, disruption of energy supplies for any reason, a major natural disaster (meteor strike, super volcano, etc), and a number of other low probability reasons. All of these events are possible, but they are unpredictable, and the probabilities are low that they will happen in the next few years or even decades.
emphasis added
2) Significant policy error. Two examples: not reaching a fiscal agreement and going off the "fiscal cliff" probably would have led to a recession, and Congress refusing to "pay the bills" would have been a policy error that would have taken the economy into recession.We've seen several policy errors, mostly related to immigration and trade during the previous administration, but none that would lead the economy into a recession.
1) Most of the post-WWII recessions were caused by the Fed tightening monetary policy to slow inflation. I think this is the most likely cause of the next recession. Usually, when inflation starts to become a concern, the Fed tries to engineer a "soft landing", and frequently the result is a recession.And this most common cause of a recession is the current concern. Since inflation picked up, mostly due to the pandemic (stimulus spending, supply constraints) and due to the invasion of Ukraine, the Fed has embarked on a tightening cycle to slow inflation.
 Click on graph for larger image.
The arrows point to some of the earlier peaks and troughs for these three measures.
The purpose of this graph is to show that these three indicators generally reach peaks and troughs together. Note that Residential Investment is quarterly and single-family starts and new home sales are monthly.
New home sales and single-family starts turned down, but this was partly due to the huge surge in sales during the pandemic. Residential investment might be peaking.
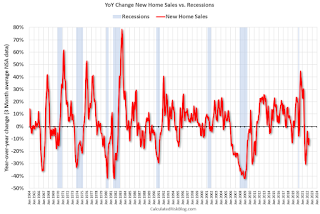
 The second graph shows the YoY change in New Home Sales from the Census Bureau. Currently new home sales (based on 3-month average) are down 10% year-over-year.
Note: the New Home Sales data is smoothed using a three month centered average before calculating the YoY change. The Census Bureau data starts in 1963.
Some observations:
1) When the YoY change in New Home Sales falls about 20%, usually a recession will follow. An exception for this data series was the mid '60s when the Vietnam buildup kept the economy out of recession. Another exception was the recent situation - we saw a YoY decline in new home sales related to the pandemic and the surge in new home sales in the second half of 2020. Ignore this pandemic distortion!
2) It is also interesting to look at the '86/'87 and the mid '90s periods. New Home sales fell in both of these periods, although not quite 20%. As I noted in earlier posts, the mid '80s saw a surge in defense spending and MEW that more than offset the decline in New Home sales. In the mid '90s, nonresidential investment remained strong.
If the Fed tightening cycle will lead to a recession, we should see housing turn down first (new home sales, single family starts, residential investment). This might be happening, but this usually leads the economy by a year or more. So, we might be looking at a recession in 2023.
Comments on April Case-Shiller and FHFA House Price Increases
by Calculated Risk on 6/28/2022 11:18:00 AM
Today, in the Calculated Risk Real Estate Newsletter: Case-Shiller National Index up 20.4% Year-over-year in April
Excerpt:
This graph below shows existing home months-of-supply (inverted, from the NAR) vs. the seasonally adjusted month-to-month price change in the Case-Shiller National Index (both since January 1999 through April 2022).
Note that the months-of-supply is not seasonally adjusted.
There is a clear relationship, and this is no surprise (but interesting to graph). If months-of-supply is high, prices decline. If months-of-supply is low (like now), prices rise quickly.
In April, the months-of-supply was at 2.2 months, and the Case-Shiller National Index (SA) increased 1.50% month-over-month. The black arrow points to the April 2022 dot. In the May existing home sales report, the NAR reported months-of-supply increased to 2.6 months.Since inventory is now increasing quickly (but still low), we should expect price increases to slow. The normal level of inventory is probably in the 4 to 6 months range, and we will have to see a significant increase in inventory to sharply slow price increases, and that is why I’m focused on inventory!
This was slightly below expectations. There is a significant lag to this data, see: When will House Price Growth Slow? Since Case-Shiller is a 3-month average, and this report was for April (includes February and March closings), this included price increases when mortgage rates were significantly lower than today. This report includes some homes with contracts signed last December (that closed in February)!
Case-Shiller: National House Price Index Increased 20.4% Year-over-year in April
by Calculated Risk on 6/28/2022 09:29:00 AM
Note: S&P hasn't updated their data yet.
From Diana Olick at CNBC: Home price increases slowed for the first time in months in April, says S&P Case-Shiller
Prices rose 20.4% nationally in April compared with the same month a year ago, according to the S&P CoreLogic Case-Shiller Index. In March, home prices grew 20.6%. ...This was slightly below expectation.
The 10-city composite annual increase was 19.7%, up from 19.5% in March. The 20-city composite posted a 21.2% annual gain, up from 21.1% in the previous month.
Note that this monthly home price index release was for April, and "April" is a 3-month average of February, March and April closing prices. February closing prices include some contracts signed last December, so there is a significant lag to this data.
Monday, June 27, 2022
Tuesday: Case-Shiller House Prices
by Calculated Risk on 6/27/2022 09:00:00 PM

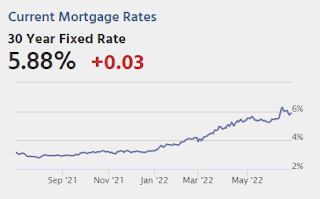
As has been the case many times during the 2022 rate spike, there is a much higher degree of variation between lenders compared to more stable times for rates. The average lender was only moderately higher when it comes to mortgage rate quotes today. Notably, the bond market suggested a bigger jump. The actual jump may have been smaller due to more conservative rate-setting strategies among mortgage lenders on Friday afternoon. [30 year fixed 5.88%]Tuesday:
emphasis added
• At 9:00 AM ET, S&P/Case-Shiller House Price Index for April. The consensus is for a 21.0% year-over-year increase in the Comp 20 index for April.
• At 9:00 AM, FHFA House Price Index for April 2021. This was originally a GSE only repeat sales, however there is also an expanded index.
• At 10:00 AM, Richmond Fed Survey of Manufacturing Activity for June.
On COVID (focus on hospitalizations and deaths):
| COVID Metrics | ||||
|---|---|---|---|---|
| Now | Week Ago | Goal | ||
| Percent fully Vaccinated | 66.9% | --- | ≥70.0%1 | |
| Fully Vaccinated (millions) | 222.1 | --- | ≥2321 | |
| New Cases per Day3🚩 | 100,674 | 98,301 | ≤5,0002 | |
| Hospitalized3 | 22,861 | 24,833 | ≤3,0002 | |
| Deaths per Day3🚩 | 290 | 289 | ≤502 | |
| 1 Minimum to achieve "herd immunity" (estimated between 70% and 85%). 2my goals to stop daily posts, 37-day average for Cases, Currently Hospitalized, and Deaths 🚩 Increasing 7-day average week-over-week for Cases, Hospitalized, and Deaths ✅ Goal met. | ||||
 Click on graph for larger image.
This graph shows the daily (columns) and 7-day average (line) of deaths reported.
Freddie Mac: Mortgage Serious Delinquency Rate decreased in May
by Calculated Risk on 6/27/2022 04:54:00 PM
Freddie Mac reported that the Single-Family serious delinquency rate in May was 0.80%, down from 0.85% April. Freddie's rate is down year-over-year from 2.01% in May 2021.
Freddie's serious delinquency rate peaked in February 2010 at 4.20% following the housing bubble and peaked at 3.17% in August 2020 during the pandemic.
These are mortgage loans that are "three monthly payments or more past due or in foreclosure".

Mortgages in forbearance are being counted as delinquent in this monthly report but are not reported to the credit bureaus.
This is very different from the increase in delinquencies following the housing bubble. Lending standards have been fairly solid over the last decade, and most of these homeowners have equity in their homes - and they will be able to restructure their loans once (if) they are employed.
Housing: Inventory will Tell the Tale; Altos Research Reports Inventory Above Peak in 2021
by Calculated Risk on 6/27/2022 10:23:00 AM
Today, in the Calculated Risk Real Estate Newsletter: Housing: Inventory will Tell the Tale
Brief excerpt:
The first question I’m always asked about housing is What will happen with house prices? and then When will House Price Growth Slow? The exact impact on prices is uncertain (although I tried to answer both questions in the above links), but I believe one thing is certain: inventory will tell the tale!You can subscribe at https://calculatedrisk.substack.com/.
That is why I watch inventory closely. ...
This morning Altos Research released inventory data as of June 24th showing that current inventory is above the peak in 2021.
...
Here is a graph of the inventory change vs 2021, 2020 (milestone 3 above) and 2019 (milestone 4). The blue line is the year-over-year data, the red line is compared to two years ago, and dashed purple is compared to 2019.
Two years ago (in 2020) inventory was declining all year, so the two-year comparison will get easier all year. Based on recent increases in inventory, my current estimate is inventory will be up compared to 2020 in Q3 of this year (in the next few months), and back to 2019 levels at the beginning of 2023.
Inventory will tell the tale!
NAR: Pending Home Sales Increased 0.7% in May
by Calculated Risk on 6/27/2022 10:04:00 AM
From the NAR: Pending Home Sales Edge Higher 0.7% in May
Pending home sales crept higher in May, ending a six-month streak of declines, according to the National Association of Realtors®. Regionally, month-over-month results were mixed as the Northeast and South experienced increases while the Midwest and West posted decreases. Year-over-year contract activity slid in all four major regions.This was above expectations of a 2.0% decrease for this index. Note: Contract signings usually lead sales by about 45 to 60 days, so this would usually be for closed sales in June and July.
The Pending Home Sales Index (PHSI), a forward-looking indicator of home sales based on contract signings, inched up 0.7% to 99.9 in May. Year-over-year, transactions dropped 13.6%. An index of 100 is equal to the level of contract activity in 2001.
"Despite the small gain in pending sales from the prior month, the housing market is clearly undergoing a transition," said NAR Chief Economist Lawrence Yun. "Contract signings are down sizably from a year ago because of much higher mortgage rates."
...
The Northeast PHSI jumped 15.4% compared to last month to 86.7, down 11.9% from May 2021. The Midwest index retreated 1.7% to 98.6 in May, a decline of 8.8% from a year ago.
The South PHSI increased 0.2% to 119.0 in May, a 13.8% drop from the previous year. The West index contracted 5.0% in May to 81.6, down 19.8% from May 2021.
emphasis added
Five High Frequency Indicators for the Economy
by Calculated Risk on 6/27/2022 08:16:00 AM
These indicators are mostly for travel and entertainment. It is interesting to watch these sectors recover as the pandemic subsides. Notes: I've added back gasoline supplied to see if there is an impact from higher gasoline prices. Apple has discontinued "Apple mobility", and restaurant traffic is mostly back to normal.
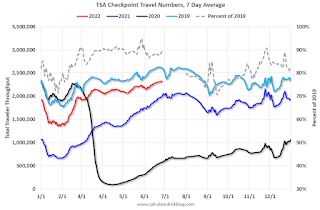
The TSA is providing daily travel numbers.
This data is as of June 26th.
 Click on graph for larger image.
This data shows the 7-day average of daily total traveler throughput from the TSA for 2019 (Light Blue), 2020 (Black), 2021 (Blue) and 2022 (Red).
The dashed line is the percent of 2019 for the seven-day average.
The 7-day average is down 10.8% from the same day in 2019 (89.2% of 2019). (Dashed line)
 This data shows domestic box office for each week and the median for the years 2016 through 2019 (dashed light blue).
 Note that the data is usually noisy week-to-week and depends on when blockbusters are released.
Movie ticket sales were at $241 million last week, down about 6% from the median for the week.
 This graph shows the seasonal pattern for the hotel occupancy rate using the four-week average.
 The red line is for 2022, black is 2020, blue is the median, and dashed light blue is for 2021. Dashed purple is 2019 (STR is comparing to a strong year for hotels).
This data is through June 18th. The occupancy rate was down 4.8% compared to the same week in 2019.
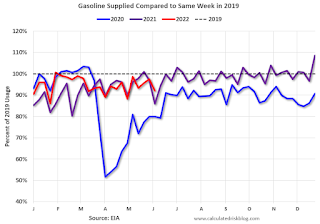
Notes: Y-axis doesn't start at zero to better show the seasonal change.
Blue is for 2020. Purple is for 2021, and Red is for 2022.
As of June 10th, gasoline supplied was down 7.9% compared to the same week in 2019.
Recently gasoline supplied has been running somewhat below 2019 levels.
Here is some interesting data on New York subway usage (HT BR).
 This graph is from Todd W Schneider.
 This data is through Friday, June 24th.
He notes: "Data updates weekly from the MTA’s public turnstile data, usually on Saturday mornings".
Sunday, June 26, 2022
Monday: Durable Goods, Pending Home Sales, Dallas Fed Mfg
by Calculated Risk on 6/26/2022 06:56:00 PM
Weekend:
• Schedule for Week of June 26, 2022
Monday:
• At 8:30 AM ET, Durable Goods Orders for May from the Census Bureau. The consensus is for a 0.1% increase in durable goods orders.
• At 10:00 AM, Pending Home Sales Index for May. The consensus is for a 2.0% decrease in the index.
• At 10:30 AM, Dallas Fed Survey of Manufacturing Activity for June.
From CNBC: Pre-Market Data and Bloomberg futures S&P 500 futures are down 12, and DOW futures are down 102 (fair value).
Oil prices were down over the last week with WTI futures at $107.62 per barrel and Brent at $113.12 per barrel. A year ago, WTI was at $73 and Brent was at $76 - so WTI oil prices are up 45% year-over-year.
Here is a graph from Gasbuddy.com for nationwide gasoline prices. Nationally prices are at $4.88 per gallon. A year ago prices were at $3.09 per gallon, so gasoline prices are up $1.79 per gallon year-over-year.
Hotels: Occupancy Rate Down 4.8% Compared to Same Week in 2019
by Calculated Risk on 6/26/2022 08:12:00 AM
U.S. hotel revenue per available room (RevPAR) reached an all-time weekly high on a nominal basis and a pandemic-era high on an inflation-adjusted basis, according to STR‘s latest data through June 18.The following graph shows the seasonal pattern for the hotel occupancy rate using the four-week average.
June 12-18, 2022 (percentage change from comparable week in 2019*):
• Occupancy: 71.8% (-4.8%)
• Average daily rate (ADR): $155.02 (+14.9%)
• evenue per available room (RevPAR): $111.29 (+9.4%)
*Due to the pandemic impact, STR is measuring recovery against comparable time periods from 2019.
emphasis added
 Click on graph for larger image.
The red line is for 2022, black is 2020, blue is the median, and dashed light blue is for 2021. Dashed purple is 2019 (STR is comparing to a strong year for hotels).


