 RSS Feed
 by Calculated Risk on 7/08/2022 08:40:00 AM
Friday, July 08, 2022
June Employment Report: 372 thousand Jobs, 3.6% Unemployment Rate
From the BLS:
Total nonfarm payroll employment rose by 372,000 in June, and the unemployment rate remained at 3.6 percent, the U.S. Bureau of Labor Statistics reported today. Notable job gains occurred in professional and business services, leisure and hospitality, and health care.
...
The change in total nonfarm payroll employment for April was revised down by 68,000, from +436,000 to +368,000, and the change for May was revised down by 6,000, from +390,000 to +384,000. With these revisions, employment in April and May combined is 74,000 lower than previously reported.
emphasis added
 Click on graph for larger image.
The first graph shows the job losses from the start of the employment recession, in percentage terms.
The current employment recession was by far the worst recession since WWII in percentage terms.
However, 28 months after the onset of the current employment recession, almost all of the jobs have returned.
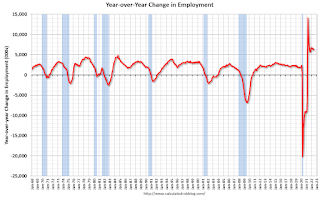 The second graph shows the year-over-year change in total non-farm employment since 1968.
In June, the year-over-year change was 6.3 million jobs. This was up significantly year-over-year.
Total payrolls increased by 372 thousand in June. Private payrolls increased by 381 thousand, and public payrolls decreased 9 thousand.
Payrolls for April and May were revised down 74 thousand, combined.
The third graph shows the employment population ratio and the participation rate.
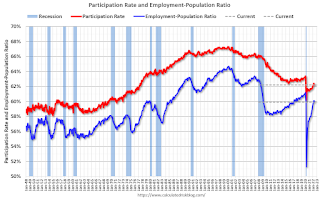 The Labor Force Participation Rate decreased to 62.2% in June, from 62.3% in May. This is the percentage of the working age population in the labor force.
The Employment-Population ratio decreased to 59.9% from 60.1% (blue line).
I'll post the 25 to 54 age group employment-population ratio graph later.
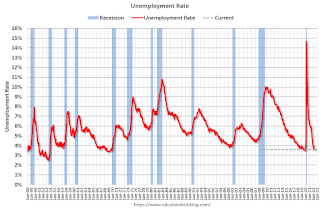 The fourth graph shows the unemployment rate.
The unemployment rate was unchanged in June at 3.6% from 3.6% in May.
This was above consensus expectations; however, April and May payrolls were revised down by 74,000 combined.
 The second graph shows the year-over-year change in total non-farm employment since 1968.
In June, the year-over-year change was 6.3 million jobs. This was up significantly year-over-year.
Total payrolls increased by 372 thousand in June. Private payrolls increased by 381 thousand, and public payrolls decreased 9 thousand.
Payrolls for April and May were revised down 74 thousand, combined.
The third graph shows the employment population ratio and the participation rate.
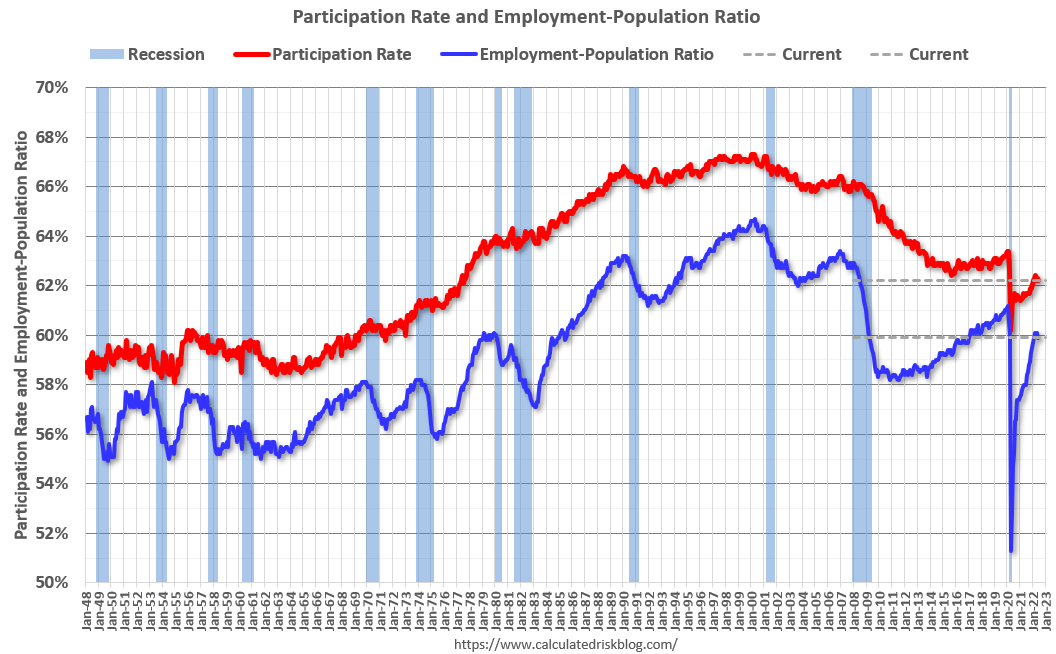 The Labor Force Participation Rate decreased to 62.2% in June, from 62.3% in May. This is the percentage of the working age population in the labor force.
 The Employment-Population ratio decreased to 59.9% from 60.1% (blue line).
I'll post the 25 to 54 age group employment-population ratio graph later.
 The fourth graph shows the unemployment rate.
 The unemployment rate was unchanged in June at 3.6% from 3.6% in May.
This was above consensus expectations; however, April and May payrolls were revised down by 74,000 combined.
I'll have more later ...
Thursday, July 07, 2022
Friday: Employment Report
by Calculated Risk on 7/07/2022 09:11:00 PM
My June Employment Preview
Goldman June Payrolls Preview
Friday:
• At 8:30 AM ET, Employment Report for June. The consensus is for 270,000 jobs added, and for the unemployment rate to be unchanged at 3.6%
On COVID (focus on hospitalizations and deaths):
| COVID Metrics | ||||
|---|---|---|---|---|
| Now | Week Ago | Goal | ||
| Percent fully Vaccinated | 66.9% | --- | ≥70.0%1 | |
| Fully Vaccinated (millions) | 222.3 | --- | ≥2321 | |
| New Cases per Day3 | 106,549 | 110,875 | ≤5,0002 | |
| Hospitalized3🚩 | 28,891 | 26,959 | ≤3,0002 | |
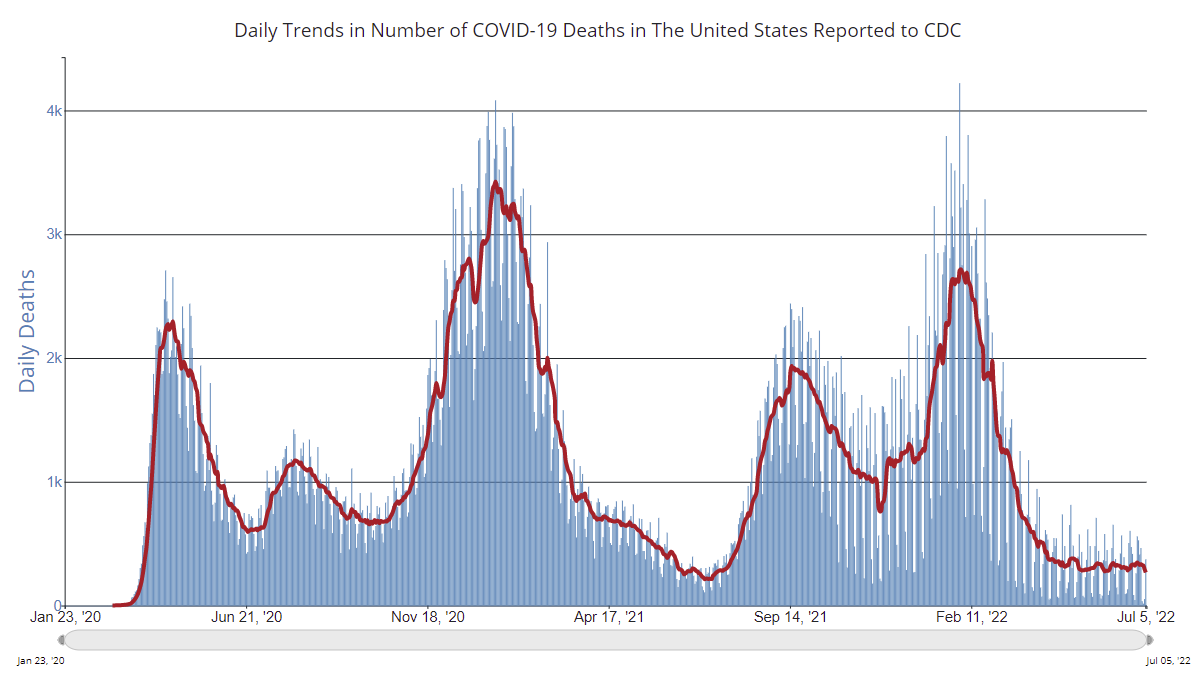
| Deaths per Day3 | 273 | 345 | ≤502 | |
| 1 Minimum to achieve "herd immunity" (estimated between 70% and 85%). 2my goals to stop daily posts, 37-day average for Cases, Currently Hospitalized, and Deaths 🚩 Increasing 7-day average week-over-week for Cases, Hospitalized, and Deaths ✅ Goal met. | ||||
 Click on graph for larger image.
This graph shows the daily (columns) and 7-day average (line) of deaths reported.
Average daily deaths bottomed in July 2021 at 214 per day.
Goldman June Payrolls Preview
by Calculated Risk on 7/07/2022 03:48:00 PM
A few brief excerpts from a note by Goldman Sachs economist Spencer Hill:
We estimate nonfarm payrolls rose 250k in June ... employment surveys and Big Data employment indicators generally weakened in the month, and the Challenger report showed an increase in job cuts—particularly in real estate, autos, and media. ... We estimate an unchanged unemployment rate at 3.6%—in line with consensus—reflecting a solid rise in household employment offset by a 0.1pp rise in labor force participation to 62.4%.CR Note: The consensus is for 270 thousand jobs added, and for the unemployment rate to be unchanged at 3.6%.
emphasis added
June Employment Preview
by Calculated Risk on 7/07/2022 12:18:00 PM
On Friday at 8:30 AM ET, the BLS will release the employment report for June. The consensus is for 270,000 jobs added, and for the unemployment rate to be unchanged at 3.6%.
 Click on graph for larger image.
• First, currently there are still about 800 thousand fewer jobs than in February 2020 (the month before the pandemic).
This graph shows the job losses from the start of the employment recession, in percentage terms.
The current employment recession was by far the worst recession since WWII in percentage terms. However, the current employment recession, 27 months after the onset, has recovered quicker than the previous two recessions.
• ADP Report: The ADP employment report has been "paused" and is being retooled.
• ISM Surveys: Note that the ISM services are diffusion indexes based on the number of firms hiring (not the number of hires). The ISM® manufacturing employment index decreased in June to 47.3%, down from 50.9% last month. This would suggest 35,000 jobs lost in manufacturing.
The ISM® services employment index decreased in June to 47.4%, down from 50.2% last month. This would suggest service employment was unchanged in June.
Combined, the ISM surveys suggest 35,000 jobs lost in June.
• Unemployment Claims: The weekly claims report showed an increase in the number of initial unemployment claims during the reference week (includes the 12th of the month) from 218,000 in May to 233,000 in June. This would usually suggest a few more layoffs in June than in May. In general, weekly claims were above expectations in June.
 • Permanent Job Losers: Something to watch in the employment report will be "Permanent job losers". This graph shows permanent job losers as a percent of the pre-recession peak in employment through the May report.
This data is only available back to 1994, so there is only data for three recessions. In May, the number of permanent job losers was unchanged at 1.386 million from 1.386 million in the previous month.
These jobs will likely be the hardest to recover, so it is a positive that the number of permanent job losers is declining fairly rapidly.
• COVID: As far as the pandemic, the number of daily cases during the reference week in June was around 105,000, up from 90,000 in May.
• Conclusion: The consensus is for job growth to slow to 270,000 jobs added in June. Overall, the ISM surveys were negative, and unemployment claims increased during the reference week. This suggests a weaker than expected employment report for June.
1st Look at Local Housing Markets in June, Sales Down Sharply
by Calculated Risk on 7/07/2022 10:05:00 AM
Today, in the Calculated Risk Real Estate Newsletter: 1st Look at Local Housing Markets in June, Sales Down Sharply
A brief excerpt:
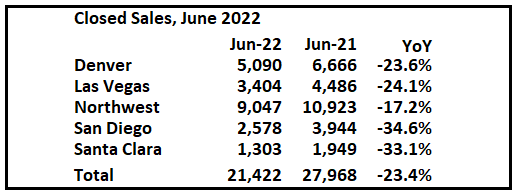
From Denver Metro Association of Realtors® (DMAR): DMAR Real Estate Market Trends ReportThere is much more in the article. You can subscribe at https://calculatedrisk.substack.com/As month-end active inventory skyrockets, the Denver Metro hit a new record for the average price of attached properties at $504,193. At the end of June 2021, Denver Metro ended with 3,122 properties on the market. It has now almost doubled that amount over the year, with a total of 6,057 properties currently sitting on the market. … “The increase in supply will eventually impact pricing, days in the MLS and the relationship between buyers and sellers, which have negatively impacted buyers’ purchasing power,” commented Andrew Abrams, Chair of the DMAR Market Trends Committee and Metro Denver Realtor®. “The stock market, inflation and cryptocurrency have all taken a hit in the last few months. Housing will eventually be a victim to the economy as a whole, but just how much is yet to be seen. It is realistic to see days in the MLS, currently sitting at a historic low of four, increase in the coming months.”
emphasis added... And a table of June sales. Sales in these areas were down 23.4% YoY, Not Seasonally Adjusted (NSA). Contracts for sales in June were mostly signed in April and May, when mortgage rates were lower than in June.
...
Notes for all tables:
1) New additions to table in BOLD.
2) Northwest (Seattle) and Santa Clara (San Jose)
Trade Deficit decreased to $85.5 Billion in May
by Calculated Risk on 7/07/2022 08:46:00 AM
From the Department of Commerce reported:
The U.S. Census Bureau and the U.S. Bureau of Economic Analysis announced today that the goods and services deficit was $85.5 billion in May, down $1.1 billion from $86.7 billion in April, revised.
May exports were $255.9 billion, $3.0 billion more than April exports. May imports were $341.4 billion, $1.9 billion more than April imports.
emphasis added
 Click on graph for larger image.
Both exports and imports increased in May.
Exports are up 22% year-over-year; imports are up 23% year-over-year.
Both imports and exports decreased sharply due to COVID-19, and have now bounced back (imports more than exports),
The second graph shows the U.S. trade deficit, with and without petroleum.
 The blue line is the total deficit, and the black line is the petroleum deficit, and the red line is the trade deficit ex-petroleum products.
Note that net, imports and exports of petroleum products are close to zero.
The trade deficit with China increased to $31.5 billion in May, from $26.1 billion a year ago.
The trade deficit was close to the consensus forecast, and the deficit for April was revised down.
Weekly Initial Unemployment Claims Increase to 235,000
by Calculated Risk on 7/07/2022 08:34:00 AM
The DOL reported:
In the week ending July 2, the advance figure for seasonally adjusted initial claims was 235,000, an increase of 4,000 from the previous week's unrevised level of 231,000. The 4-week moving average was 232,500, an increase of 750 from the previous week's unrevised average of 231,750.The following graph shows the 4-week moving average of weekly claims since 1971.
emphasis added
 Click on graph for larger image.
The dashed line on the graph is the current 4-week average. The four-week average of weekly unemployment claims increased to 232,500.
The previous week was unrevised.
Weekly claims were higher than the consensus forecast.
Wednesday, July 06, 2022
Thursday: Unemployment Claims, Trade Deficit
by Calculated Risk on 7/06/2022 09:02:00 PM
Thursday:
• At 8:15 AM ET, The ADP Employment Report for June will NOT be released.
"ADP Research Institute (ADPRI) and the Stanford Digital Economy Lab (the "Lab") announced they will retool the ADP National Employment Report (NER) methodology to provide a more robust, high-frequency view of the labor market and trajectory of economic growth. In preparation for the changeover to the new report and methodology, ADPRI will pause issuing the current report and has targeted August 31, 2022 ..."• At 8:30 AM, The initial weekly unemployment claims report will be released. The consensus is for 225 thousand down from 231 thousand last week.
• Also at 8:30 AM, Trade Balance report for May from the Census Bureau. The consensus is the trade deficit to be $84.9 billion. The U.S. trade deficit was at $87.1 billion the previous month.
On COVID (focus on hospitalizations and deaths):
| COVID Metrics | ||||
|---|---|---|---|---|
| Now | Week Ago | Goal | ||
| Percent fully Vaccinated | 66.9% | --- | ≥70.0%1 | |
| Fully Vaccinated (millions) | 222.3 | --- | ≥2321 | |
| New Cases per Day3 | 106,178 | 108,391 | ≤5,0002 | |
| Hospitalized3🚩 | 28,101 | 26,543 | ≤3,0002 | |
| Deaths per Day3 | 267 | 345 | ≤502 | |
| 1 Minimum to achieve "herd immunity" (estimated between 70% and 85%). 2my goals to stop daily posts, 37-day average for Cases, Currently Hospitalized, and Deaths 🚩 Increasing 7-day average week-over-week for Cases, Hospitalized, and Deaths ✅ Goal met. | ||||
 Click on graph for larger image.
This graph shows the daily (columns) and 7-day average (line) of deaths reported.
Average daily deaths bottomed in July 2021 at 214 per day.
ISM® Services Index Decreased to 55.3% in June, Employment Contracted
by Calculated Risk on 7/06/2022 07:01:00 PM
(Posted with permission). The ISM® Services index was at 55.3%, down from 55.9% last month. The employment index decreased to 47.4%, from 50.2%. Note: Above 50 indicates expansion, below 50 in contraction.
From the Institute for Supply Management: Services PMI® at 55.3% June 2022 Services ISM® Report On Business®
Economic activity in the services sector grew in June for the 25th month in a row — with the Services PMI® registering 55.3 percent, say the nation's purchasing and supply executives in the latest Services ISM® Report On Business®.This was slightly better than expected.
The report was issued today by Anthony Nieves, CPSM, C.P.M., A.P.P., CFPM, Chair of the Institute for Supply Management® (ISM®) Services Business Survey Committee: “In June, the Services PMI® registered 55.3 percent, 0.6 percentage point lower than May’s reading of 55.9 percent. This is the lowest reading since May 2020 (45.2 percent). The Business Activity Index registered 56.1 percent, an increase of 1.6 percentage points compared to the reading of 54.5 percent in May. The New Orders Index figure of 55.6 percent is 2 percentage points lower than the May reading of 57.6 percent.
...
The Employment Index (47.4 percent) contracted...
emphasis added
FOMC Minutes "Near-term inflation outlook had deteriorated"
by Calculated Risk on 7/06/2022 02:10:00 PM
From the Fed: Minutes of the Federal Open Market Committee, June 14-15, 2022. Excerpt on inflation risks:
In their discussion of risks, participants emphasized that they were highly attentive to inflation risks and were closely monitoring developments regarding both inflation and inflation expectations. Most agreed that risks to inflation were skewed to the upside and cited several such risks, including those associated with ongoing supply bottlenecks and rising energy and commodity prices. Participants judged that uncertainty about economic growth over the next couple of years was elevated. In that context, a couple of them noted that GDP and gross domestic income had been giving conflicting signals recently regarding the pace of economic growth, making it challenging to determine the economy's underlying momentum. Most participants assessed that the risks to the outlook for economic growth were skewed to the downside. Downside risks included the possibility that a further tightening in financial conditions would have a larger negative effect on economic activity than anticipated as well as the possibilities that the Russian invasion of Ukraine and the COVID-related lockdowns in China would have larger-than-expected effects on economic growth.
In their consideration of the appropriate stance of monetary policy, participants concurred that the labor market was very tight, inflation was well above the Committee's 2 percent inflation objective, and the near-term inflation outlook had deteriorated since the time of the May meeting. Against this backdrop, almost all participants agreed that it was appropriate to raise the target range for the federal funds rate 75 basis points at this meeting. One participant favored a 50 basis point increase in the target range at this meeting instead of 75 basis points. All participants judged that it was appropriate to continue the process of reducing the size of the Federal Reserve's balance sheet, as described in the Plans for Reducing the Size of the Federal Reserve's Balance Sheet that the Committee issued in May. In light of elevated inflation pressures and signs of deterioration in some measures of inflation expectations, all participants reaffirmed their strong commitment to returning inflation to the Committee's 2 percent objective. Participants observed that a return of inflation to the 2 percent objective was necessary for creating conditions conducive to a sustainably strong labor market over time.
In discussing potential policy actions at upcoming meetings, participants continued to anticipate that ongoing increases in the target range for the federal funds rate would be appropriate to achieve the Committee's objectives. In particular, participants judged that an increase of 50 or 75 basis points would likely be appropriate at the next meeting. Participants concurred that the economic outlook warranted moving to a restrictive stance of policy, and they recognized the possibility that an even more restrictive stance could be appropriate if elevated inflation pressures were to persist.
Participants noted that, with the federal funds rate expected to be near or above estimates of its longer-run level later this year, the Committee would then be well positioned to determine the appropriate pace of further policy firming and the extent to which economic developments warranted policy adjustments. They also remarked that the pace of rate increases and the extent of future policy tightening would depend on the incoming data and the evolving outlook for the economy. Many participants noted that the Committee's credibility with regard to bringing inflation back to the 2 percent objective, together with previous communications, had been helpful in shifting market expectations of future policy and had already contributed to a notable tightening of financial conditions that would likely help reduce inflation pressures by restraining aggregate demand. Participants recognized that ongoing policy firming would be appropriate if economic conditions evolved as expected.
At the current juncture, with inflation remaining well above the Committee's objective, participants remarked that moving to a restrictive stance of policy was required to meet the Committee's legislative mandate to promote maximum employment and price stability. In addition, such a stance would be appropriate from a risk management perspective because it would put the Committee in a better position to implement more restrictive policy if inflation came in higher than expected. Many participants judged that a significant risk now facing the Committee was that elevated inflation could become entrenched if the public began to question the resolve of the Committee to adjust the stance of policy as warranted. On this matter, participants stressed that appropriate firming of monetary policy, together with clear and effective communications, would be essential in restoring price stability.
Participants remarked that developments associated with Russia's invasion of Ukraine, the COVID-related lockdowns in China, and other factors restraining supply conditions would affect the inflation outlook and that it would likely take some time for inflation to move down to the Committee's 2 percent objective. Participants also judged that maintaining a strong labor market during the process of bringing inflation down to 2 percent would depend on many factors affecting demand and supply. Participants recognized that policy firming could slow the pace of economic growth for a time, but they saw the return of inflation to 2 percent as critical to achieving maximum employment on a sustained basis.
emphasis added


