by Calculated Risk on 7/13/2022 12:55:00 PM
Wednesday, July 13, 2022
Lawler on Demographics: Observations and Updated Population Projections
Today, in the Calculated Risk Real Estate Newsletter: Lawler on Demographics: Observations and Updated Population Projections
A brief excerpt:
CR Note: This is a technical post, but the key take away for housing is: “the “demographics” are not nearly as positive over the next several years as the Census 2017 projections would have suggested.”There is much more in the article. You can subscribe at https://calculatedrisk.substack.com/
Way back in 2015, I projected a surge in homebuying in the 2020s based on demographics. The surge has happened, but the demographics are not as positive as originally predicted. Many analysts are repeating my earlier analysis without adjusting for less net international migration (NIM), and more deaths.
From housing economist Tom Lawler:
Analysts who rely on US population projections (total and by characteristics) to project other economic variables (including those housing related) have been frustrated by the lack of any credible official projections. The last official intermediate and long term population projections from Census was done in 2017, and (which I’ve written about before) those projections significantly over-predicted US births, significantly under-predicted deaths, and significantly over-predicted net international migration (NIM). On the latter score it’s not clear the extent of the over-prediction of NIM in the Census 2017 projections, as Census has not released updated NIM estimates for the 2010-2020 period. The last such NIM estimates were in the “Vintage 2020” population estimates, which did NOT incorporate the Census 2020 results, and the Vintage 2020 population estimate for April 1, 2020 was about 2.05 million below the Census 2020 tally. Presumably most of the Vintage 2020 “miss” reflected higher NIM over the past decade than that shown in the Vintage 2020 estimates, though the yearly differences in NIM are unknown, and Census has not yet released updated intercensal population estimates for the 2010-2020 period that are consistent with the Census 2020 results.
... some analysts like to look at projections of the number of 30 to 39 year olds, as that age group would likely include a large number of potential first-time home buyers. The Census 2017 Projections predicted that from July 1, 2020 to July 1, 2025 the number of 30-39 year olds would increase by 2,571,433, with a 697,200 increase in 2021. This updated projection has the number of 30-39 year olds increasing by only a third of that amount (864,670), with a 291,209 increase (from Vintage 2021) in 2021. The reasons for the big differences are (1) a different starting age distribution; (2) significantly higher deaths; and (3) significantly lower NIM. Obviously, the “demographics” are not nearly as positive over the next several years as the Census 2017 projections would have suggested.
Cleveland Fed: Median CPI increased 0.7% and Trimmed-mean CPI increased 0.8% in June
by Calculated Risk on 7/13/2022 11:41:00 AM
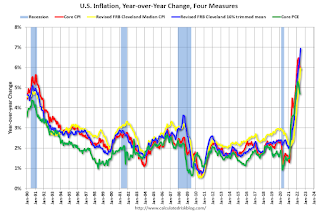
The Cleveland Fed released the median CPI and the trimmed-mean CPI this morning:
According to the Federal Reserve Bank of Cleveland, the median Consumer Price Index rose 0.7% in June. The 16% trimmed-mean Consumer Price Index increased 0.8% in June. "The median CPI and 16% trimmed-mean CPI are measures of core inflation calculated by the Federal Reserve Bank of Cleveland based on data released in the Bureau of Labor Statistics’ (BLS) monthly CPI report".
Note: The Cleveland Fed released the median CPI details here: "Motor Fuel" increased at 251% annualized rate in June!
 Click on graph for larger image.
This graph shows the year-over-year change for these four key measures of inflation.
Early Look at 2023 Cost-Of-Living Adjustments and Maximum Contribution Base
by Calculated Risk on 7/13/2022 09:14:00 AM
The BLS reported this morning:
The Consumer Price Index for Urban Wage Earners and Clerical Workers (CPI-W) increased 9.8 percent over the last 12 months to an index level of 292.542 (1982-84=100). For the month, the index rose 1.6 percent prior to seasonal adjustment.CPI-W is the index that is used to calculate the Cost-Of-Living Adjustments (COLA). The calculation dates have changed over time (see Cost-of-Living Adjustments), but the current calculation uses the average CPI-W for the three months in Q3 (July, August, September) and compares to the average for the highest previous average of Q3 months. Note: this is not the headline CPI-U and is not seasonally adjusted (NSA).
• In 2021, the Q3 average of CPI-W was 268.421.
The 2021 Q3 average was the highest Q3 average, so we only have to compare Q3 this year to last year.
 Click on graph for larger image.
This graph shows CPI-W since January 2000. The red lines are the Q3 average of CPI-W for each year.
Note: The year labeled is for the calculation, and the adjustment is effective for December of that year (received by beneficiaries in January of the following year).
CPI-W was up 9.8% year-over-year in June, and although this is very early - we need the data for July, August and September - my very early guess is COLA will probably be over 9% this year - and COLA could be double digits - the largest increase since 11.2% in 1981.
The contribution base will be adjusted using the National Average Wage Index. This is based on a one-year lag. The National Average Wage Index is not available for 2021 yet, but wages probably increased again in 2021. If wages increased 4% in 2021, then the contribution base next year will increase to around $153,000 in 2023, from the current $147,000.
Remember - this is a very early look. What matters is average CPI-W, NSA, for all three months in Q3 (July, August and September).
BLS: CPI increased 1.3% in June; Core CPI increased 0.7%
by Calculated Risk on 7/13/2022 08:32:00 AM
The Consumer Price Index for All Urban Consumers (CPI-U) increased 1.3 percent in June on a seasonally adjusted basis after rising 1.0 percent in May, the U.S. Bureau of Labor Statistics reported today. Over the last 12 months, the all items index increased 9.1 percent before seasonal adjustment.The consensus was for 1.1% increase in CPI, and a 0.6% increase in core CPI. Both were above expectations. I'll post a graph later today after the Cleveland Fed releases the median and trimmed-mean CPI.
The increase was broad-based, with the indexes for gasoline, shelter, and food being the largest contributors. The energy index rose 7.5 percent over the month and contributed nearly half of the all items increase, with the gasoline index rising 11.2 percent and the other major component indexes also rising. The food index rose 1.0 percent in June, as did the food at home index.
The index for all items less food and energy rose 0.7 percent in June, after increasing 0.6 percent in the preceding two months. While almost all major component indexes increased over the month, the largest contributors were the indexes for shelter, used cars and trucks, medical care, motor vehicle insurance, and new vehicles. The indexes for motor vehicle repair, apparel, household furnishings and operations, and recreation also increased in June. Among the few major component indexes to decline in June were lodging away from home and airline fares.
The all items index increased 9.1 percent for the 12 months ending June, the largest 12-month increase since the period ending November 1981. The all items less food and energy index rose 5.9 percent over the last 12 months. The energy index rose 41.6 percent over the last year, the largest 12-month increase since the period ending April 1980. The food index increased 10.4 percent for the 12-months ending June, the largest 12-month increase since the period ending February 1981.
emphasis added
MBA: Mortgage Applications Decrease in Latest Weekly Survey
by Calculated Risk on 7/13/2022 07:00:00 AM
From the MBA: Mortgage Applications Decrease in Latest MBA Weekly Survey
— Mortgage applications decreased 1.7 percent from one week earlier, according to data from the Mortgage Bankers Association’s (MBA) Weekly Mortgage Applications Survey for the week ending July 8, 2022. This week’s results include an adjustment for the observance of Independence Day.
... The Refinance Index increased 2 percent from the previous week and was 80 percent lower than the same week one year ago. The seasonally adjusted Purchase Index decreased 4 percent from one week earlier. The unadjusted Purchase Index decreased 14 percent compared with the previous week and was 18 percent lower than the same week one year ago.
"Mortgage rates were mostly unchanged, but applications declined for the second straight week. Purchase applications for both conventional and government loans continue to be weaker due to the combination of much higher mortgage rates and the worsening economic outlook,” said Joel Kan, MBA’s Associate Vice President of Economic and Industry Forecasting. “After reaching a record $460,000 in March 2022, the average purchase loan size was $415,000 last week, pulled lower by the potential moderation of home-price growth and weaker purchase activity at the upper end of the market.”
Added Kan, “Refinance applications increased slightly last week, driven by an uptick in conventional and FHA refinances. The overall refinance index remained 5 percent below the average level reported in June. With the 30-year fixed rate 265 basis points higher than a year ago, refinance applications are expected to remain depressed.”
...
The average contract interest rate for 30-year fixed-rate mortgages with conforming loan balances ($647,200 or less) remained at 5.74 percent, with points decreasing to 0.59 from 0.65 (including the origination fee) for 80 percent loan-to-value ratio (LTV) loans.
emphasis added
 Click on graph for larger image.
The first graph shows the refinance index since 1990.
 According to the MBA, purchase activity is down 18% year-over-year unadjusted.
Note: Red is a four-week average (blue is weekly).
Tuesday, July 12, 2022
Wednesday: CPI, Beige Book
by Calculated Risk on 7/12/2022 09:01:00 PM
Wednesday:
• At 7:00 AM ET, The Mortgage Bankers Association (MBA) will release the results for the mortgage purchase applications index.
• At 8:30 AM, The Consumer Price Index for June from the BLS. The consensus is for a 1.1% increase in CPI, and a 0.6% increase in core CPI. The consensus is for CPI to be up 8.8% year-over-year and core CPI to be up 5.8% YoY.
• At 2:00 PM, the Federal Reserve Beige Book, an informal review by the Federal Reserve Banks of current economic conditions in their Districts.
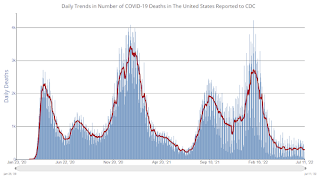
On COVID (focus on hospitalizations and deaths):
| COVID Metrics | ||||
|---|---|---|---|---|
| Now | Week Ago | Goal | ||
| Percent fully Vaccinated | 67.0% | --- | ≥70.0%1 | |
| Fully Vaccinated (millions) | 222.5 | --- | ≥2321 | |
| New Cases per Day3🚩 | 118,026 | 105,890 | ≤5,0002 | |
| Hospitalized3🚩 | 31,036 | 28,508 | ≤3,0002 | |
| Deaths per Day3 | 306 | 325 | ≤502 | |
| 1 Minimum to achieve "herd immunity" (estimated between 70% and 85%). 2my goals to stop daily posts, 37-day average for Cases, Currently Hospitalized, and Deaths 🚩 Increasing 7-day average week-over-week for Cases, Hospitalized, and Deaths ✅ Goal met. | ||||
 Click on graph for larger image.
This graph shows the daily (columns) and 7-day average (line) of deaths reported.
Leading Index for Commercial Real Estate "Slight Gain In June"
by Calculated Risk on 7/12/2022 02:19:00 PM
From Dodge Data Analytics: Dodge Momentum Index Hits 14-Year High With Slight Gain In June
The Dodge Momentum Index (DMI) increased less than one percentage point in June to 173.6 (2000=100) from the revised May reading of 173.1, pushing the measure to a 14-year high.
The Momentum Index, issued by Dodge Construction Network, is a monthly measure of the initial report for nonresidential building projects in planning. The index is shown to lead construction spending for nonresidential buildings by a full year. In June, the commercial component of the Momentum Index rose 4.1%, while the institutional component fell 6.2%.
emphasis added
 Click on graph for larger image.
This graph shows the Dodge Momentum Index since 2002. The index was at 173.6 in June, up from 173.1 in May.
According to Dodge, this index leads "construction spending for nonresidential buildings by a full year". This index suggested a decline in Commercial Real Estate construction through most of 2021, but a solid pickup this year and into 2023.
2nd Look at Local Housing Markets in June, Sales Down Sharply Year-over-year
by Calculated Risk on 7/12/2022 11:10:00 AM
Today, in the Calculated Risk Real Estate Newsletter: 2nd Look at Local Housing Markets in June
A brief excerpt:
We are seeing a significant change in inventory, and maybe a pickup in new listings. So far, most of the increase in inventory has been due to softer demand - likely because of higher mortgage rates - but we need to keep an eye on new listings too.There is much more in the article. You can subscribe at https://calculatedrisk.substack.com/
We are also seeing a sharp decline in closings in June, and this might be due to buyers cancelling escrow because of the increase in mortgage rates. Here is a table comparing the year-over-year Not Seasonally Adjusted (NSA) declines in sales this year from the National Association of Realtors® (NAR) with the local markets I track. So far, these measures have tracked closely, and the preliminary data below suggests a sharp decline in sales in June.
On cancellations, Lily Katz and Ben Walzer at Redfin wrote yesterday: The Deal Is Off: Home Sales Are Getting Canceled at the Highest Rate Since the Start of the Pandemic
Nationwide, roughly 60,000 home-purchase agreements fell through in June, equal to 14.9% of homes that went under contract that month. That’s the highest percentage on record with the exception of March and April 2020, when the housing market all but ground to a halt due to the onset of the coronavirus pandemic. It compares with 12.7% a month earlier and 11.2% a year earlier.
Reis: Office Vacancy Rate Increased in Q2, Mall Vacancy Rate Unchanged
by Calculated Risk on 7/12/2022 08:11:00 AM
From Moody’s Analytics Senior Economist Lu Chen: Apartment sets new record, Office continued its bumpy ride, and Retail stayed flat
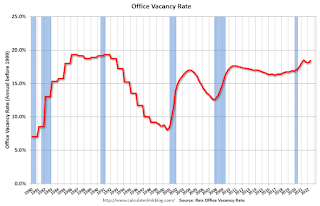
Given the intriguing supply and demand dynamics, office vacancy trended up 30 bps and finished the2nd quarter at 18.4%, merely 10 bps lower than its pandemic high in Q2 2021. On the rent front, both asking and effective rents edged up 0.4% during the quarter – these are the highest growth rates since the pandemic began. .
...
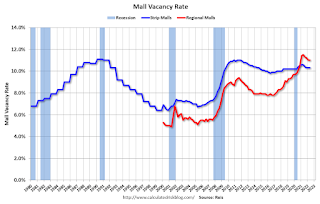
Our data shows the national vacancy for neighborhood and community shopping center has stayed flat at 10.3%, while asking rent is virtually unchanged and effective rent inched up 0.1% in the second quarter. Trend data on regional and super regional malls tells a similar story. Vacancy stayed flat at 11% and effective rent was up 0.1% this quarter.
emphasis added
 Click on graph for larger image.
This graph shows the office vacancy rate starting in 1980 (prior to 1999 the data is annual).
Reis also reported that office effective rents were increased 0.4% in Q2; rents are about at the same as in early 2019.
For Neighborhood and Community malls (strip malls), the vacancy rate was 10.3% in Q2, unchanged from 10.3% in Q1, and down from 10.6% in Q2 2021. For strip malls, the vacancy rate peaked during the pandemic at 10.6% in both Q1 and Q2 2021.
 This graph shows the strip mall vacancy rate starting in 1980 (prior to 2000 the data is annual). The regional mall data starts in 2000. Back in the '80s, there was overbuilding in the mall sector even as the vacancy rate was rising. This was due to the very loose commercial lending that led to the S&L crisis.
 In the mid-'00s, mall investment picked up as mall builders followed the "roof tops" of the residential boom (more loose lending). This led to the vacancy rate moving higher even before the recession started. Then there was a sharp increase in the vacancy rate during the recession and financial crisis.
In the last several years, even prior to the pandemic, the regional mall vacancy rates increased significantly from an already elevated level.
Monday, July 11, 2022
Key Week for Inflation and Mortgage Rates
by Calculated Risk on 7/11/2022 09:31:00 PM

Ultimately, the week will depend on the outcome of several inflation reports. The first one, Wednesday's CPI, is also by far the most important. Producer prices follow on Thursday and the inflation expectation component of the Consumer Sentiment data hit on Friday morning. If CPI hasn't already sent a strong enough message by mid-week, this trifecta of reports should go a long way toward helping the market pick a winner between 50bps and 75bps for the next Fed rate hike. It should also offer a strong comment on how high or low the ceiling should be for the trading range in bond yields. [30 year fixed 5.77%]Tuesday:
emphasis added
• At 6:00 AM ET, NFIB Small Business Optimism Index for June.
On COVID (focus on hospitalizations and deaths):
| COVID Metrics | ||||
|---|---|---|---|---|
| Now | Week Ago | Goal | ||
| Percent fully Vaccinated | 67.0% | --- | ≥70.0%1 | |
| Fully Vaccinated (millions) | 222.5 | --- | ≥2321 | |
| New Cases per Day3 | 103,907 | 112,666 | ≤5,0002 | |
| Hospitalized3🚩 | 28,320 | 28,238 | ≤3,0002 | |
| Deaths per Day3 | 281 | 352 | ≤502 | |
| 1 Minimum to achieve "herd immunity" (estimated between 70% and 85%). 2my goals to stop daily posts, 37-day average for Cases, Currently Hospitalized, and Deaths 🚩 Increasing 7-day average week-over-week for Cases, Hospitalized, and Deaths ✅ Goal met. | ||||
 Click on graph for larger image.
This graph shows the daily (columns) and 7-day average (line) of deaths reported.


