 RSS Feed
 by Calculated Risk on 7/17/2022 08:15:00 PM
Sunday, July 17, 2022
Monday: Homebuilder Survey
Weekend:
• Schedule for Week of July 17, 2022
Monday:
• At 10:00 AM ET, The July NAHB homebuilder survey. The consensus is for a reading of 66, down from 67. Any number above 50 indicates that more builders view sales conditions as good than poor.
From CNBC: Pre-Market Data and Bloomberg futures S&P 500 are up 9 and DOW futures are up 50 (fair value).
Oil prices were down over the last week with WTI futures at $97.26 per barrel and Brent at $100.85 per barrel. A year ago, WTI was at $72, and Brent was at $74 - so WTI oil prices are up 35% year-over-year.
Here is a graph from Gasbuddy.com for nationwide gasoline prices. Nationally prices are at $4.50 per gallon. A year ago, prices were at $3.15 per gallon, so gasoline prices are up $1.35 per gallon year-over-year.
Record Single Family Investor Buying in Q1, Possible evidence of Slowdown in Q2
by Calculated Risk on 7/17/2022 09:58:00 AM
Today, in the Calculated Risk Real Estate Newsletter: Record Single Family Investor Buying in Q1, Possible evidence of Slowdown in Q2
A brief excerpt:
Housing economist Tom Lawler discusses the CoreLogic data: CoreLogic: Share of SF Homes Purchased by Investors Hit Record High in Q1/2022; Non-Investor Home Purchases Down Significantly YOYThere is much more in the article. You can subscribe at https://calculatedrisk.substack.com/
In its quarterly report on “investor” home buying activity, CoreLogic reported that SF homes purchased by “investors – defined as entities (individual or corporate) who retained at least three properties simultaneously within the last 10 years – increased to a record high of 27.6% in the first quarter of 2022, up from 24.8% in the fourth quarter of 2021 and 19.2% from the first quarter of 2021.
...
CR Notes: Investors pulling back could be a factor in less housing demand. Housing analyst Ivy Zelman said last week about non-primary buyers (edited slightly for clarity):
And we think about non-primary for those that you know, might not appreciate what that includes: second home buyers, private investors, institutional investors and the institutional investors could also incorporate what we call the intermediaries. Liquidity providers; iBuyers. So, there's been tremendous speculation and aggregate that number or the latest sort of first Q - we don't have two Q yet - aggregated to about 24% of transactions, and we think that's even understating it …
...
[We are seeing less] demand and seasonally worse than normal activity and increasing [cancellations] … And I do think the non-primary is a big factor.

Saturday, July 16, 2022
Real Estate Newsletter Articles this Week
by Calculated Risk on 7/16/2022 02:11:00 PM
At the Calculated Risk Real Estate Newsletter this week:
• Early Read on Existing Home Sales in June
• Current State of the Housing Market
• Lawler on Demographics: Observations and Updated Population Projections
• 2nd Look at Local Housing Markets in June
• Homebuilder Comments in June: “Someone turned out the lights on our sales in June!
• Apartment Vacancy Rate Declined in Q2
This is usually published 4 to 6 times a week and provides more in-depth analysis of the housing market.
You can subscribe at https://calculatedrisk.substack.com/
Most content is available for free (and no Ads), but please subscribe!
Schedule for Week of July 17, 2022
by Calculated Risk on 7/16/2022 08:11:00 AM
The key reports this week are June Housing Starts and Existing Home Sales.
10:00 AM: The July NAHB homebuilder survey. The consensus is for a reading of 66, down from 67. Any number above 50 indicates that more builders view sales conditions as good than poor.
 8:30 AM ET: Housing Starts for June.
 This graph shows single and total housing starts since 1968.
The consensus is for 1.586 million SAAR, up from 1.549 million SAAR in May.
7:00 AM ET: The Mortgage Bankers Association (MBA) will release the results for the mortgage purchase applications index.
 10:00 AM: Existing Home Sales for June from the National Association of Realtors (NAR). The consensus is for 5.40 million SAAR, down from 5.41 million last month.
The graph shows existing home sales from 1994 through the report last month.
Housing economist Tom Lawler expects the NAR to report sales of 5.12 million SAAR for June.
During the day: The AIA's Architecture Billings Index for June (a leading indicator for commercial real estate).
8:30 AM: The initial weekly unemployment claims report will be released. The consensus is for 235 thousand down from 244 thousand last week.
8:30 AM: the Philly Fed manufacturing survey for July. The consensus is for a reading of 5.5, up from -3.1.
10:00 AM: State Employment and Unemployment (Monthly) for June 2022
Friday, July 15, 2022
COVID July 15, 2022, Update on Cases, Hospitalizations and Deaths
by Calculated Risk on 7/15/2022 09:48:00 PM
On COVID (focus on hospitalizations and deaths):
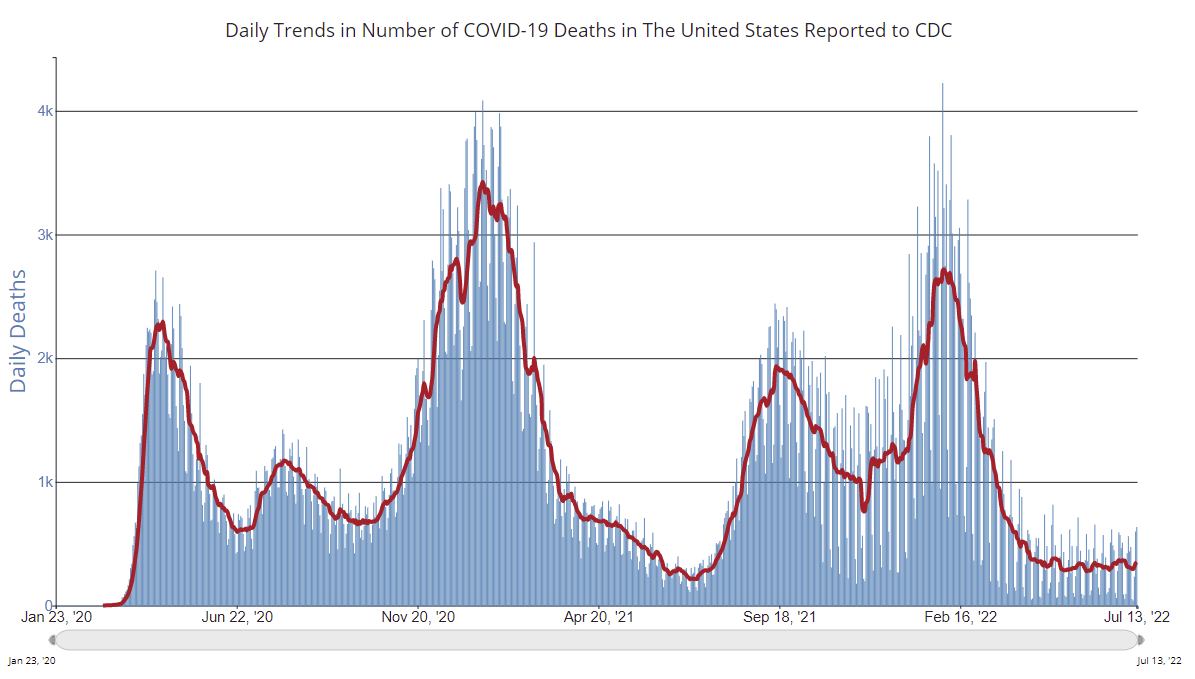
Hospitalizations have almost quadrupled from the lows in April 2022.
 Click on graph for larger image.
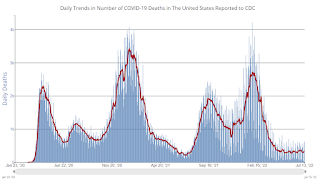
This graph shows the daily (columns) and 7-day average (line) of deaths reported.
| COVID Metrics | ||||
|---|---|---|---|---|
| Now | Week Ago | Goal | ||
| New Cases per Day2🚩 | 126,023 | 107,572 | ≤5,0001 | |
| Hospitalized2🚩 | 32,824 | 29,574 | ≤3,0001 | |
| Deaths per Day2🚩 | 348 | 320 | ≤501 | |
| 1my goals to stop daily posts, 27-day average for Cases, Currently Hospitalized, and Deaths 🚩 Increasing 7-day average week-over-week for Cases, Hospitalized, and Deaths ✅ Goal met. | ||||
 Click on graph for larger image.
This graph shows the daily (columns) and 7-day average (line) of deaths reported.
Average daily deaths bottomed in July 2021 at 214 per day.
Early Read on Existing Home Sales in June
by Calculated Risk on 7/15/2022 03:42:00 PM
Today, in the Calculated Risk Real Estate Newsletter: Early Read on Existing Home Sales in June
A brief excerpt:
From housing economist Tom Lawler:There is much more in the article. You can subscribe at https://calculatedrisk.substack.com/
Based on publicly available local realtor/MLS reports released across the country through today, I project that existing home sales as estimated by the National Association of Realtors ran at a seasonally adjusted annual rate of 5.12 million in June, down 5.4% from May’s preliminary pace and down 14.2% from last June’s seasonally adjusted pace.
...
CR Notes:
With a new holiday this year in June, Juneteenth, it is possible the seasonal adjustment will be off a little. However, the local markets I track suggest a significant year-over-year decline in NSA sales for June.
The National Association of Realtors® (NAR) is schedule to release June existing home sales on Wednesday, July 20th at 10:00 AM ET. The consensus is for 5.40 million SAAR, down from 5.41 million last month. Based on Tom Lawler’s estimate, we should expect a large negative surprise.
Q2 GDP Forecasts: Slightly Negative
by Calculated Risk on 7/15/2022 12:28:00 PM
Note: We've seen two consecutive quarters of negative GDP before without a recession (that isn't the definition). If Q2 is negative, it will mostly be due to inventory and trade issues. No worries. My view is the US economy is not currently in a recession, see: Predicting the Next Recession
From BofA:
Incoming data pushed our tracking estimate for 2Q growth lower by 0.3pp to -1.4% qoq saar [July 15 estimate]From Goldman:
emphasis added
We left our Q2 GDP tracking estimate unchanged at +0.7% (qoq ar). [July 15 estimate]And from the Altanta Fed: GDPNow
The GDPNow model estimate for real GDP growth (seasonally adjusted annual rate) in the second quarter of 2022 is -1.5 percent on July 15, down from -1.2 percent on July 8. [July 15 estimate]
Industrial Production Decreased 0.2 Percent in June
by Calculated Risk on 7/15/2022 09:21:00 AM
From the Fed: Industrial Production and Capacity Utilization
Total industrial production moved down 0.2 percent in June but advanced at an annual rate of 6.1 percent for the second quarter as a whole. Manufacturing output declined 0.5 percent for a second consecutive month in June; even so, it rose at an annual rate of 4.2 percent in the second quarter. In June, the index for mining advanced 1.7 percent, while the index for utilities fell 1.4 percent. At 104.4 percent of its 2017 average, total industrial production in June was 4.2 percent above its year-earlier level. Capacity utilization decreased 0.3 percentage point in June to 80.0 percent, a rate that is 0.4 percentage point above its long-run (1972–2021) average.
emphasis added
 Click on graph for larger image.
This graph shows Capacity Utilization. This series is up from the record low set in April 2020, and above the level in February 2020 (pre-pandemic).
Capacity utilization at 80.0% is 0.4% above the average from 1972 to 2021. This was below consensus expectations.
Note: y-axis doesn't start at zero to better show the change.
 The second graph shows industrial production since 1967.
Industrial production decreased in June to 105.7. This is above the pre-pandemic level.
The change in industrial production was below consensus expectations.
Retail Sales Increased 1.0% in June
by Calculated Risk on 7/15/2022 08:39:00 AM
On a monthly basis, retail sales increased 1.0% from May to June (seasonally adjusted), and sales were up 8.4 percent from June 2021.
From the Census Bureau report:
Advance estimates of U.S. retail and food services sales for June 2022, adjusted for seasonal variation and holiday and trading-day differences, but not for price changes, were $680.6 billion, an increase of 1.0 percent from the previous month, and 8.4 percent above June 2021. ... The April 2022 to May 2022 percent change was revised from down 0.3 percent to down 0.1 percent.
emphasis added
 Click on graph for larger image.
This graph shows retail sales since 1992. This is monthly retail sales and food service, seasonally adjusted (total and ex-gasoline).
Retail sales ex-gasoline were up 0.7% in June.
The second graph shows the year-over-year change in retail sales and food service (ex-gasoline) since 1993.
Retail and Food service sales, ex-gasoline, increased by 5.3% on a YoY basis.
 Sales in June were above expectations, and sales in April and May were revised up, combined.
Thursday, July 14, 2022
Friday: Retail Sales, Industrial Production, NY Fed Mfg
by Calculated Risk on 7/14/2022 09:06:00 PM
Friday:
• At 8:30 AM ET, Retail sales for June is scheduled to be released. The consensus is for 0.8% increase in retail sales.
• Also, at 8:30 AM, The New York Fed Empire State manufacturing survey for July. The consensus is for a reading of -2.6, down from -1.2.
• At 9:15 AM, The Fed will release Industrial Production and Capacity Utilization for June. The consensus is for a no change in Industrial Production, and for Capacity Utilization to decrease to 80.4%.
• At 10:00 AM, University of Michigan's Consumer sentiment index (Preliminary for July).
On COVID (focus on hospitalizations and deaths):
Hospitalizations have almost quadrupled from the lows earlier this year.
Click on graph for larger image.
This graph shows the daily (columns) and 7-day average (line) of deaths reported.
| COVID Metrics | ||||
|---|---|---|---|---|
| Now | Week Ago | Goal | ||
| New Cases per Day2🚩 | 124,048 | 107,174 | ≤5,0001 | |
| Hospitalized2🚩 | 32,507 | 29,099 | ≤3,0001 | |
| Deaths per Day2🚩 | 351 | 312 | ≤501 | |
| 1my goals to stop daily posts, 27-day average for Cases, Currently Hospitalized, and Deaths 🚩 Increasing 7-day average week-over-week for Cases, Hospitalized, and Deaths ✅ Goal met. | ||||
Click on graph for larger image.This graph shows the daily (columns) and 7-day average (line) of deaths reported.
Average daily deaths bottomed in July 2021 at 214 per day.


