 RSS Feed
 by Calculated Risk on 7/21/2022 03:37:00 PM
Thursday, July 21, 2022
Realtor.com Reports Weekly Inventory Up 29% Year-over-year
Realtor.com has monthly and weekly data on the existing home market. Here is their weekly report released yesterday from Chief Economist Danielle Hale: Weekly Housing Trends View — Data Week Ending July 16, 2022. Note: They have data on list prices, new listings and more, but this focus is on inventory.
• Active inventory continued to grow, rising 29% above one year ago. With fewer owners listing homes for sale this week and last, the rapid recent run-up in active inventory has stalled somewhat. Inventory was roughly even with last year’s levels at the beginning of May and the gains mounted each week until early July. Since then, the market has stabilized just shy of a 30% increase over year ago levels. This is a welcome improvement for shoppers, but the market still lags what was once normal.
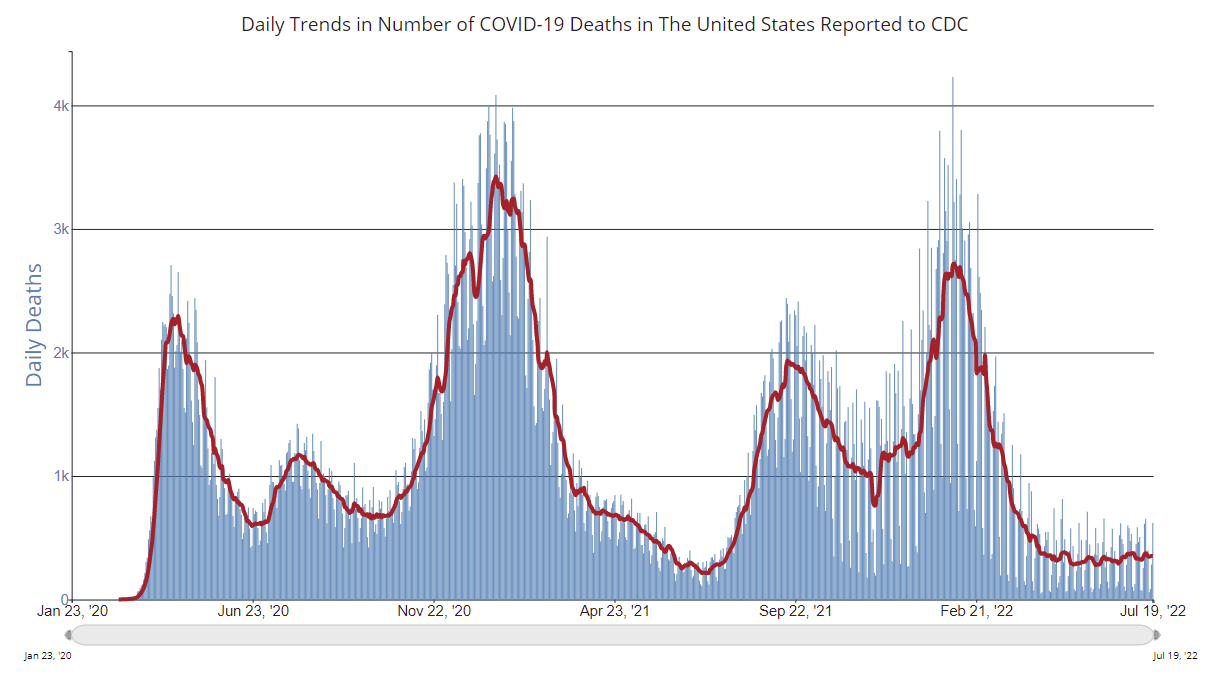
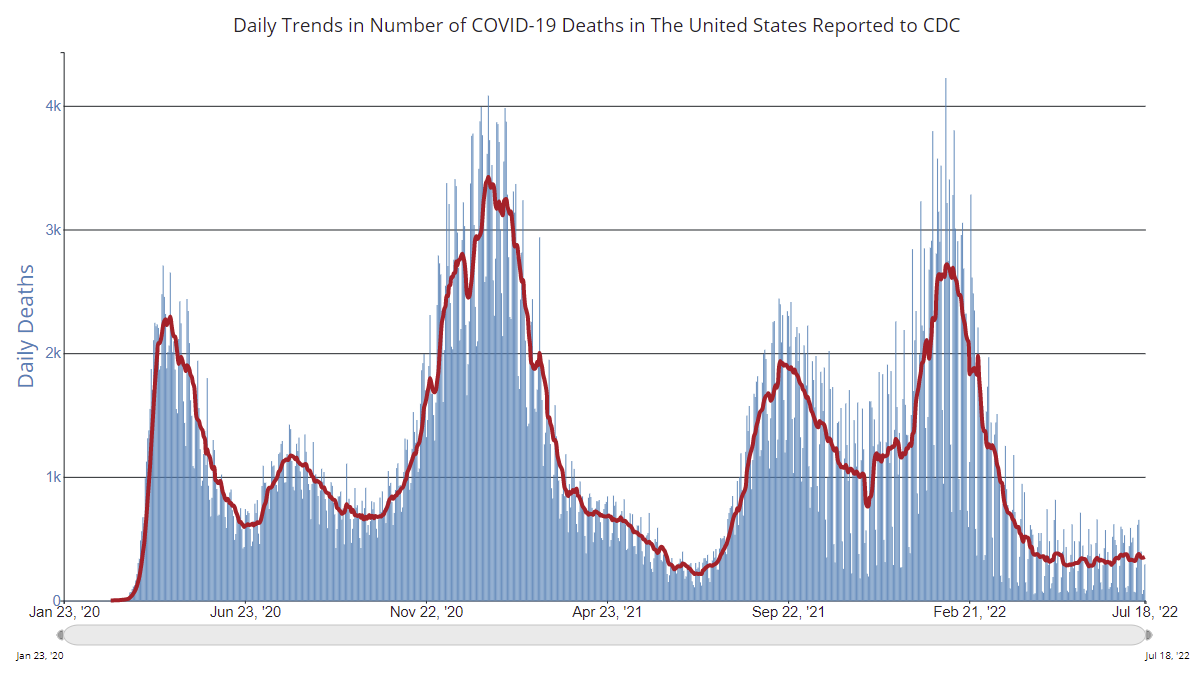
 Here is a graph of the year-over-year change in inventory according to realtor.com.
 Note the rapid increase in the YoY change, from down 30% at the beginning of the year, to up 29% YoY now.
However, the Realtor.com data has been stuck at up 29% YoY for 3 weeks in a row. This might be noise, or it might suggest a slowdown in inventory increases.
Final Look at Local Housing Markets in June, Inventory Up, Sales Down Sharply, New Listings Picking Up
by Calculated Risk on 7/21/2022 12:23:00 PM
Today, in the Calculated Risk Real Estate Newsletter: Final Look at Local Housing Markets in June
A brief excerpt:
And here is a table for new listings in June. For these areas, new listings were up 4.4% YoY.There is much more in the article. You can subscribe at https://calculatedrisk.substack.com/
Last month, new listings in these markets were up 5.9% YoY. New listings have increased over the last two months - new listing were down YoY as recently as April - but overall, we aren’t seeing a huge increase in new listings in these markets.
However, several markets are seeing a surge in new listings - Austin, Las Vegas, Phoenix and mid-Florida (Tampa, Orlando) are examples. A combination of less demand, and more new listings, is really pushing up inventory in these areas.
These are all formerly “hot” markets and perhaps some people are just trying to cash out in these markets after the huge increase in prices. Or it could be a leading indicator of more listings to come in other areas. This is something to watch.

NMHC: July Apartment Market Survey shows "Barely" Tighter Conditions
by Calculated Risk on 7/21/2022 10:29:00 AM
From the National Multifamily Housing Council (NMHC): Higher Interest Rates Begin to Impact Multifamily
Apartment sales volume fell while both equity and debt financing became more costly, according to the National Multifamily Housing Council’s Quarterly Survey of Apartment Market Conditions for July 2022. However, demand in most markets was still strong relative to supply.
“Continued interest rate hikes from the Fed have translated into higher longer-term rates and a higher cost of both debt and equity,” noted NMHC’s Chief Economist, Mark Obrinsky. “While these higher rates have cut into investor proceeds, many sellers are reluctant to lower prices, causing a sharp drop in sales volume.”
“The apartment market recorded its sixth consecutive quarter of tightening conditions, if just barely. Fifty-six percent of respondents reported unchanged conditions, while those reporting tighter conditions slightly outpaced those reporting looser market conditions.”
...
Market Tightness Index came in at 51, just above the breakeven level of 50. This indicates that market conditions have become tighter, albeit with considerable variation by market. Twenty-three percent of respondents reported markets to be tighter than three months ago compared to 21% of respondents who observed looser conditions in the markets they watch. Meanwhile, over half of respondents (56%) thought that apartment market conditions were unchanged from last quarter.

Click on graph for larger image.
This graph shows the quarterly Apartment Tightness Index. Any reading above 50 indicates tighter conditions from the previous quarter.
Even though the index declined in July, this indicates market conditions tightened slightly in July for the sixth consecutive quarter.
This suggests rent growth will slow.
Weekly Initial Unemployment Claims Increase to 251,000
by Calculated Risk on 7/21/2022 08:34:00 AM
The DOL reported:
In the week ending July 16, the advance figure for seasonally adjusted initial claims was 251,000, an increase of 7,000 from the previous week's unrevised level of 244,000. The 4-week moving average was 240,500, an increase of 4,500 from the previous week's revised average. The previous week's average was revised up by 250 from 235,750 to 236,000.The following graph shows the 4-week moving average of weekly claims since 1971.
emphasis added
 Click on graph for larger image.
The dashed line on the graph is the current 4-week average. The four-week average of weekly unemployment claims increased to 240,500.
The previous week was unrevised.
Weekly claims were higher than the consensus forecast.
Wednesday, July 20, 2022
Thursday: Unemployment Claims, Philly Fed Mfg
by Calculated Risk on 7/20/2022 09:39:00 PM
Thursday:
• At 8:30 AM ET, The initial weekly unemployment claims report will be released. The consensus is for 235 thousand down from 244 thousand last week.
• Also at 8:30 AM, the Philly Fed manufacturing survey for July. The consensus is for a reading of 5.5, up from -3.1.
On COVID (focus on hospitalizations and deaths):
Hospitalizations have almost quadrupled from the lows in April 2022.
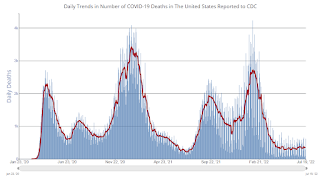 Click on graph for larger image.
This graph shows the daily (columns) and 7-day average (line) of deaths reported.
| COVID Metrics | ||||
|---|---|---|---|---|
| Now | Week Ago | Goal | ||
| New Cases per Day2🚩 | 126,018 | 123,525 | ≤5,0001 | |
| Hospitalized2🚩 | 34,511 | 32,288 | ≤3,0001 | |
| Deaths per Day2 | 353 | 366 | ≤501 | |
| 1my goals to stop daily posts, 27-day average for Cases, Currently Hospitalized, and Deaths 🚩 Increasing 7-day average week-over-week for Cases, Hospitalized, and Deaths ✅ Goal met. | ||||
 Click on graph for larger image.
This graph shows the daily (columns) and 7-day average (line) of deaths reported.
Average daily deaths bottomed in July 2021 at 214 per day.
AIA: Architecture Billings Index shows "increasing demand" in June
by Calculated Risk on 7/20/2022 01:33:00 PM
Note: This index is a leading indicator primarily for new Commercial Real Estate (CRE) investment.
From the AIA: Architecture Billings Index continues to stabilize but remains healthy
Architecture firms reported increasing demand for design services in June, according to a new report today from The American Institute of Architects (AIA).
The ABI score for June was 53.2. While this score is down slightly from May’s score of 53.5, it still indicates moderately strong business conditions overall (any score above 50 indicates an increase in billings from the prior month). Also in June, both the new project inquiries and design contracts indexes moderated from May but continued to show growth, posting scores of 58.2 and 52.2 respectively.
“Ongoing project activity at architecture firms as well as new work coming online remains strong, pushing project backlogs up to seven months on average nationally,” said AIA Chief Economist, Kermit Baker, Hon. AIA, PhD. “In spite of heavy workloads, employment at architecture firms has stabilized, suggesting that adding new employees is becoming even more challenging as the building construction sector continues to recover.”
...
• Regional averages: West (57.8); Midwest (54.8); South (51.5); Northeast (48.7)
• Sector index breakdown: institutional (53.5); mixed practice (52.8); multi-family residential (52.6); commercial/industrial (52.5)
emphasis added
 Click on graph for larger image.
This graph shows the Architecture Billings Index since 1996. The index was at 53.2 in June, down from 53.5 in May. Anything above 50 indicates expansion in demand for architects' services.
Note: This includes commercial and industrial facilities like hotels and office buildings, multi-family residential, as well as schools, hospitals and other institutions.
This index has been positive for 17 consecutive months. This index usually leads CRE investment by 9 to 12 months, so this index suggests a pickup in CRE investment in 2022 and into 2023.
More Analysis on June Existing Home Sales
by Calculated Risk on 7/20/2022 10:54:00 AM
Today, in the CalculatedRisk Real Estate Newsletter: NAR: Existing-Home Sales Decreased to 5.12 million SAAR in June
Excerpt:
Sales in June (5.12 million SAAR) were down 5.4% from the previous month and were 14.2% below the June 2021 sales rate. Sales are now below pre-pandemic levels.There is much more in the article. You can subscribe at https://calculatedrisk.substack.com/ (Most content is available for free, so please subscribe).
...
The second graph shows existing home sales by month for 2021 and 2022.
Sales declined 14.2% year-over-year compared to June 2021. This was the tenth consecutive month with sales down year-over-year.
...
Key point on Timing of Sales
Existing home sales are reported when the transaction closes. Sales in June were mostly for contracts signed in April and May. Recent data shows a significant slowdown in activity starting in May and decelerating further in June.
My sense is contracts for sales really declined in June, and that will show up as closed sales in July and August - so we should expect a further decline in existing home sales over the next few months.

NAR: Existing-Home Sales Decreased to 5.12 million SAAR in June
by Calculated Risk on 7/20/2022 10:13:00 AM
From the NAR: Existing-Home Sales Slid 5.4% in June
Existing-home sales dropped for the fifth straight month in June, according to the National Association of REALTORS®. Three out of four major U.S. regions experienced month-over-month sales declines and one region held steady. Year-over-year sales sank in all four regions.
Total existing-home sales, completed transactions that include single-family homes, townhomes, condominiums and co-ops, dipped 5.4% from May to a seasonally adjusted annual rate of 5.12 million in June. Year-over-year, sales fell 14.2% (5.97 million in June 2021).
...
Total housing inventory registered at the end of June was 1,260,000 units, an increase of 9.6% from May and a 2.4% rise from the previous year (1.23 million). Unsold inventory sits at a 3.0-month supply at the current sales pace, up from 2.6 months in May and 2.5 months in June 2021.
emphasis added
 Click on graph for larger image.
This graph shows existing home sales, on a Seasonally Adjusted Annual Rate (SAAR) basis since 1993.
Sales in June (5.12 million SAAR) were down 5.4% from the previous month and were 14.2% below the June 2021 sales rate.
The second graph shows nationwide inventory for existing homes.
 According to the NAR, inventory increased to 1.26 million in June from 1.15 million in May.
Headline inventory is not seasonally adjusted, and inventory usually decreases to the seasonal lows in December and January, and peaks in mid-to-late summer.
The last graph shows the year-over-year (YoY) change in reported existing home inventory and months-of-supply. Since inventory is not seasonally adjusted, it really helps to look at the YoY change. Note: Months-of-supply is based on the seasonally adjusted sales and not seasonally adjusted inventory.
 Inventory was up 2.4% year-over-year (blue) in June compared to June 2021.
Months of supply (red) increased to 3.0 months in June from 2.6 months in May.
This was well below the consensus forecast. I'll have more later.
The last graph shows the year-over-year (YoY) change in reported existing home inventory and months-of-supply. Since inventory is not seasonally adjusted, it really helps to look at the YoY change. Note: Months-of-supply is based on the seasonally adjusted sales and not seasonally adjusted inventory.
 Inventory was up 2.4% year-over-year (blue) in June compared to June 2021.
 Months of supply (red) increased to 3.0 months in June from 2.6 months in May.
This was well below the consensus forecast. I'll have more later.
MBA: Mortgage Applications Decrease in Latest Weekly Survey
by Calculated Risk on 7/20/2022 07:00:00 AM
From the MBA: Mortgage Applications Decrease in Latest MBA Weekly Survey
Mortgage applications decreased 6.3 percent from one week earlier, according to data from the Mortgage Bankers Association’s (MBA) Weekly Mortgage Applications Survey for the week ending July 15, 2022.
... The Refinance Index decreased 4 percent from the previous week and was 80 percent lower than the same week one year ago. The seasonally adjusted Purchase Index decreased 7 percent from one week earlier. The unadjusted Purchase Index increased 16 percent compared with the previous week and was 19 percent lower than the same week one year ago.
“Mortgage applications declined for the third week in a row, reaching the lowest level since 2000. Similarly, with most mortgage rates more than two percentage points higher than a year ago, demand for refinances continues to plummet, with MBA’s refinance index also falling to a 22-year low,” said Joel Kan, MBA’s Associate Vice President of Economic and Industry Forecasting. “Purchase activity declined for both conventional and government loans, as the weakening economic outlook, high inflation, and persistent affordability challenges are impacting buyer demand. The decline in recent purchase applications aligns with slower homebuilding activity due to reduced buyer traffic and ongoing building material shortages and higher costs.”
...
The average contract interest rate for 30-year fixed-rate mortgages with conforming loan balances ($647,200 or less) increased to 5.82 percent from 5.74 percent, with points increasing to 0.65 from 0.59 (including the origination fee) for 80 percent loan-to-value ratio (LTV) loans.
emphasis added
 Click on graph for larger image.
The first graph shows the refinance index since 1990.
With higher mortgage rates, the refinance index has declined sharply over the last several months.
The refinance index is at the lowest level since the year 2000.
The second graph shows the MBA mortgage purchase index
 According to the MBA, purchase activity is down 19% year-over-year unadjusted.
The purchase index is now only 14% above the pandemic low.
Note: Red is a four-week average (blue is weekly).
Note: Red is a four-week average (blue is weekly).
Tuesday, July 19, 2022
Wednesday: Existing Home Sales
by Calculated Risk on 7/19/2022 11:33:00 PM
Wednesday:
• At 7:00 AM ET, The Mortgage Bankers Association (MBA) will release the results for the mortgage purchase applications index.
• At 10:00 AM, Existing Home Sales for June from the National Association of Realtors (NAR). The consensus is for 5.40 million SAAR, down from 5.41 million last month. Housing economist Tom Lawler expects the NAR to report sales of 5.12 million SAAR for June.
• During the day: The AIA's Architecture Billings Index for June (a leading indicator for commercial real estate).
On COVID (focus on hospitalizations and deaths):
Hospitalizations have almost quadrupled from the lows in April 2022.
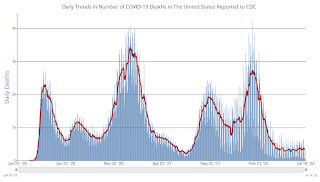 Click on graph for larger image.
This graph shows the daily (columns) and 7-day average (line) of deaths reported.
| COVID Metrics | ||||
|---|---|---|---|---|
| Now | Week Ago | Goal | ||
| New Cases per Day2🚩 | 123,639 | 121,347 | ≤5,0001 | |
| Hospitalized2🚩 | 34,061 | 31,685 | ≤3,0001 | |
| Deaths per Day2🚩 | 352 | 343 | ≤501 | |
| 1my goals to stop daily posts, 27-day average for Cases, Currently Hospitalized, and Deaths 🚩 Increasing 7-day average week-over-week for Cases, Hospitalized, and Deaths ✅ Goal met. | ||||
 Click on graph for larger image.
This graph shows the daily (columns) and 7-day average (line) of deaths reported.
Average daily deaths bottomed in July 2021 at 214 per day.


