 RSS Feed
 by Calculated Risk on 7/25/2022 09:05:00 AM
Monday, July 25, 2022
Housing Inventory July 25th Update: Up 30.5% Year-over-year
Inventory is increasing rapidly. Inventory bottomed seasonally at the beginning of March 2022 and is now up 118% since then. More than double!
Altos reports inventory is up 30.5% year-over-year and is now 20.2% above the peak last year.
 Click on graph for larger image.
This inventory graph is courtesy of Altos Research.
 Click on graph for larger image.
This inventory graph is courtesy of Altos Research.
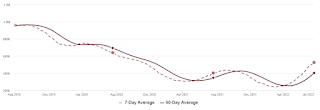
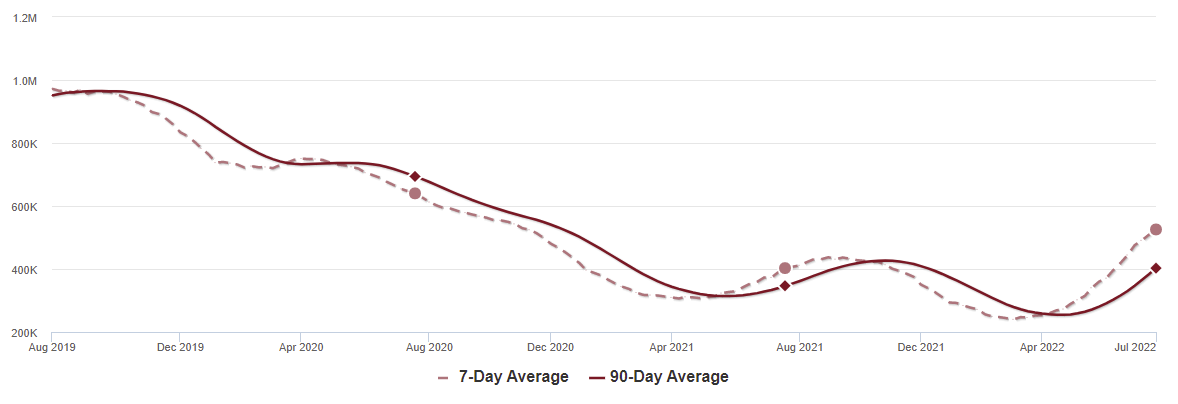
As of July 22nd, inventory was at 526 thousand (7-day average), compared to 509 thousand the prior week.
Inventory was up 3.3% from the previous week. Inventory is increasing much faster than normal for this time of year (both in percentage terms and in total inventory added).
Inventory is still historically low. Compared to the same week in 2021, inventory is up 30.5% from 403 thousand, however compared to the same week in 2020 inventory is down 17.9% from 640 thousand. Compared to 3 years ago, inventory is down 45.8% from 969 thousand.
Here are the inventory milestones I’m watching for with the Altos data:
1. The seasonal bottom (happened on March 4th for Altos) ✅
2. Inventory up year-over-year (happened on May 13th for Altos) ✅
3. Inventory up compared to two years ago (currently down 17.9% according to Altos)
4. Inventory up compared to 2019 (currently down 45.8%).
1. The seasonal bottom (happened on March 4th for Altos) ✅
2. Inventory up year-over-year (happened on May 13th for Altos) ✅
3. Inventory up compared to two years ago (currently down 17.9% according to Altos)
4. Inventory up compared to 2019 (currently down 45.8%).

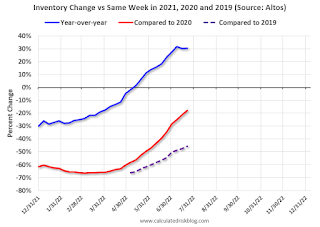
Here is a graph of the inventory change vs 2021, 2020 (milestone 3 above) and 2019 (milestone 4).
The blue line is the year-over-year data, the red line is compared to two years ago, and dashed purple is compared to 2019.
Two years ago (in 2020) inventory was declining all year, so the two-year comparison will get easier all year.
Based on the recent increases in inventory, my current estimate is inventory will be up compared to 2020 in late August of this year (next month), and back to 2019 levels at the beginning of 2023.
Mike Simonsen discusses this data regularly on Youtube.
Five High Frequency Indicators for the Economy
by Calculated Risk on 7/25/2022 08:16:00 AM
These indicators are mostly for travel and entertainment. It is interesting to watch these sectors recover as the pandemic subsides. Notes: I've added back gasoline supplied to see if there is an impact from higher gasoline prices. Apple has discontinued "Apple mobility", and restaurant traffic is mostly back to normal.
The TSA is providing daily travel numbers.
This data is as of July 24th.
 Click on graph for larger image.
This data shows the 7-day average of daily total traveler throughput from the TSA for 2019 (Light Blue), 2020 (Black), 2021 (Blue) and 2022 (Red).
The dashed line is the percent of 2019 for the seven-day average.
The 7-day average is down 12.1% from the same day in 2019 (87.9% of 2019). (Dashed line)
Air travel - as a percent of 2019 - has been moving sideways over the last several months, off about 10% from 2019 - with some ups and downs, usually related to the timing of holidays.
 This data shows domestic box office for each week and the median for the years 2016 through 2019 (dashed light blue).
 Black is 2020, Blue is 2021 and Red is 2022.
The data is from BoxOfficeMojo through July 21st.
Note that the data is usually noisy week-to-week and depends on when blockbusters are released.
Movie ticket sales were at $206 million last week, down about 18% from the median for the week.
Note that the data is usually noisy week-to-week and depends on when blockbusters are released.
Movie ticket sales were at $206 million last week, down about 18% from the median for the week.
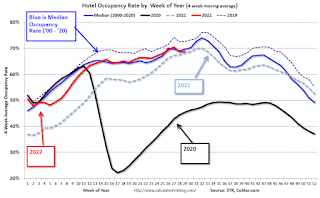
 This graph shows the seasonal pattern for the hotel occupancy rate using the four-week average.
 The red line is for 2022, black is 2020, blue is the median, and dashed light blue is for 2021. Dashed purple is 2019 (STR is comparing to a strong year for hotels).
This data is through July 16th. The occupancy rate was down 7.4% compared to the same week in 2019.
The 4-week average of the occupancy rate is close to the median rate for the previous 20 years (Blue).
Notes: Y-axis doesn't start at zero to better show the seasonal change.
Notes: Y-axis doesn't start at zero to better show the seasonal change.

This graph, based on weekly data from the U.S. Energy Information Administration (EIA), shows gasoline supplied compared to the same week of 2019.
Blue is for 2020. Purple is for 2021, and Red is for 2022.
As of July 15th, gasoline supplied was down 7.5% compared to the same week in 2019.
Recently gasoline supplied has been running somewhat below 2019 levels.
Here is some interesting data on New York subway usage (HT BR).
 This graph is from Todd W Schneider.
 This graph shows weekly turnstile entries since 2015.
Currently traffic is less than half of normal.
Currently traffic is less than half of normal.
This data is through Friday, July 22nd.
He notes: "Data updates weekly from the MTA’s public turnstile data, usually on Saturday mornings".
Sunday, July 24, 2022
Sunday Night Futures
by Calculated Risk on 7/24/2022 06:41:00 PM
Weekend:
• Schedule for Week of July 24, 2022
• FOMC Preview: 75bp Hike
Monday:
• At 8:30 AM ET, Chicago Fed National Activity Index for June. This is a composite index of other data.
• At 10:30 AM, Dallas Fed Survey of Manufacturing Activity for July.
From CNBC: Pre-Market Data and Bloomberg futures S&P 500 are down 5 and DOW futures are down 55 (fair value).
Oil prices were mixed over the last week with WTI futures at $95.51 per barrel and Brent at $104.18 per barrel. A year ago, WTI was at $72, and Brent was at $74 - so WTI oil prices are up 33% year-over-year.
Here is a graph from Gasbuddy.com for nationwide gasoline prices. Nationally prices are at $4.33 per gallon. A year ago, prices were at $3.15 per gallon, so gasoline prices are up $1.18 per gallon year-over-year.
FOMC Preview: 75bp Hike
by Calculated Risk on 7/24/2022 09:46:00 AM
Expectations are the FOMC will announce a 75bp rate increase in the federal funds rate at the meeting this week.
From Merrill Lynch:
1 Projections of change in real GDP and inflation are from the fourth quarter of the previous year to the fourth quarter of the year indicated.
The unemployment rate was at 3.6% in June. So far, the economic slowdown has not pushed up the unemployment rate.
2 Projections for the unemployment rate are for the average civilian unemployment rate in the fourth quarter of the year indicated.
As of May 2022, PCE inflation was up 6.3% from May 2021. This was below the cycle high of 6.6% YoY in March. Analysts are expecting inflation to decline slowly.
PCE core inflation was up 4.7% in May year-over-year. This was below the cycle high of 5.3% YoY in February.
----- Monday, July 25th -----
8:30 AM ET: Chicago Fed National Activity Index for June. This is a composite index of other data.
10:30 AM: Dallas Fed Survey of Manufacturing Activity for July.
----- Tuesday, July 26th -----
 9:00 AM: S&P/Case-Shiller House Price Index for May.
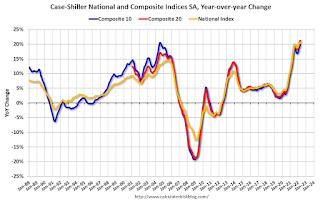
This graph shows the year-over-year change in the seasonally adjusted National Index, Composite 10 and Composite 20 indexes through the most recent report (the Composite 20 was started in January 2000).
The consensus is for a 21.0% year-over-year increase in the Comp 20 index for May.
9:00 AM: FHFA House Price Index for May. This was originally a GSE only repeat sales, however there is also an expanded index.
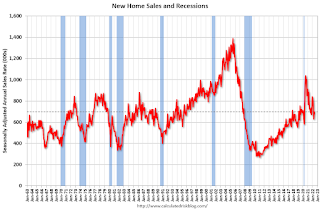 10:00 AM: New Home Sales for June from the Census Bureau.
This graph shows New Home Sales since 1963. The dashed line is the sales rate for last month.
The consensus is for 666 thousand SAAR, down from 696 thousand in May.
10:00 AM: Richmond Fed Survey of Manufacturing Activity for July.
----- Wednesday, July 27th -----
7:00 AM ET: The Mortgage Bankers Association (MBA) will release the results for the mortgage purchase applications index.
8:30 AM: Durable Goods Orders for June from the Census Bureau. The consensus is for a 0.5% decrease in durable goods orders.
10:00 AM: Pending Home Sales Index for June. The consensus is for a 3.7% decrease in the index.
2:00 PM: FOMC Meeting Announcement. The FOMC is expected to raise rates 75 bps, increasing the target range for the federal funds rate to 2‑1/4 to 2-1/2 percent.
2:30 PM: Fed Chair Jerome Powell holds a press briefing following the FOMC announcement.
----- Thursday, July 28th -----
8:30 AM: The initial weekly unemployment claims report will be released. The consensus is for 248 thousand down from 251 thousand last week.
8:30 AM: Gross Domestic Product, 2nd quarter (advance estimate), and annual update. The consensus is that real GDP increased 0.4% annualized in Q2, up from -1.6% in Q1.
11:00 AM: Kansas City Fed Survey of Manufacturing Activity for July. This is the last of the regional surveys for July.
----- Friday, July 29th -----
8:30 AM ET: Personal Income and Outlays, June 2022. The consensus is for a 0.5% increase in personal income, and for a 0.9% increase in personal spending. And for the Core PCE price index to increase 0.5%. PCE prices are expected to be up 6.6% YoY, and core PCE prices up 4.7% YoY.
9:45 AM: Chicago Purchasing Managers Index for July.
10:00 AM: University of Michigan's Consumer sentiment index (Final for July). The consensus is for a reading of 51.1.
 Click on graph for larger image.
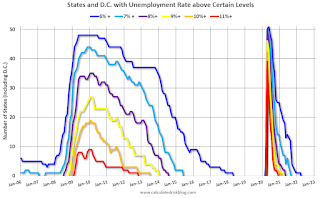
This graph shows the number of states (and D.C.) with unemployment rates at or above certain levels since January 2006.
 Click on graph for larger image.
The red line is for 2022, black is 2020, blue is the median, and dashed light blue is for 2021. Dashed purple is 2019 (STR is comparing to a strong year for hotels).
"We look for the Fed to lift the target range for the federal funds rate by 75bp to 2.25-2.5% while keeping its balance sheet normalization policies in place. ... We look for Chair Powell to repeat similar messages from the June FOMC meeting; namely that inflation is too high, the Fed is committed to restoring price stability, and some pain may be needed to bring inflation lower. Looking ahead, we expect another 50bp increase in September and two additional 25bp rate hikes by year end, which would bring the target range for the federal funds rate to 3.25-3.50%."From Goldman Sachs:
"We expect a 75bp rate hike at the July FOMC meeting next week. ... The key question for next week is what guidance Chair Powell will give about the size of a likely rate hike in September. We expect that Fed officials will want to keep their options open and will avoid any strong guidance. ... We continue to expect a 50bp hike in September and 25bp hikes in November and December to a terminal rate of 3.25-3.5%."
Analysts will be looking for comments on the size of future rate hikes.
Projections will not be released at this meeting. For review, here are the June projections.
In June, most participants expected thirteen 25bp rate hikes in 2022. The FOMC raised rates 25 bp in March, 50 bp in May, and 75 bp in June.
Wall Street forecasts have been revised down further since June due to the ongoing negative impacts from the pandemic. the war in Ukraine and financial tightening. For example, from BofA:
Wall Street forecasts have been revised down further since June due to the ongoing negative impacts from the pandemic. the war in Ukraine and financial tightening. For example, from BofA:
"We now forecast 1.1% GDP growth for 2022 and expect growth to slow to -0.2% in 2023"
| GDP projections of Federal Reserve Governors and Reserve Bank presidents, Change in Real GDP1 | ||||
|---|---|---|---|---|
| Projection Date | 2022 | 2023 | 2024 | |
| June 2022 | 1.5 to 1.9 | 1.3 to 2.0 | 1.5 to 2.0 | |
| Mar 2022 | 2.5 to 3.0 | 2.1 to 2.5 | 1.8 to 2.0 | |
The unemployment rate was at 3.6% in June. So far, the economic slowdown has not pushed up the unemployment rate.
| Unemployment projections of Federal Reserve Governors and Reserve Bank presidents, Unemployment Rate2 | ||||
|---|---|---|---|---|
| Projection Date | 2022 | 2023 | 2024 | |
| June 2022 | 3.6 to 3.8 | 3.8 to 4.1 | 3.9 to 4.1 | |
| Mar 2022 | 3.4 to 3.6 | 3.3 to 3.6 | 3.2 to 3.7 | |
As of May 2022, PCE inflation was up 6.3% from May 2021. This was below the cycle high of 6.6% YoY in March. Analysts are expecting inflation to decline slowly.
| Inflation projections of Federal Reserve Governors and Reserve Bank presidents, PCE Inflation1 | ||||
|---|---|---|---|---|
| Projection Date | 2022 | 2023 | 2024 | |
| June 2022 | 5.0 to 5.3 | 2.4 to 3.0 | 2.0 to 2.5 | |
| Mar 2022 | 4.1 to 4.7 | 2.3 to 3.0 | 2.1 to 2.4 | |
PCE core inflation was up 4.7% in May year-over-year. This was below the cycle high of 5.3% YoY in February.
| Core Inflation projections of Federal Reserve Governors and Reserve Bank presidents, Core Inflation1 | ||||
|---|---|---|---|---|
| Projection Date | 2022 | 2023 | 2024 | |
| June 2022 | 4.2 to 4.5 | 2.5 to 3.2 | 2.1 to 2.5 | |
| Mar 2022 | 3.9 to 4.4 | 2.4 to 3.0 | 2.1 to 2.4 | |
Saturday, July 23, 2022
Real Estate Newsletter Articles this Week
by Calculated Risk on 7/23/2022 02:11:00 PM
At the Calculated Risk Real Estate Newsletter this week:
• Final Look at Local Housing Markets in June
• NAR: Existing-Home Sales Decreased to 5.12 million SAAR in June
• Slowdown in Showings Suggests Further Declines in Existing Home Sales in Coming Months
• June Housing Starts: All-Time Record Housing Units Under Construction
• 3rd Look at Local Housing Markets in June, Sales Down Sharply, Inventory "Surged"
• Record Single Family Investor Buying in Q1, Possible evidence of Slowdown in Q2
This is usually published 4 to 6 times a week and provides more in-depth analysis of the housing market.
You can subscribe at https://calculatedrisk.substack.com/
Most content is available for free (and no Ads), but please subscribe!
Schedule for Week of July 24, 2022
by Calculated Risk on 7/23/2022 08:11:00 AM
The key report this week is the advance estimate of Q2 GDP.
Other key reports include June New Home Sales, Personal Income and Outlays for June, and Case-Shiller house prices for May.
For manufacturing, the July Richmond, Dallas and Kansas City Fed manufacturing surveys will be released.
The FOMC meets this week and is expected to raise rates 75 bp.
8:30 AM ET: Chicago Fed National Activity Index for June. This is a composite index of other data.
10:30 AM: Dallas Fed Survey of Manufacturing Activity for July.
 9:00 AM: S&P/Case-Shiller House Price Index for May.
This graph shows the year-over-year change in the seasonally adjusted National Index, Composite 10 and Composite 20 indexes through the most recent report (the Composite 20 was started in January 2000).
The consensus is for a 21.0% year-over-year increase in the Comp 20 index for May.
9:00 AM: FHFA House Price Index for May. This was originally a GSE only repeat sales, however there is also an expanded index.
 10:00 AM: New Home Sales for June from the Census Bureau.
 This graph shows New Home Sales since 1963. The dashed line is the sales rate for last month.
The consensus is for 666 thousand SAAR, down from 696 thousand in May.
10:00 AM: Richmond Fed Survey of Manufacturing Activity for July.
7:00 AM ET: The Mortgage Bankers Association (MBA) will release the results for the mortgage purchase applications index.
8:30 AM: Durable Goods Orders for June from the Census Bureau. The consensus is for a 0.5% decrease in durable goods orders.
10:00 AM: Pending Home Sales Index for June. The consensus is for a 3.7% decrease in the index.
2:00 PM: FOMC Meeting Announcement. The FOMC is expected to raise rates 75 bps, increasing the target range for the federal funds rate to 2‑1/4 to 2-1/2 percent.
2:30 PM: Fed Chair Jerome Powell holds a press briefing following the FOMC announcement.
8:30 AM: The initial weekly unemployment claims report will be released. The consensus is for 248 thousand down from 251 thousand last week.
8:30 AM: Gross Domestic Product, 2nd quarter (advance estimate), and annual update. The consensus is that real GDP increased 0.4% annualized in Q2, up from -1.6% in Q1.
11:00 AM: Kansas City Fed Survey of Manufacturing Activity for July. This is the last of the regional surveys for July.
8:30 AM ET: Personal Income and Outlays, June 2022. The consensus is for a 0.5% increase in personal income, and for a 0.9% increase in personal spending. And for the Core PCE price index to increase 0.5%. PCE prices are expected to be up 6.6% YoY, and core PCE prices up 4.7% YoY.
9:45 AM: Chicago Purchasing Managers Index for July.
10:00 AM: University of Michigan's Consumer sentiment index (Final for July). The consensus is for a reading of 51.1.
Friday, July 22, 2022
COVID July 22, 2022, Update on Cases, Hospitalizations and Deaths
by Calculated Risk on 7/22/2022 09:26:00 PM
On COVID (focus on hospitalizations and deaths):
Hospitalizations have almost quadrupled from the lows in April 2022.
 Click on graph for larger image.
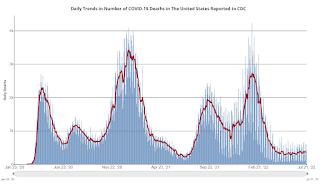
This graph shows the daily (columns) and 7-day average (line) of deaths reported.
| COVID Metrics | ||||
|---|---|---|---|---|
| Now | Week Ago | Goal | ||
| New Cases per Day2 | 126,128 | 128,126 | ≤5,0001 | |
| Hospitalized2🚩 | 35,362 | 33,246 | ≤3,0001 | |
| Deaths per Day2 | 355 | 378 | ≤501 | |
| 1my goals to stop daily posts, 27-day average for Cases, Currently Hospitalized, and Deaths 🚩 Increasing 7-day average week-over-week for Cases, Hospitalized, and Deaths ✅ Goal met. | ||||
 Click on graph for larger image.
This graph shows the daily (columns) and 7-day average (line) of deaths reported.
Average daily deaths bottomed in July 2021 at 214 per day.
BLS: Eight States Set New Record Series Low Unemployment rates in June
by Calculated Risk on 7/22/2022 03:13:00 PM
From the BLS: Regional and State Employment and Unemployment Summary
Unemployment rates were lower in June in 10 states and the District of Columbia, higher in 2 states, and stable in 38 states, the U.S. Bureau of Labor Statistics reported today. All 50 states and the District had jobless rate decreases from a year earlier.
...
Minnesota had the lowest jobless rate in June, 1.8 percent, closely followed by Nebraska, 1.9 percent. The next lowest rates were in New Hampshire and Utah, 2.0 percent each. The rates in Minnesota and New Hampshire set new series lows, as did the rates in the following six states (all state series begin in 1976): Alabama (2.6 percent), Georgia (2.9 percent), Kentucky (3.7 percent), Louisiana (3.8 percent), Mississippi (3.8 percent), and Missouri (2.8 percent). The District of Columbia had the highest unemployment rate, 5.5 percent, followed by New Mexico, 4.9 percent.
emphasis added
 Click on graph for larger image.
This graph shows the number of states (and D.C.) with unemployment rates at or above certain levels since January 2006.
Eight states set new series record low unemployment rates in June, and currently 14 states are at series record low unemployment rates.
Q2 GDP Forecasts: Slightly Negative
by Calculated Risk on 7/22/2022 10:58:00 AM
The advance estimate of Q2 GDP will be released next week, and the consensus is for real GDP to increase 0.4% in Q2.
Note: We've seen two consecutive quarters of negative GDP before without a recession (that isn't the definition). If Q2 is negative, it will mostly be due to inventory and trade issues. No worries. My view is the US economy is not currently in a recession, see: Predicting the Next Recession
From BofA:
In next week’s advance estimate of 2Q US GDP, we expect the BEA to report that the economy contracted by 1.5% qoq saar, marking the second consecutive decline in quarterly output. [July 22 estimate]From Goldman:
emphasis added
[W]e lowered our Q2 GDP tracking estimate by 0.1pp to +0.5% (qoq ar). [July 20 estimate]And from the Altanta Fed: GDPNow
The GDPNow model estimate for real GDP growth (seasonally adjusted annual rate) in the second quarter of 2022 is -1.6 percent on July 19, down from -1.5 percent on July 15. [July 19 estimate]
Hotels: Occupancy Rate Down 7.4% Compared to Same Week in 2019
by Calculated Risk on 7/22/2022 08:26:00 AM
After two consecutive weeks of lower demand around the Fourth of July holiday, U.S. hotel performance bounced back from the previous week, according to STR‘s latest data through July 16.The following graph shows the seasonal pattern for the hotel occupancy rate using the four-week average.
July 10-16, 2022 (percentage change from comparable week in 2019*):
• Occupancy: 72.0% (-7.4%)
• Average daily rate (ADR): US$157.23 (+14.9%)
• Revenue per available room (RevPAR): US$113.28 (+6.4%)
*Due to the pandemic impact, STR is measuring recovery against comparable time periods from 2019.
emphasis added
Click on graph for larger image.The red line is for 2022, black is 2020, blue is the median, and dashed light blue is for 2021. Dashed purple is 2019 (STR is comparing to a strong year for hotels).
The 4-week average of the occupancy rate is close to the median rate for the previous 20 years (Blue).
Note: Y-axis doesn't start at zero to better show the seasonal change.
The 4-week average of the occupancy rate will increase further seasonally over the next month.

In Memoriam: Doris "Tanta" Dungey


| Privacy Policy |
| Copyright © 2007 - 2025 CR4RE LLC |
| Excerpts NOT allowed on x.com |