 RSS Feed
 by Calculated Risk on 8/04/2022 08:37:00 AM
Thursday, August 04, 2022
Weekly Initial Unemployment Claims increase to 260,000
The DOL reported:
In the week ending July 30, the advance figure for seasonally adjusted initial claims was 260,000, an increase of 6,000 from the previous week's revised level. The previous week's level was revised down by 2,000 from 256,000 to 254,000. The 4-week moving average was 254,750, an increase of 6,000 from the previous week's revised average. The previous week's average was revised down by 500 from 249,250 to 248,750.The following graph shows the 4-week moving average of weekly claims since 1971.
emphasis added
 Click on graph for larger image.
The dashed line on the graph is the current 4-week average. The four-week average of weekly unemployment claims increased to 254,750.
The previous week was revised down.
Weekly claims were lower than the consensus forecast.
Wednesday, August 03, 2022
Thursday: Trade Deficit, Unemployment Claims
by Calculated Risk on 8/03/2022 09:17:00 PM
 Wednesday:
• At 8:30 AM ET, Trade Balance report for June from the Census Bureau. The consensus is the trade deficit to be $80.1 billion. The U.S. trade deficit was at $85.5 Billion the previous month.
• Also at 8:30 AM, The initial weekly unemployment claims report will be released. The consensus is for 265 thousand up from 256 thousand last week.
On COVID (focus on hospitalizations and deaths):
Hospitalizations have almost quadrupled from the lows in April 2022.
 Click on graph for larger image.
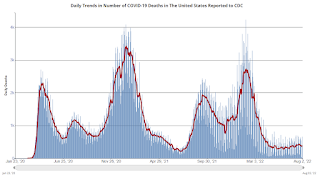
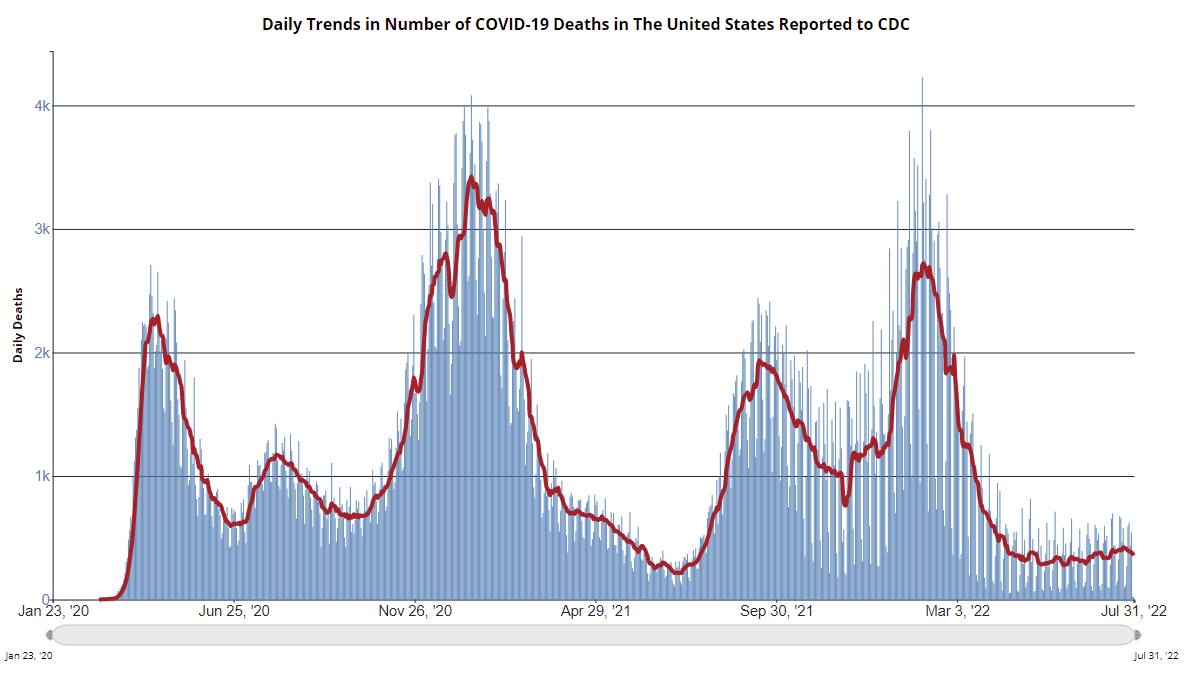
This graph shows the daily (columns) and 7-day average (line) of deaths reported.
| COVID Metrics | ||||
|---|---|---|---|---|
| Now | Week Ago | Goal | ||
| New Cases per Day2 | 119,034 | 126,812 | ≤5,0001 | |
| Hospitalized2 | 37,132 | 37,286 | ≤3,0001 | |
| Deaths per Day2 | 387 | 396 | ≤501 | |
| 1my goals to stop daily posts, 27-day average for Cases, Currently Hospitalized, and Deaths 🚩 Increasing 7-day average week-over-week for Cases, Hospitalized, and Deaths ✅ Goal met. | ||||
 Click on graph for larger image.
This graph shows the daily (columns) and 7-day average (line) of deaths reported.
Average daily deaths bottomed in July 2021 at 214 per day.
Heavy Truck Sales Solid in July
by Calculated Risk on 8/03/2022 02:28:00 PM
The BEA released their estimate of vehicle sales for July this morning.
This graph shows heavy truck sales since 1967 using data from the BEA. The dashed line is the July 2022 seasonally adjusted annual sales rate (SAAR).
Heavy truck sales really collapsed during the great recession, falling to a low of 180 thousand SAAR in May 2009. Then heavy truck sales increased to a new all-time high of 570 thousand SAAR in April 2019.
 Click on graph for larger image.
Note: "Heavy trucks - trucks more than 14,000 pounds gross vehicle weight."
Heavy truck sales declined sharply at the beginning of the pandemic, falling to a low of 308 thousand SAAR in May 2020.
Heavy truck sales were at 477 thousand SAAR in July, up from 470 thousand in June, and up from 440 thousand SAAR in July 2021.
Usually, heavy truck sales decline sharply prior to a recession. Sales were solid in July.
How Much will the Fannie & Freddie Conforming Loan Limit Increase for 2023?
by Calculated Risk on 8/03/2022 11:54:00 AM
Today, in the Calculated Risk Real Estate Newsletter: How Much will the Fannie & Freddie Conforming Loan Limit Increase for 2023?
A brief excerpt:
With house prices up sharply again over the last year, an interesting question is: How much will the Fannie & Freddie conforming loan limits (CLL) increase for 2023? And how much will the FHA insured loan limits increase?There is much more in the article. You can subscribe at https://calculatedrisk.substack.com/
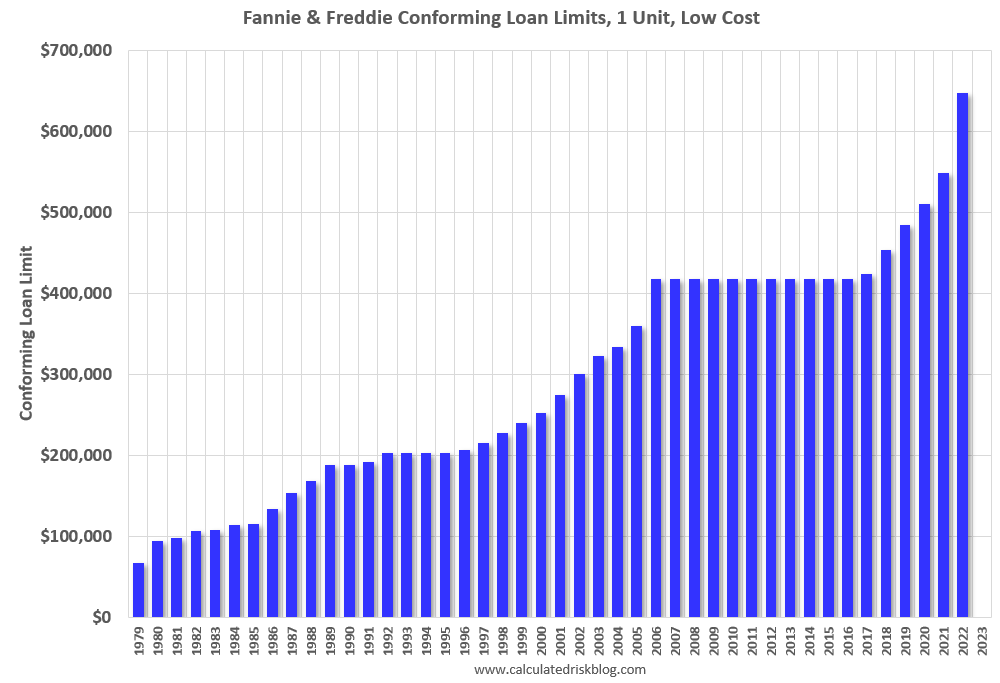
First, there are different loan limits for various geographical areas. There are also different loan limits depending on the number of units (from 1 to 4 units). For example, currently the CLL is $647,200 for one-unit properties in low-cost areas. For Los Angeles County, the CLL is $970,800 for one-unit properties (50% higher than the baseline CLL).
...
This graph shows the CLL since 1979. The CLL was unchanged from 2006 though 2016.
...
The adjustment is based on the House Price Index value in Q3 divided by Q3 in the prior year. The FHFA index is a repeat sales index, similar to Case-Shiller.
...
Currently we only have data for Q1 2022 for the quarterly index (up 17.5% from Q1 2021), and the Purchase-Only index was up 18.3% through May 2022.
...
We need the house price data through September 2022 to calculate the conforming loan limit for 2023. This quarterly data will be released in late November.
Based on the current year-over-year house price change, the CLL could be close to $760,000 in 2023. However, year-over-year (YoY) house price growth is clearly slowing, and it is possible the CLL will be in the low-to-mid $700 thousand range for 2023.
ISM® Services Index Increased to 56.7% in July, Employment Contracted
by Calculated Risk on 8/03/2022 10:06:00 AM
(Posted with permission). The ISM® Services index was at 56.7%, up from 55.3% last month. The employment index increased to 49.1%, from 47.4%. Note: Above 50 indicates expansion, below 50 in contraction.
From the Institute for Supply Management: Services PMI® at 56.7% July 2022 Services ISM® Report On Business®
Economic activity in the services sector grew in July for the 26th month in a row — with the Services PMI® registering 56.7 percent — say the nation’s purchasing and supply executives in the latest Services ISM® Report On Business®.This was well above expectations.
The report was issued today by Anthony Nieves, CPSM, C.P.M., A.P.P., CFPM, Chair of the Institute for Supply Management® (ISM®) Services Business Survey Committee: “In July, the Services PMI® registered 56.7 percent, 1.4 percentage points higher than June’s reading of 55.3 percent. The Business Activity Index registered 59.9 percent, an increase of 3.8 percentage points compared to the reading of 56.1 percent in June. The New Orders Index figure of 59.9 percent is 4.3 percentage points higher than the June reading of 55.6 percent.
...
The Employment Index (49.1 percent) contracted for the second consecutive month ...
emphasis added
MBA: Mortgage Applications Increase in Latest Weekly Survey
by Calculated Risk on 8/03/2022 07:00:00 AM
From the MBA: Mortgage Applications Increase in Latest MBA Weekly Survey
— Mortgage applications increased 1.2 percent from one week earlier, according to data from the Mortgage Bankers Association’s (MBA) Weekly Mortgage Applications Survey for the week ending July 29, 2022.
... The Refinance Index increased 2 percent from the previous week and was 82 percent lower than the same week one year ago. The seasonally adjusted Purchase Index increased 1 percent from one week earlier. The unadjusted Purchase Index increased 1 percent compared with the previous week and was 16 percent lower than the same week one year ago.
“Mortgage rates declined last week following another announcement of tighter monetary policy from the Federal Reserve, with the likelihood of more rate hikes to come. Treasury yields dropped as a result, as investors continue to expect a weaker macroeconomic environment in the coming months. The 30-year fixed rate saw the largest weekly decline since 2020, falling 31 basis points to 5.43 percent,” said Joel Kan, MBA’s Associate Vice President of Economic and Industry Forecasting. “The drop in rates led to increases in both refinance and purchase applications, but compared to a year ago, activity is still depressed. Lower mortgage rates, combined with signs of more inventory coming to the market, could lead to a rebound in purchase activity.”
...
The average contract interest rate for 30-year fixed-rate mortgages with conforming loan balances ($647,200 or less) decreased to 5.43 percent from 5.74 percent, with points increasing to 0.65 from 0.61 (including the origination fee) for 80 percent loan-to-value ratio (LTV) loans.
emphasis added
 Click on graph for larger image.
The first graph shows the refinance index since 1990.
With higher mortgage rates, the refinance index has declined sharply over the last several months.
The refinance index is just above the lowest level since the year 2000.
The second graph shows the MBA mortgage purchase index
 According to the MBA, purchase activity is down 16% year-over-year unadjusted.
The purchase index is now only 14% above the pandemic low.
Note: Red is a four-week average (blue is weekly).
Note: Red is a four-week average (blue is weekly).
Tuesday, August 02, 2022
Wednesday: ISM Services
by Calculated Risk on 8/02/2022 11:56:00 PM
 Wednesday:
• At 7:00 AM ET, The Mortgage Bankers Association (MBA) will release the results for the mortgage purchase applications index.
• At 10:00 AM, the ISM Services Index for July. The consensus is for a reading of 53.5, down from 55.3.
On COVID (focus on hospitalizations and deaths):
Hospitalizations have almost quadrupled from the lows in April 2022.
 Click on graph for larger image.
This graph shows the daily (columns) and 7-day average (line) of deaths reported.
| COVID Metrics | ||||
|---|---|---|---|---|
| Now | Week Ago | Goal | ||
| New Cases per Day2 | 114,021 | 127,727 | ≤5,0001 | |
| Hospitalized2 | 36,835 | 37,034 | ≤3,0001 | |
| Deaths per Day2 | 357 | 415 | ≤501 | |
| 1my goals to stop daily posts, 27-day average for Cases, Currently Hospitalized, and Deaths 🚩 Increasing 7-day average week-over-week for Cases, Hospitalized, and Deaths ✅ Goal met. | ||||
 Click on graph for larger image.
This graph shows the daily (columns) and 7-day average (line) of deaths reported.
Average daily deaths bottomed in July 2021 at 214 per day.
Vehicles Sales Increased to 13.35 million SAAR in July
by Calculated Risk on 8/02/2022 07:45:00 PM
Wards Auto released their estimate of light vehicle sales for July. Wards Auto estimates sales of 13.35 million SAAR in July 2022 (Seasonally Adjusted Annual Rate), up 2.7% from the June sales rate, and down 9.0% from July 2021.
 Click on graph for larger image.
This graph shows light vehicle sales since 2006 from the BEA (blue) and Wards Auto's estimate for July (red).
The impact of COVID-19 was significant, and April 2020 was the worst month. After April 2020, sales increased, and were close to sales in 2019 (the year before the pandemic).
However, sales decreased late last year due to supply issues. It appears the "supply chain bottom" was in September 2021.
 The second graph shows light vehicle sales since the BEA started keeping data in 1967.
 Will 5% Mortgage Rates Cushion the Housing Market?
by Calculated Risk on 8/02/2022 12:46:00 PM
Today, in the Calculated Risk Real Estate Newsletter: Will 5% Mortgage Rates Cushion the Housing Market?
A brief excerpt:
The following graph shows the year-over-year change in principal & interest (P&I) assuming a fixed loan amount since 1977. Currently P&I is up about 30% year-over-year for a fixed amount (this doesn’t take into account the change in house prices).There is much more in the article. You can subscribe at https://calculatedrisk.substack.com/
This is less than the 35% year-over-year increase average in June, but still up sharply.
If we include the increase in house prices, payments are up more than 50% year-over-year on the same home.
The bottom-line is the recent decline in mortgage rates will help at the margin, but the housing market will remain under pressure with mortgage rates at 5% (fewer sales, slowing house price growth).

NY Fed Q2 Report: Total Household Debt Surpasses $16 trillion
by Calculated Risk on 8/02/2022 11:11:00 AM
From the NY Fed: Total Household Debt Surpasses $16 trillion in Q2 2022; Mortgage, Auto Loan, and Credit Card Balances Increase
The Federal Reserve Bank of New York's Center for Microeconomic Data today issued its Quarterly Report on Household Debt and Credit. The Report shows an increase in total household debt in the second quarter of 2022, increasing by $312 billion (2%) to $16.15 trillion. Balances now stand $2 trillion higher than at the end of 2019, before the COVID-19 pandemic. The report is based on data from the New York Fed's nationally representative Consumer Credit Panel.
Mortgage balances rose by $207 billion in the second quarter of 2022 and stood at $11.39 trillion at the end of June. Credit card balances also increased by $46 billion. Although seasonal patterns typically include an increase in the second quarter, the 13% cumulative increase in credit card balances since Q2 2021 represents the largest in more than 20 years. Auto loan balances increased by a solid $33 billion in the second quarter, while student loan balances were roughly unchanged from the first quarter and stand at $1.59 trillion. Other balances–which includes retail cards and other consumer loans –increased by a robust $25 billion. In total, non-housing balances grew by $103 billion, the largest increase seen since 2016.
Mortgage originations slightly declined in the second quarter and stood at $758 billion. The volume of newly originated auto loans increased to $199 billion, continuing the high volumes seen in dollar terms since Q3 2020. Aggregate limits on credit card accounts increased by $100 billion and now stand at $4.22 trillion–the largest increase in more than ten years.
emphasis added
 Click on graph for larger image.
Here are three graphs from the report:
The first graph shows aggregate consumer debt increased in Q2. Household debt previously peaked in 2008 and bottomed in Q3 2013. Unlike following the great recession, there wasn't a huge decline in debt during the pandemic.
From the NY Fed:
Aggregate household debt balances increased by $312 billion in the second quarter of 2022, a 2.0% rise from 2022Q1. Balances now stand at $16.15 trillion and have increased by $2 trillion since the end of 2019, just before the pandemic recession.
 The second graph shows the percent of debt in delinquency.
The overall delinquency rate was unchanged in Q2. From the NY Fed:
Aggregate delinquency rates were unchanged again in the second quarter of 2022 and remain very low, after declining sharply through the beginning of the pandemic, although aggregate delinquency rates have seen some change in the composition. The share of balances that are severely derogatory has declined to 1.1%, although the decline has been offset by increases in balances that are 30 days late. As of June, 2.7% of outstanding debt was in some stage of delinquency, a 2.0 percentage point decrease from the first quarter of 2019, just before the COVID-19 pandemic hit the United States.There is much more in the report.


